2. Historical Emissions Analysis
2. Historical Emissions Analysis
2.1 Background data and sources
All historical emissions data presented were originally published in Greenhouse Gas Inventories for England, Scotland, Wales & Northern Ireland: 1990-2016 by the National Atmospheric Emissions Inventory[3]. Some information presented is from alternative sources where stated.
The inventory is compiled annually and consists of a time series of emissions back to 1990[4]. It is updated in full in every publication to take account of on-going improvements in estimation techniques and methodology. Emissions levels are presented in either mega-tonnes or kilo-tonnes[5] of carbon dioxide equivalent[6] (Mt CO2e, Kt CO2e).
Emissions from international aviation and shipping were not originally reported in the inventory, but have been included since 2009 under a separate category titled Exports. The Scottish Government has committed to including them in the emissions targets, hence references to maritime and aviation emissions refer to both domestic and international combined, unless otherwise stated.
Improvements to the methodology for estimating shipping emissions this year has resulted in an increase in the estimates for gas oil and fuel oil used in Scotland. This has caused recalculations for emissions from domestic navigation and fishing vessels. Changes to shipping have on average increased emissions by 1,5 Mt CO2e across the series.
In line with the methodology used to report against the Climate Change (Scotland) Act, emissions from transport reported only include those at the point of use, also known as tailpipe emissions. As a result, lifecycle and displaced impacts, such as the emissions from generating the electricity powering electric trains, are not included.
2.2 Emissions trends for Scotland
In 2016 emissions from all sectors amounted to 38.6 Mt CO2e, down 10.3% from 43.0 Mt CO2e in 2015. Source adjusted emissions[7] were 41.5 Mt CO2e[8] in 2016, 45.2% below the 1990 baseline.
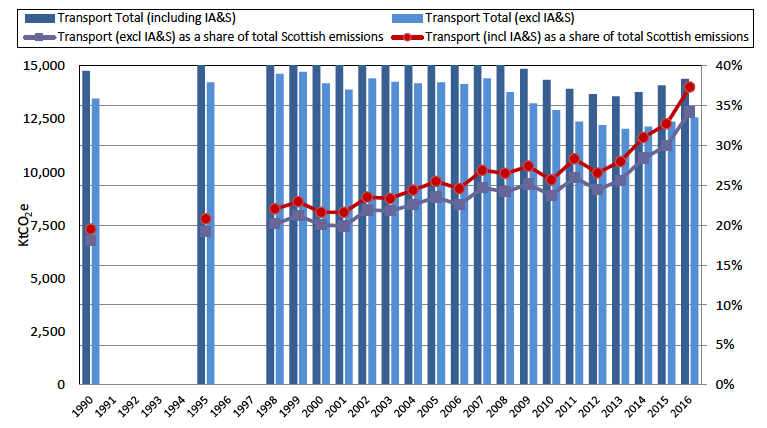
Measured at source, transport emissions including International Aviation and Shipping (IAS)[9] accounted for 14.4 Mt CO2e in 2016, an increase of 2.3% on the previous year. The inventory states that transport emissions have now risen for three years[10]. Furthermore, in 2016 transport was the largest contributing sector to greenhouse gas emissions in Scotland.
The factors affecting transport emissions are numerous and complex. The 2008 recession was a contributing factor to the fall in emissions from that time, alongside investments in transport infrastructure, efficiency improvements and fluctuations in the price of oil. The significant fall in oil prices since 2014 is likely to have contributed to the increase in demand for fuel and travel in the period since.
Excluding IAS, transport accounted for 34.2% of Scottish greenhouse gas emissions in 2016. This proportion is 37.3% when including IAS. Figure 1 shows the growing prominence of transport as a source of greenhouse gas emissions since 1990.
Figure 1: Historical emissions from transport and its share of total emissions in Scotland
Source: National Atmospheric Emissions Inventory
2.3 Emissions analysis by transport sector
2.3.1 Road Transport
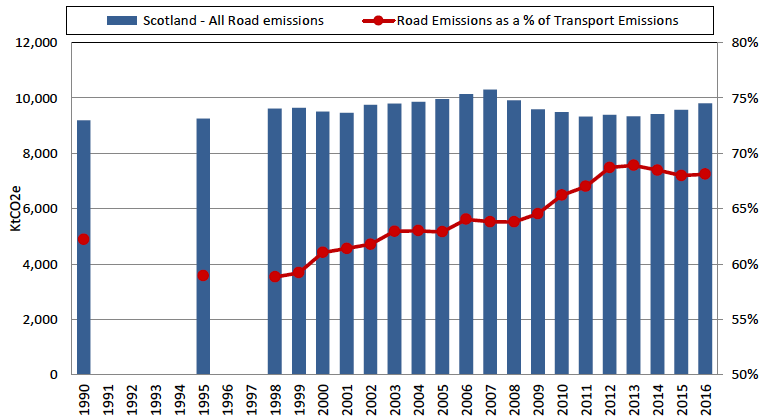
Road transport accounted for 9.8 Mt CO2e in 2016. This is 68.1% of total transport emissions; a proportion which has generally risen since 1998. Figure 2 shows road emissions since 1990 with the proportion of transport emissions it accounts for.
Figure 2: Historical road emissions in Scotland
Source: National Atmospheric Emissions Inventory
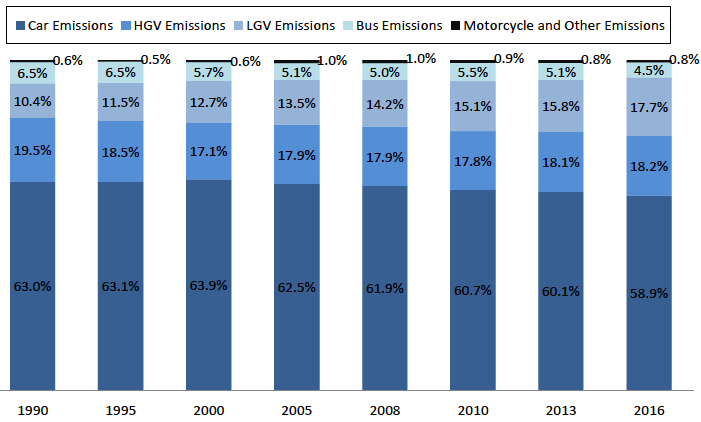
Figure 3 shows the proportion of road emissions for each vehicle type for selected years. Since 1990, there has been a slow shift towards goods vehicle emissions relative to cars.
Figure 3: Emissions from vehicles as a proportion of road emissions for selected years
Source: National Atmospheric Emissions Inventory
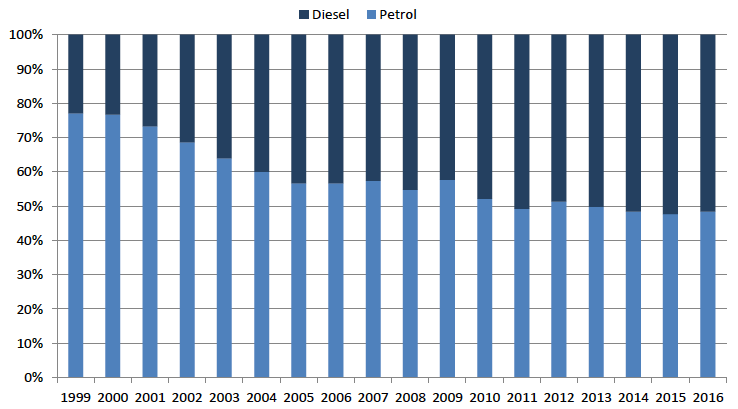
Changing consumer preferences on fuel are a contributing factor to the falling proportion of road emissions from cars. Diesel cars tend to be more fuel efficient, and hence have lower greenhouse gas emissions. Figure 4 shows the increasing proportion of new vehicles powered by diesel relative to petrol. New registrations of diesel vehicles overtook those of petrol in 2013, however, a decline in the number of diesel cars being registered is expected in the future years, in part due to the 2017 changes in Vehicle Excise Duty (VED) which introduced a higher rate for diesel cars that don’t meet the Real Driving Emissions 2 (RDE2) standard for nitrogen oxide emissions.
Figure 4: Distribution of new Scottish vehicle registrations over time
Source: Scottish Transport Statistics 2017 Table 1.1
2.3.2 Shipping
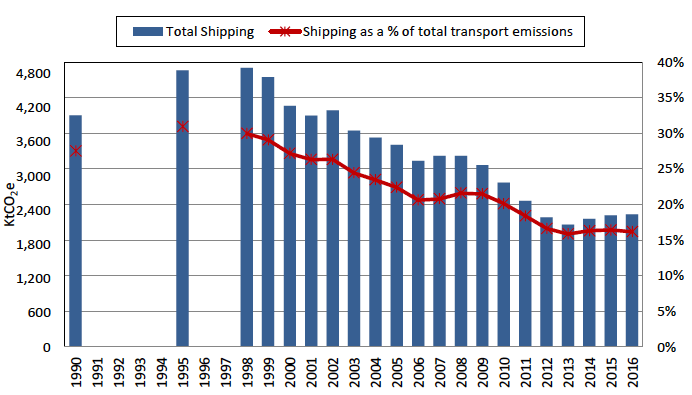
Shipping emissions were 2.3 Mt CO2e in 2016. This is 16.2% of total transport emissions, an all-time low. Figure 5 shows a generally downward trend in total shipping emissions from their all-time peak in 1998.
Figure 5: Historical shipping emissions
Source: National Atmospheric Emissions Inventory
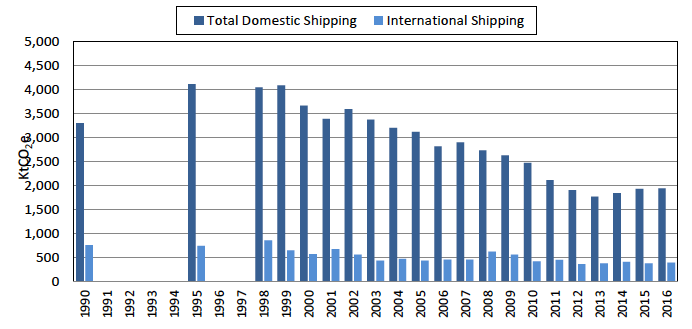
Figure 6 shows shipping emissions disaggregated into domestic and international. International shipping emissions are much more volatile than domestic emissions, which have seen a steady decrease overall but a slight increase in recent years. A potential reason for the volatility in international emissions is economic activity, which drives demand for imports and exports.
Figure 6: Historical domestic and international shipping emissions
Source: National Atmospheric Emissions Inventory
2.3.3 Aviation
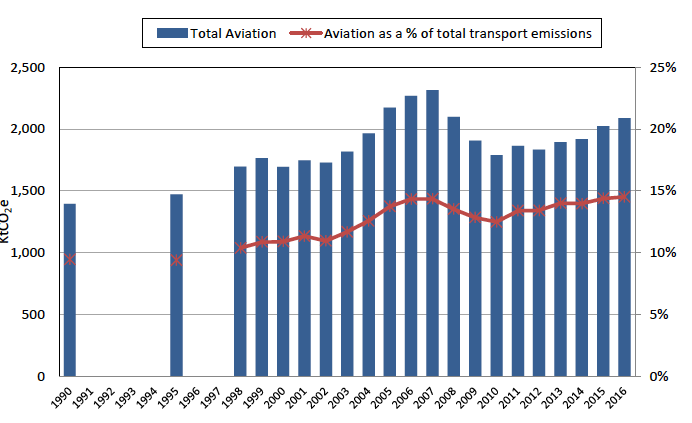
In 2016 total aviation emissions, including aircraft support vehicles and military aircraft, were 2.1 Mt CO2e, an increase of 3.2% on 2015 and 50.0% above 1990. Aviation accounted for 14.5% of transport emissions in 2016. Total aircraft movements fell 13.1%% between 2006 and 2016[11]. Contrasting with rising emissions this suggests the use of larger aircraft and / or higher load factors on planes. Figure 7 shows the trend in total aviation emissions since 1990.
Figure 7: Historical aviation emissions and share of total transport emissions
Source: National Atmospheric Emissions Inventory
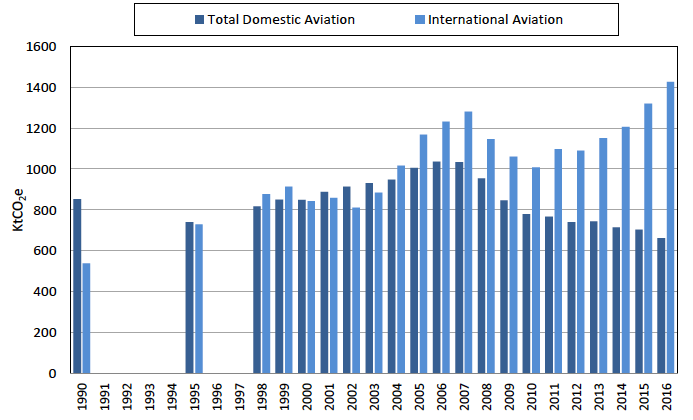
Figure 8 disaggregates the data in figure 7 to show domestic and international aviation emissions. In recent years, emissions from domestic aviation have fallen while international emissions have risen to a new high in 2016. Domestic aircraft movements fell -23.1% between 2006 and 2016, while international aircraft movements increased 5.5%[12].
Figure 8: Domestic and international aviation emissions over time
Source: National Atmospheric Emissions Inventory
2.3.4 International aviation and shipping
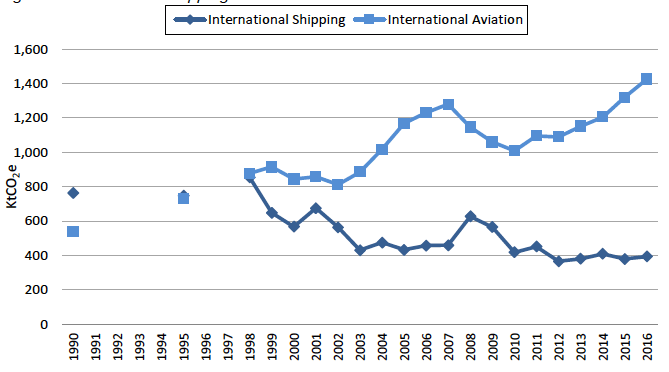
Emissions from international aviation and shipping were 1.8 Mt CO2e in 2016, a rise of 7.0% on the previous year, and 39.7% above the 1990 baseline. Figure 9 shows the pattern of international emissions over time, disaggregated by aviation and shipping. It is characterised by the general falling pattern of shipping emissions and the rising pattern of aviation emissions.
Figure 9: International shipping and aviation emissions over time
Source: National Atmospheric Emissions Inventory
2.3.5 Rail
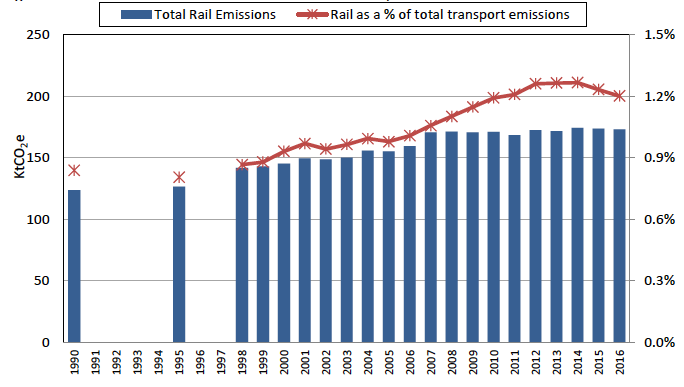
Rail accounted for 0.17 Mt CO2e in 2016; 0.4% below the previous year, but 39.9% above the 1990 level. In the ten years to 2015/16, passenger kilometres on Scotrail services increased by 21.2%, and scheduled train route kilometres increased 14.2%[13]. Figure 10 shows the trend of rail emissions since 1990.
Figure 10: Rail emissions and its share of total transport emissions over time
Source: National Atmospheric Emissions Inventory
2.4 Road emissions by vehicle type
2.4.1 Cars
Emissions from cars rose in 2014, 2015 and 2016, having generally fallen since 2007. Between 2006 and 2016, car kilometres in Scotland rose from 34.5 million to 35.4 million[14], while emissions fell from 6.3 Mt CO2e to 5.8 Mt CO2e. Despite this improved fuel efficiency, in 2016 cars still accounted for 58.9% of road emissions and 40.1% of total transport emissions in Scotland. These are the highest proportions of any mode of transport.
2.4.2 Heavy Goods Vehicles
At 18.2%, HGVs accounted for the second largest proportion of road emissions in 2016. This is 12.4% of total transport emissions. At 1.8 Mt CO2e, HGV emissions were 2.3% higher than the previous year, but 0.4% below the 1990 figure. Between 2006 and 2016 HGV kilometres in Scotland fell by 2.6%.
2.4.3 Light Goods Vehicles
LGV emissions were 81.3% higher in 2016 than in 1990. In 2016 they accounted for 1.7 Mt CO2e, 6.4% more than the previous year. This is 17.7% of road emissions and 12.0% of total transport emissions. In the decade to 2016, light goods vehicle kilometres in Scotland rose 27.9%, from 5.8 million to 7.4 million.
2.4.4 Buses and coaches
Buses and coaches accounted for 0.4 Mt CO2e in 2016, a drop of 6.6% on the previous year. Bus emissions have gently declined since 1990, and in 2016 stand 26.4% below this 1990 figure. Between 2006 and 2016, published public service vehicle kilometres fell -10.2%[15].
2.4.5 Motorcycles
Motorcycles emitted 0.034 Mt CO2e in 2016. This is only 0.3% of road emissions and 0.2% of transport emissions. Motorcycle emissions have been low since 1990, and as such have never significantly impacted Scotland’s transport emissions in the time the emissions inventory has been collated.
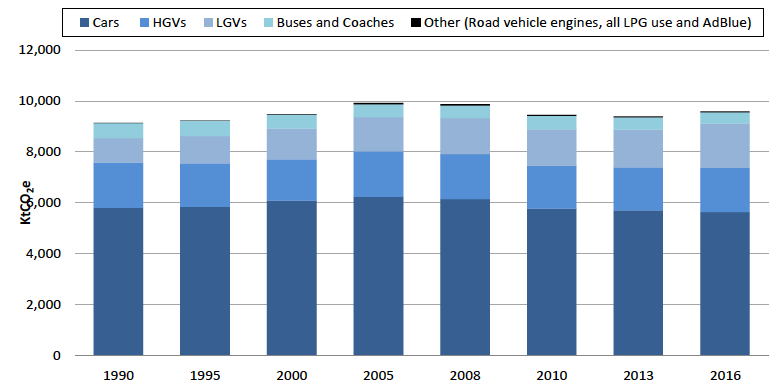
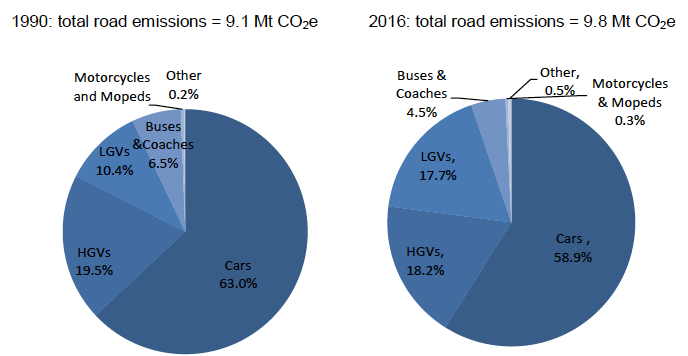
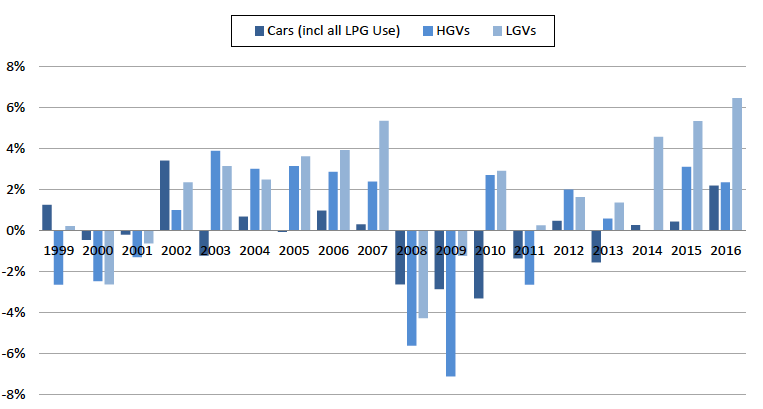
Figures 11, 12 and 13 illustrate changes in road emissions by vehicle type, the changing share of road emissions attributable to different vehicle types and year on year changes in emissions of different vehicle types respectively.
Figure 11: Road emissions by vehicle type, selected years
Source: National Atmospheric Emissions Inventory
Figure 12: Share of road emissions by vehicle type, 1990 and 2016
Source: National Atmospheric Emissions Inventory
Figure 13: Year on year change in emissions by vehicle type, 1999-2016
Source: National Atmospheric Emissions Inventory
2.5 Road emissions by type of road
2.5.1 Rural
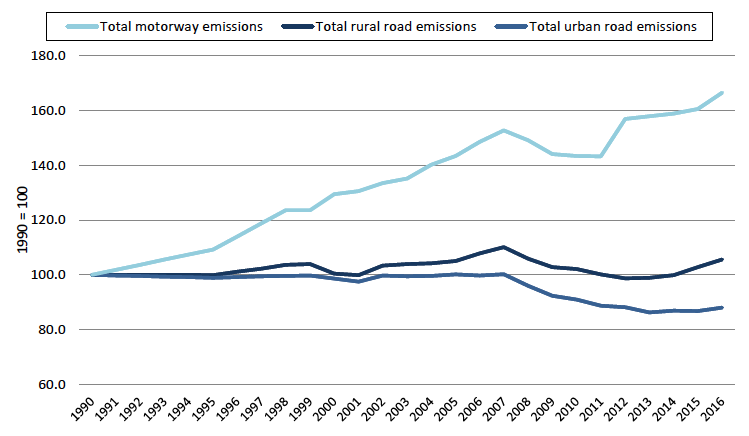
At 4.9 Mt CO2e in 2016, rural road emissions were 2.8% above the previous year, and 5.6% above 1990. Rural emissions accounted for 50.2% of road emissions.
2.5.2 Urban
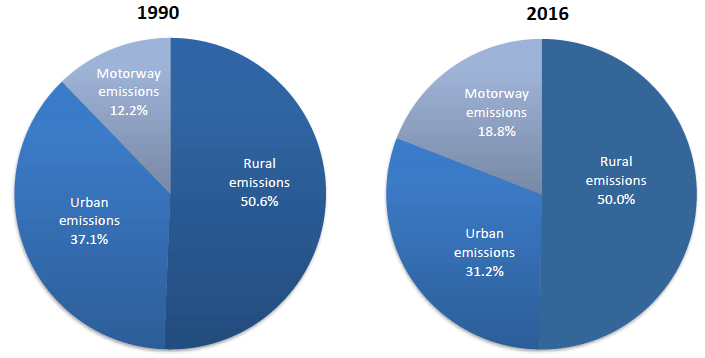
At 3.0 Mt CO2e in 2016, urban road emissions are 1.4% above the previous year, but -12.0% below 1990. Urban emissions accounted for 30.7% of road emissions in 2016, down from 37.1% in 1990.
According to Scottish Transport statistics, over the past ten years there has been an increase in traffic on rural roads while traffic on urban roads has remained steady.
2.5.3 Motorways
At 1.9 Mt CO2e in 2016, motorways emissions are at their highest level on record, 66.4% higher than 1990. Motorways contribute the smallest proportion of road emissions, at 19.1%, up from 12.2% in 1990.
The proportion of total vehicle miles driven on motorways has increased over time which has resulted from motorways increasing in length.
Figure 14 shows an index of emissions from different types of road since 1990.
Figure 14: Emissions by road type (1990=100)[16]
Source: National Atmospheric Emissions Inventory
Figure 15: Share of road emissions by road type
Source: National Atmospheric Emissions Inventory