Frequency of travel
Frequency of travel
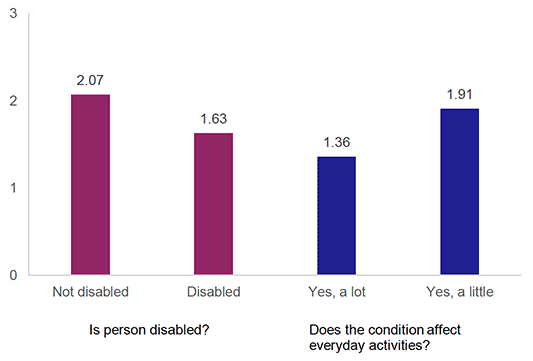
The average (mean) number of journeys taken per day by disabled people (1.63) is less than that for people who are not disabled (2.07). Those whose condition reduces their ability to carry out everyday activities a lot have an even lower average number of journeys (1.36). [Figure 12]
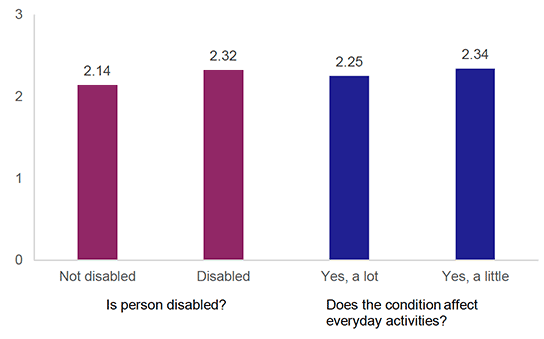
When only those working full-time are considered, disabled people take a higher average number of journeys (2.32 compared to 2.14 for those not disabled), even if their condition affects everyday activities a lot. [Figure 13]