Public transport
Public transport
Bus use
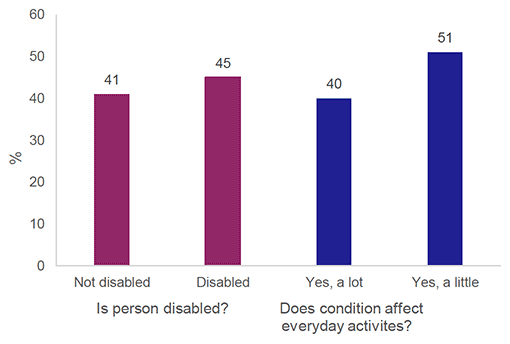
There was not a great difference in frequency of bus use between those who are disabled and those who are not, with 45% of disabled people having used the bus in the past month compared to 41% of those not disabled. 10% of both groups used the bus every day or almost every day. [Figure 24]
Of disabled people, those whose condition reduced their ability to carry out everyday tasks a little were the most frequent bus users, with 51% using the bus at least once a month, and 12% most days. People whose day-to-day activities were restricted a lot used the bus least, with 40% using it monthly or more, and 8% most days. [Figure 24]
Views about bus services
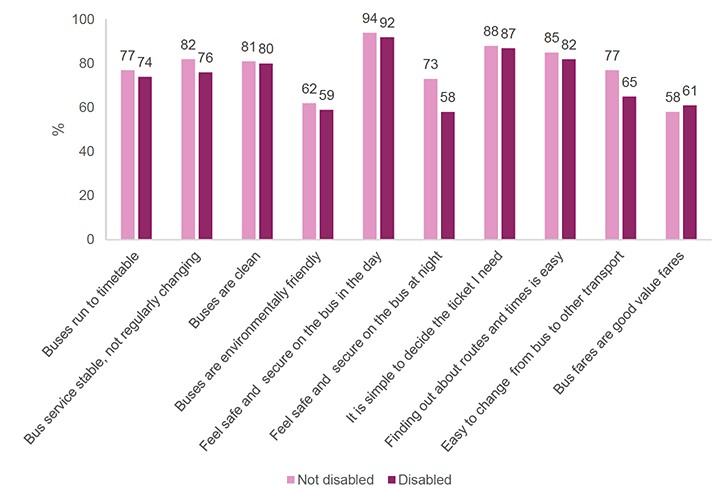
When people who had used the bus in the previous month were asked views on bus services, disabled people were generally slightly less content than people who were not disabled, although differences were small for most areas. The area where the difference was highest was 'Feel safe and secure on the bus at night', where 58% of disabled people agreed compared to 73% of non-disabled people. The second greatest difference was for 'Easy to change from bus to other transport', where the figures were 65% an 77%. [Figure 25]
Reasons for not using bus more
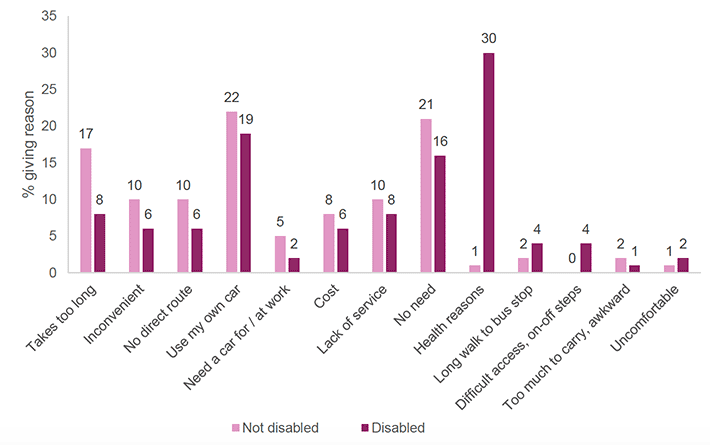
Disabled people were far more likely to say 'health reasons' discouraged them from using the bus than non-disabled people were (30% compared to 1%). Disabled people were less likely to say 'Takes too long' (8% compared to 17% of those not disabled). 'Difficult access/on-off steps' was given by 4% of disabled people, and 0% of those not disabled. (The percentage of buses that are disability accessible or low floor has risen from 94% in 2015 to 100% in 2020 (Source: Scottish Transport Statistics), so it is possible that this reason would be given less now.) [Figure 26]
Train use
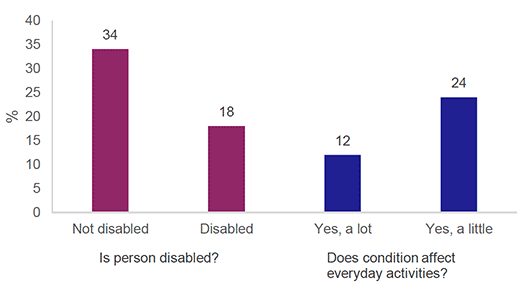
18% of disabled people used the train in the past month, compared to 34% of those not disabled. For use at least once a week, the figures are 5% an 11% respectively. [Figure 27]
Those whose disability affected everyday activities a lot used the train less frequently than those whose activities were only affected a little, with the number using the train in the past month 12% and 24% respectively. [Figure 27]
Views about rail services
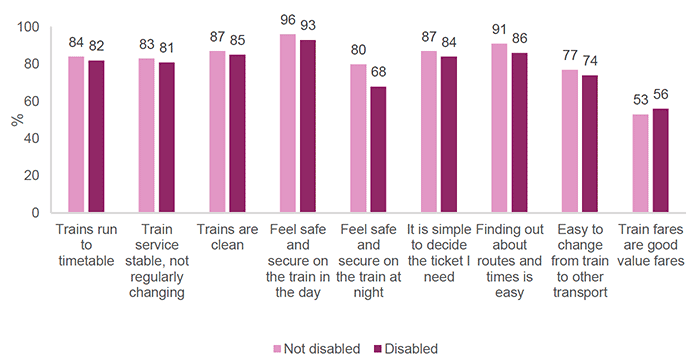
When people who had used the train in the previous month were asked views on rail services, disabled people were generally slightly less content than people who were not disabled, although differences were small for most areas. The area where the difference was highest was 'Feel safe and secure on the train at night', where 68% of disabled people agreed compared to 80% of non-disabled people. [Figure 28]
Reasons for not using train more
Reasons for not using the train more were not greatly different between disabled and non-disabled people, although 'cost' was named by more disabled people than non-disabled people (16% compared to 12%). 'Health reasons' was given by 3% of disabled people compared to 0% of non-disabled people.
Satisfaction with public transport
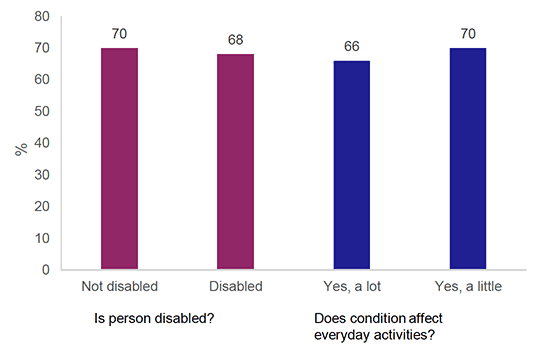
68% of disabled adults were very or fairly satisfied with public transport, compared to 70% of those who were not disabled. [Figure 29]
Of disabled people, those whose activities were reduced a lot were least satisfied (66% very or fairly satisfied), compared to 70% for people whose ability to carry out activities was reduce a little. [Figure 29]
