2 What was the scale of the reduction in fares?
2 What was the scale of the reduction in fares?
Overview
In fully understanding the impact of the RET fares policy, it is important to clearly establish the actual reduction in fares on a route-by-route basis.
Whilst RET in most cases led to a significant reduction in standard single and return fares, many passengers (and in particular island residents) previously had access to a range of multi-journey and concessionary tickets, some of which were discontinued when RET was introduced. This meant that they did not pay the standard fare per journey and thus the reduction in average fare paid was therefore less than might have been anticipated.
This chapter first explores the actual reduction in fares across all routes on the network before considering the awareness of fares reductions in relation to the ‘2015 RET’ routes only.
By how much were fares actually reduced to the average user?
The following sections set out the answer to this question looking at each route within each geographic region.
Firth of Clyde
The routes
The Firth of Clyde region consists of seven routes.
- Ardrossan – Brodick
- Ardrossan – Campbeltown
- Colintraive – Rhubodach
- Largs – Cumbrae Slip
- Claonaig – Lochranza
- Tarbert Loch Fyne (LF) – Portavadie
- Wemyss Bay Rothesay
RET was rolled-out to the Arran and Campbeltown routes in 2014, with the remainder of the Firth of Clyde network progressing RET in 2015. The table below sets out each of the routes within the Firth of Clyde network and the year in which RET was introduced, in addition to the years included in the analysis to identify the impact of RET on this section of the wider CHFS network.
Note: Ardrossan - Campbeltown is excluded from the analysis due to the lack of a complete baseline.
| Route | RET Year | RET Year-1 | RET Year+1 |
|---|---|---|---|
| Ardrossan - Brodick | 2014 | 2013 | 2015 |
| Colintraive - Rhubodach | 2015 | 2014 | 2016 |
| Largs - Cumbrae Slip | 2015 | 2014 | 2016 |
| Claonaig - Lochranza | 2014 | 2013 | 2015 |
| Tarbert Loch Fyne (LF) - Portavadie | 2015 | 2014 | 2016 |
| Wemyss Bay - Rothesay | 2015 | 2014 | 2016 |
Passengers - key points
The table below shows how RET passenger fares compare to what fares would have been in the counterfactual scenario:
| Passengers | RET Year+1(CF) | RET Year+1(CF), % |
|---|---|---|
| Ardrossan - Brodick | -£1.61 | -33% |
| Colintraive - Rhubodach | -£0.36 | -31% |
| Largs - Cumbrae Slip | -£0.56 | -31% |
| Claonaig - Lochranza | -£1.64 | -40% |
| Tarbert (LF) - Portavadie | -£1.21 | -35% |
| Wemyss Bay - Rothesay | -£0.95 | -29% |
- The average fares reduction on the shortest routes between Colintraive - Rhubodach and Largs - Cumbrae is the smallest in absolute terms - this is a consequence of the ‘fixed’ (i.e. non-distance based) element of the RET fare.
- The reduction in average fare on routes to Bute and Cumbrae is less because residents had access to a greater range of multi-journey products and in many cases were paying well under the published fares. Note that some of these multi-journey ticket products have been maintained post-RET.
- In absolute and proportional terms, the reduction in average fare was greatest on the Arran routes.
Cars – key points
The table below shows how RET car fares compare to what fares would have been in the counterfactual scenario:
| Cars | RET Year+1(CF) | RET Year+1(CF), % |
|---|---|---|
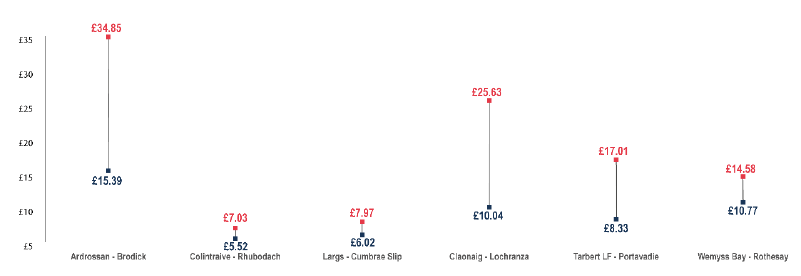
| Ardrossan - Brodick | -£19.46 | -56% |
| Colintraive - Rhubodach | -£1.51 | -22% |
| Largs - Cumbrae Slip | -£1.94 | -24% |
| Claonaig - Lochranza | -£15.58 | -61% |
| Tarbert (LF) - Portavadie | -£8.67 | -51% |
| Wemyss Bay - Rothesay | -£3.81 | -26% |
- As with passenger fares, the shorter routes witnessed less of a reduction in fares in both absolute and proportional terms due to the non-distance related component of the RET fare.
- The absolute reduction in average vehicle fares was greatest on the two Arran routes.
- The proportional reduction in average vehicle fares was greater than the equivalent for passenger fares – this implies that proportionally fewer pre-RET car journeys were made using multi-journey products. This is particularly true on the Arran routes, where car fares may previously have been considered prohibitive.
The chart below illustrates the changes in the average fare paid by passengers (top) and for cars (bottom) on each route within the Firth of Clyde network, comparing the actual RET fare in the year after it was introduced with the counterfactual for that year. The distance between the two fares on the bar highlights the impact of RET on the route, i.e. the bigger the gap between the two points, the greater the reduction in average fare.
Figure 2.1: Firth of Clyde – Fares reductions compared to RET year+1 counterfactual fares for passengers
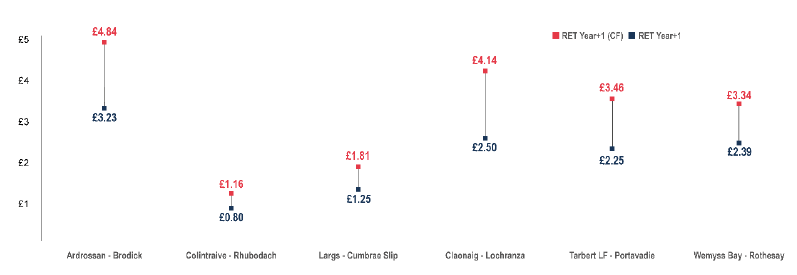
Figure 2.2: Firth of Clyde – Fares reductions compared to RET year+1 counterfactual fares for cars
Southern Hebrides
The routes
The Southern Hebrides region consists of three routes:
- Kennacraig – Islay
- Oban – Colonsay
- Tayinloan - Gigha
RET was rolled-out to all routes in 2012. The table below sets out each of the routes within the South Hebrides network and the year in which RET was introduced, in addition to the years included in the analysis to identify the impact of RET on this section of the wider CHFS network.
Note: Kennacraig - Islay - Colonsay is excluded from the analysis due to the lack of a complete baseline (i.e. there is no pre-RET dataset for this route against which to compare).
| Route | RET Year | RET Year-1 | RET Year+1 |
|---|---|---|---|
| Tayinloan – Gigha | 2012 | 2011 | 2013 |
| Kennacraig – Islay | 2012 | 2011 | 2013 |
| Oban - Colonsay | 2012 | 2011 | 2013 |
Passengers – key points
The table below shows how RET passenger fares compare to what fares would have been in the counterfactual scenario:
| Passengers | RET Year+1(CF) | RET Year+1(CF), % |
|---|---|---|
| Tayinloan – Gigha | -£0.58 | -24% |
| Kennacraig – Islay | -£2.00 | -26% |
| Oban - Colonsay | -£6.39 | -47% |
- There was a significant proportional reduction in passenger fares across all routes, with fares on the Oban – Colonsay route reducing by 47%.
- Whilst passenger fares reduced by 24% on the Taylinloan – Gigha route, the absolute reduction on a single passenger fare was only 58p.
Cars – key points
The table below shows how RET car fares compare to what fares would have been in the counterfactual scenario:
| Cars | RET Year+1(CF) | RET Year+1(CF), % |
|---|---|---|
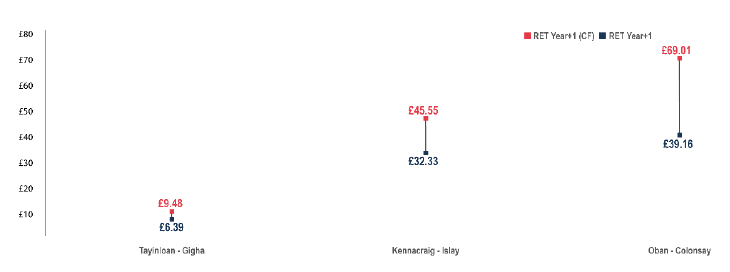
| Tayinloan – Gigha | -£3.09 | -33% |
| Kennacraig – Islay | -£13.33 | -29% |
| Oban - Colonsay | -£29.85 | -43% |
- There was also a significant reduction in car fares across all routes in the Southern Hebrides, with the scale of the reduction ranging from 29% to 43%.
- The absolute scale of the fares reduction was also significant – a single car fare between Oban – Colonsay reduces by some £30, whilst the Kennacraig – Islay fare reduced by £13.
The chart below illustrates the changes in the average fare paid by passengers (top) and for cars (bottom) on each route within the Southern Hebrides network, comparing the actual RET fare in the year after it was introduced with the counterfactual for that year. The distance between the two fares on the bar highlights the impact of RET on the route, i.e. the bigger the gap between the two points, the greater the reduction in average fare.
Figure 2.3: Southern Hebrides – fares reductions compared to RET year+1 counterfactual fares for passengers
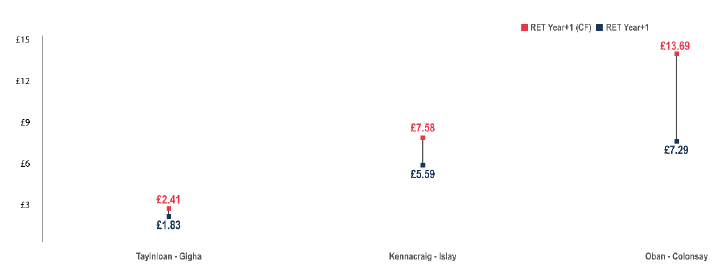
Figure 2.4: Southern Hebrides – fares reductions compared to RET year+1 counterfactual fares for cars
Inner Hebrides
The routes
The Inner Hebrides region consists of six routes.
- Fionnphort – Iona
- Fishnish – Lochaline
- Oban – Coll / Tiree
- Oban – Craignure
- Oban – Lismore
- Tobermory – Kilchoan
RET was rolled-out to five of the routes in 2015, with Oban - Coll / Tiree being one of the first introduced in 2008. The table below sets out each of the routes within the Inner Hebrides network and the year in which RET was introduced, in addition to the years included in the analysis to identify the impact of RET on this section of the wider CHFS network.
| Route | RET Year | RET Year-1 | RET Year+1 |
|---|---|---|---|
| Tobermory - Kilchoan | 2015 | 2014 | 2016 |
| Fionnphort - Iona | 2015 | 2014 | 2016 |
| Oban - Coll - Tiree | 2008 | 2007 | 2009 |
| Oban - Lismore | 2015 | 2014 | 2016 |
| Oban - Craignure | 2015 | 2014 | 2016 |
| Fishnish - Lochaline | 2015 | 2014 | 2016 |
Passengers – key points
The table below shows how RET passenger fares compare to what fares would have been in the counterfactual scenario:
| Passengers | RET Year+1(CF) | RET Year+1(CF), % |
|---|---|---|
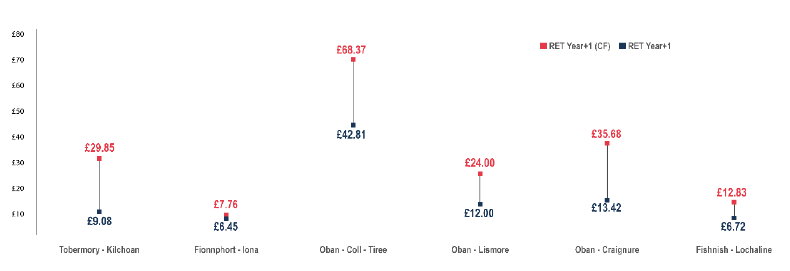
| Tobermory - Kilchoan | -£1.87 | -45% |
| Fionnphort – Iona | -£0.95 | -39% |
| Oban - Coll – Tiree | -£3.79 | -33% |
| Oban – Lismore | -£0.44 | -17% |
| Oban – Craignure | -£1.64 | -34% |
| Fishnish - Lochaline | -£0.71 | -27% |
- There was a significant reduction in passenger fares across all Inner Hebrides routes.
- The largest proportional reduction in fares was on the Tobermory – Kilchoan route – this is significant as this route is used by school children travelling from Ardnamurchan to Tobermory.
- The 34% reduction in passenger fares on the Oban – Craignure route is also significant given the comparatively high volume of foot passengers on that route.
Cars – key points
The table below shows how RET car fares compare to what fares would have been in the counterfactual scenario:
| Cars | RET Year+1(CF) | RET Year+1(CF), % |
|---|---|---|
| Tobermory – Kilchoan | -£1.87 | -45% |
| Fionnphort – Iona | -£0.95 | -39% |
| Oban – Coll – Tiree | -£3.79 | -33% |
| Oban – Lismore | -£0.44 | -17% |
| Oban – Craignure | -£1.64 | -34% |
| Fishnish - Lochaline | -£6.11 | -48% |
- The reduction in car fares on the Inner Hebrides routes was also significant, with all routes experiencing marked reductions in fares
- Of particular significance is the 62% reduction in fares on the Oban – Craignure route. Vehicle fares on the main route to Mull had historically been a deterrent to travel, but a reduction of this scale makes it significantly easier and more attractive to take a car on the ferry
- Whilst car fares only came down by 17% on the Fionnphort – Iona route, very few cars are actually carried on this route due to the requirement to have a permit to take a car to or from the island
The charts below illustrate the changes in the average fare paid by passengers (top) and for cars (bottom) on each route within the Inner Hebrides network, comparing the actual RET fare in the year after it was introduced with the counterfactual for that year. The distance between the two fares on the bar highlights the impact of RET on the route, i.e. the bigger the gap between the two points, the greater the reduction in average fare.
Figure 2.5: Inner Hebrides – fares reductions compared to RET year+1 counterfactual fares for passengers

Figure 2.6: Inner Hebrides – fares reductions compared to RET year+1 counterfactual fares for cars
Skye, Raasay & Small Isles
The routes
The Skye, Raasay and Small Isles region consists of three routes:
- Armadale – Mallaig
- Mallaig – Small Isles
- Sconser - Raasay
RET was rolled- out to all routes in 2015. The table below sets out each of the routes within the network and the year in which RET was introduced, in addition to the years included in the analysis to identify the impact of RET on this section of the wider CHFS network.
| Route | RET Year | RET Year-1 | RET Year+1 |
|---|---|---|---|
| Armadale - Mallaig | 2015 | 2014 | 2016 |
| Sconser - Raasay | 2015 | 2014 | 2016 |
| Mallaig - Small Isles | 2015 | 2014 | 2016 |
Passenger – key points
The table below shows how RET passenger fares compare to what fares would have been in the counterfactual scenario:
| Passengers | RET Year+1(CF) | RET Year+1(CF), % |
|---|---|---|
| Armadale - Mallaig | -£1.66 | -39% |
| Sconser - Raasay | -£0.83 | -35% |
| Mallaig - Small Isles | -£5.09 | -58% |
There were significant reductions in passenger fares across all three routes.
The reduction of 58% on the Mallaig–Small Isles route is important – as a there is a permit system for taking vehicles onto the islands, the route is dominated by passenger traffic and thus a reduction of this scale is significant.
It should be noted that the fares reduction shown for this route is an amalgam of all potential sailing legs, therefore the distribution of travel across legs impacts on average fare.
Cars – key points
The table below shows how RET car fares compare to what fares would have been in the counterfactual scenario:
| Cars | RET Year+1(CF) | RET Year+1(CF), % |
|---|---|---|
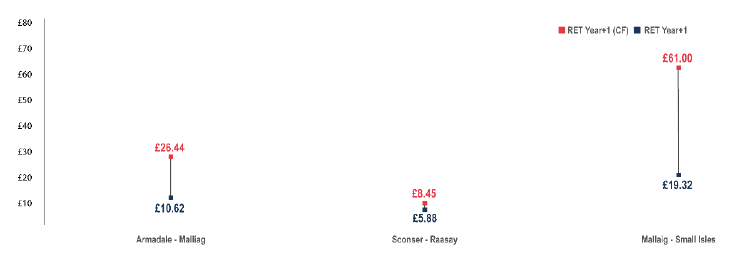
| Armadale - Mallaig | -£15.82 | -60% |
| Sconser - Raasay | -£2.57 | -30% |
| Mallaig - Small Isles | -£41.68 | -68% |
- There was also a significant reduction in car fares on each of the routes.
- From a carryings perspective, the 60% reduction in fares on the Mallaig – Armadale route is highly significant, as it is a very popular tourist route, particularly for Skye round-trips and on accommodation changeover days.
- Whilst there are few cars carried on the Mallaig – Small Isles route, the scale of the fares reduction – circa 68% - is significant and may encourage residents to take their vehicle more often. It should be noted that the fares reduction shown for this route is an amalgam of all potential sailing legs.
- The chart below illustrates the changes in the average fare paid by passengers (top) and for cars (bottom) on each route within the Skye, Raasay & Small Isles network, comparing the actual RET fare in the year after it was introduced with the counterfactual for that year. The distance between the two fares on the bar highlights the impact of RET on the route, i.e. the bigger the gap between the two points, the greater the reduction in average fare.
Figure 2.7: Skye, Raasay and Small Isles – fares reductions compared to RET year+1 counterfactual fares for passengers
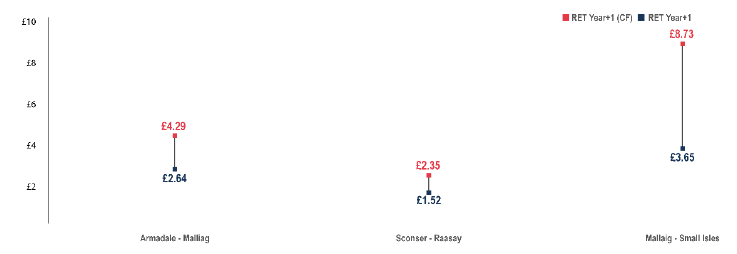
Figure 2.8: Skye, Raasay and Small Isles – fares reductions compared to RET year+1 counterfactual fares for cars
Outer Hebrides
The routes
The Outer Hebrides region consists of seven routes. When RET was introduced as a pilot in 2008, the route to Barra and South Uist was a triangular route connecting Oban with Castlebay and Lochboisdale. The fares reductions and trends are reported for this route as it experienced the ‘RET effect’.
- The carryings and utilisation date are shown for Oban – Castlebay / Lochboisdale from 2007-2015.
- Mallaig – Lochboisdale carryings are shown from 2013 and Castlebay – Oban from 2016. It should be noted that these routes were introduced well after RET and thus, any changes in carryings, utilisation etc are related to the background trend and / or supply-side changes such as the introduction of additional sailings. The one exception to this is where the introduction of RET on the Sound of Barra route has affected demand on the routes from Barra and South Uist to the mainland.
- The above caveats apply to all subsequent Outer Hebrides analysis.
| Route | RET Year | RET Year-1 | RET Year+1 |
|---|---|---|---|
| Ardmhor - Eriskay | 2015 | 2014 | 2016 |
| Oban - Castlebay - Lochboisdale | 2008 | 2007 | 2009 |
| Uig - Tarbert | 2008 | 2007 | 2009 |
| Uig - Lochmaddy | 2008 | 2007 | 2009 |
| Ullapool - Stornoway | 2008 | 2007 | 2009 |
| Berneray - Leverburgh | 2015 | 2014 | 2016 |
It should be noted that when RET was introduced as a pilot in October 2008, it was extended to commercial vehicles. When the fares policy was made permanent in 2012, RET for Commercial Vehicles (CVs) was withdrawn and transitional arrangements put in place to progress the fares back to their pre-RET level. The commencement of the Ferry Freight Fares Review meant that not all routes progressed back to their pre-RET level. It should also be noted that the majority of volume and commodity related discounts for CVs were withdrawn when RET was introduced and not reinstated when it was withdrawn for CVs.
Passengers - key points
The table below shows how RET passenger fares compare to what fares would have been in the counterfactual scenario:
| Passengers | RET Year+1(CF) | RET Year+1(CF), % |
|---|---|---|
| Ardmhor - Eriskay | -£3.24 | -56% |
| Oban - Castlebay - Lochboisdale | -£7.90 | -44% |
| Uig - Tarbert | -£3.57 | -45% |
| Uig - Lochmaddy | -£3.57 | -45% |
| Ullapool - Stornoway | -£5.36 | -46% |
| Berneray - Leverburgh | -£2.82 | -49% |
- Passenger fares across the Outer Hebrides reduced by a significant proportion when RET was introduced as a pilot in 2008.
- The largest reductions in fares though was on the Sound routes, as the fare structure on the previous inter-island leg of the triangular routes (i.e. Tarbert - Lochmaddy and Lochboisdale - Castlebay) was retained when the Sound routes were introduced. Fares were thus well in excess of the distance-based equivalent and thus reduced by 56% on the Sound of Barra and 49% on the Sound of Harris.
Cars – key points
The table below shows how RET car fares compare to what fares would have been in the counterfactual scenario:
| Cars | RET Year+1(CF) | RET Year+1(CF), % |
|---|---|---|
| Ardmhor - Eriskay | -£8.33 | -43% |
| Oban - Castlebay - Lochboisdale | -£22.21 | -30% |
| Uig - Tarbert | -£1972 | -46% |
| Uig - Lochmaddy | -£19.72 | -46% |
| Ullapool - Stornoway | -£24.22 | -40% |
| Berneray - Leverburgh | -£14.03 | -50% |
- The reduction in car fares across the Outer Hebrides 2008 routes was also significant, ranging from 30% on Oban – Castlebay / Lochboisdale to 46% on the Uig Triangle. More importantly however, the reduction in the absolute fares was substantial, thus significantly increasing opportunities to take a car onto the ferry.
- As with passenger fares, the reductions were greatest on the two Sound routes, as RET dispensed with legacy fares from the Triangular routes.
The charts below illustrate the changes in the average fare paid by passengers (top) and for cars (bottom) on each route within the Outer Hebrides network, comparing the actual RET fare in the year after it was introduced with the counterfactual for that year. The distance between the two fares on the bar highlights the impact of RET on the route, i.e. the bigger the gap between the two points, the greater the reduction in average fare.
Figure 2.9: Outer Hebrides – fares reductions compared to RET year+1 counterfactual fares for passengers

Figure 2.10: Outer Hebrides – fares reductions compared to RET year+1 counterfactual fares for cars

How aware are passengers of the RET policy and actual fares changes (2015 routes)?
In order to place the reduction in fares and subsequent increase in travel volumes in context, respondents to the onboard survey were asked if they were aware that RET had been introduced on that route.
Figure 2.11: Awareness of RET (Source: Onboard survey, n=1,358)
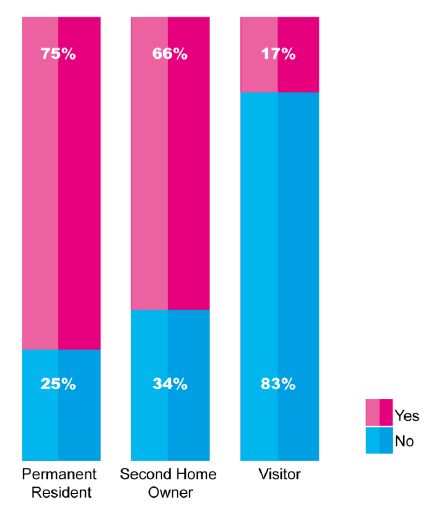
- there was a high awareness of RET fares amongst island residents, although somewhat surprisingly this was not universal.
- awareness of RET was however much lower amongst visitors, with only 17% being aware of the policy
- amongst those who were aware of RET, only 24% of respondents (27% of residents and 20% of visitors) could estimate their ‘old’ pre-RET (i.e. summer 2015) fare, which suggests that people have forgotten the scale of the fares reduction relatively quickly, with RET fares becoming the new norm
- one of the reasons why awareness may not be universal is the continuation of specific concessions (e.g. the SPT concession scheme), where card holders did not experience an RET-related discount
Key point: Whilst there was a generally high (although not universal) awareness of RET fares amongst island residents on the ‘2015 routes’, fewer than 20% of visitors surveyed were aware of the policy. Of those who were aware of RET, only around a quarter could estimate their pre-RET fare, suggesting that the scale of the fares reduction has been forgotten relatively quickly.