3 How did this change travel behaviour?
3 How did this change travel behaviour?
Overview
Whilst the decrease in fares brought about by RET was, in many cases and for various reasons, less than the published reduction, the cost of travel nonetheless reduced significantly for most users of the CHFS network. This section explores how travel behaviour responded to RET – it first considers the network-wide volumetric change before exploring how this fed through to the number and types of trips made in the ‘2015 RET’ routes.
How did network-wide demand respond to RET
What was the total change in network carryings?
The graphs below illustrate the estimated passenger and car counterfactual (i.e. what would have been expected if RET did not happen) against the actual recorded carryings.
Figure 3.1: Change in network passenger carryings
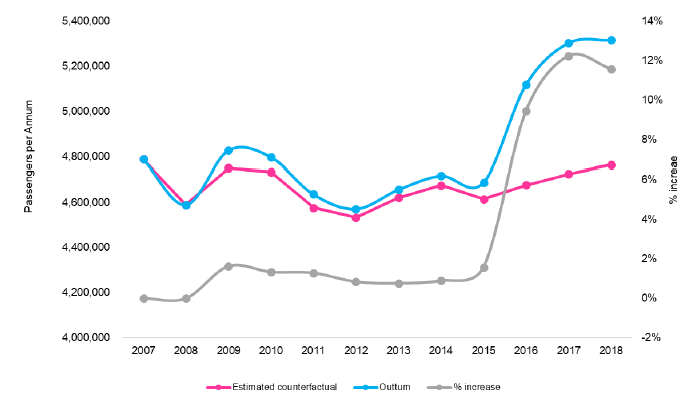
Figure 3.2: Change in network car carryings
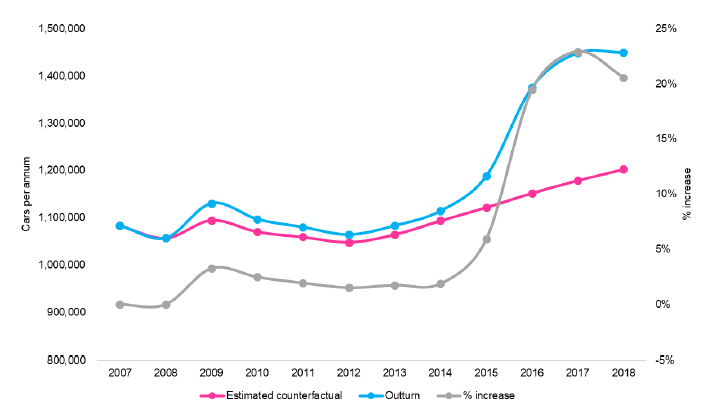
In 2018 the passenger carryings chart highlights that the number of passengers travelling on the network was 11.6% higher than it would otherwise have been. For cars this number is even higher at 20.6%. It should be noted that a proportion of this growth will include vehicles between 5m and 6m which would have previously been classed as commercial vehicles.
How responsive was demand to RET and did this vary by distance?
Price elasticity of demand (PED) measures the response of demand to changes in price. Using the published carryings data, a PED was calculated for passengers and cars by dividing the increase in carryings by the change in yield (yield is used as many passengers did not pay the headline published fare pre-RET, so did not benefit from the maximum fares reduction available).
The table below shows, for each route, the:
- distance
- % reduction in passenger fares
- % change in passenger numbers
- passenger elasticity
- % reduction in car fares
- % change in car numbers
- car elasticity
| Route | Distance | % Reduction Passenger Fares | % Change Passenger Numbers | Passenger Elasticity | % Reduction Car Fares | % Change Car Numbers | Car Elasticity |
|---|---|---|---|---|---|---|---|
| Ardrossan - Brodick | 11.8 | -33% | 6% | -0.17 | -49% | 45% | -0.59 |
| Colintraive - Rhubodach | 0.6 | -31% | 12% | -0.39 | -22% | 14% | -0.66 |
| Largs - Cumbrae | 2.4 | -31% | 7% | -0.22 | -24% | 15% | -0.62 |
| Claonaig - Lochranza | 5 | -40% | 26% | -0.65 | -61% | 39% | -0.63 |
| Tarbert LF - Portavadie | 3.4 | -35% | 31% | -0.88 | -51% | 41% | -0.81 |
| Wemyss Bay - Rothesay | 6.8 | -29% | 8% | -0.26 | -26% | 18% | -0.69 |
| Tayinloan - Gigha | 2.5 | -24% | 2% | -0.10 | -33% | 11% | -0.32 |
| Kennacraig - Islay | 32.3 | -26% | -2% | 0.07 | -29% | 5% | -0.16 |
| Oban - Colonsay | 37 | -47% | 11% | -0.24 | -43% | 9% | -0.22 |
| Tobermory - Kilchoan | 3.7 | -45% | 26% | -0.57 | -70% | 68% | -0.98 |
| Fionnphort - Iona | 1.7 | -39% | 14% | -0.36 | -17% | 21% | -1.22 |
| Oban - Coll - Tiree | 59.7 | -33% | 8% | -0.23 | -37% | 14% | -0.39 |
| Oban - Lismore | 7.5 | -17% | 18% | -1.07 | -50% | 42% | -0.83 |
| Oban - Craignure | 9.3 | -34% | 16% | -0.46 | -62% | 38% | -0.62 |
| Fishnish - Lochaline | 1.9 | -27% | -5% | 0.18 | -48% | -7% | 0.14 |
| Armadale - Mallaig | 5 | -39% | -2% | 0.04 | -60% | 9% | -0.15 |
| Sconser - Raasay | 1.9 | -35% | 15% | -0.43 | -30% | 20% | -0.65 |
| Mallaig - Small Isles | 16.6 | -58% | 4% | -0.07 | -68% | 48% | -0.70 |
| Ardmhor - Eriskay | 5.9 | -56% | 17% | -0.29 | -43% | 25% | -0.58 |
| Oban - Castlebay - Lochboisdale | 89.5 | -44% | 25% | -0.56 | -30% | 34% | -1.10 |
| Uig - Tarbert | 29.2 | -45% | 13% | -0.28 | -46% | 18% | -0.39 |
| Uig - Lochmaddy | 29.2 | -45% | 13% | -0.28 | -46% | 18% | -0.39 |
| Ullapool - Stornoway | 52.2 | -46% | 19% | -0.43 | -40% | 31% | -0.79 |
| Berneray - Leverburgh | 9.5 | -49% | 13% | -0.27 | -50% | 20% | -0.41 |
From the table it can be seen that the price elasticity of demand did not vary significantly by distance.
How did demand respond at the route level?
This section of the report sets out the change in demand at the route level, again grouped by geographic region.
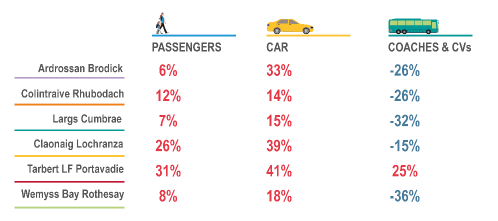
Firth of Clyde
The chart below highlights the changes in carryings for passengers and cars between RET Year+1 and RET Year+1 CF. The difference shown for commercial vehicles and coaches is between RET Year-1 and RET Year+1. This is due to two aspects, firstly RET does not apply to commercial vehicles over 6m and secondly, there was a redefinition of the length at which a vehicle is classed as commercial from 5m to 6m.
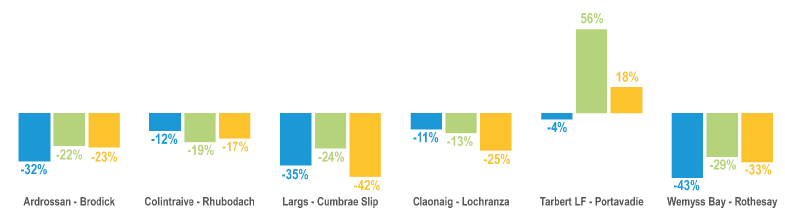
Figure 3.3: Firth of Clyde – change in carryings
Passengers – change in carryings
- Passenger numbers have grown across all routes.
- The most significant proportional increases have been on Tarbert LF - Portavadie (31%) and Claonaig - Lochranza (26%), which may reflect the role of lower fares in promoting circular leisure trips around the Firth of Clyde, and in particular the ‘Five Ferries Challenge’.
- Growth on the higher volume routes (Ardrossan - Brodick, Wemyss Bay - Rothesay and Largs - Cumbrae) has been more modest, and less than the CHFS network average. This may in part reflect the relatively low reduction in average fare paid.
Cars – change in carryings
- Double-digit proportional growth in car traffic has been reported on all Firth of Clyde routes.
- The growth in car traffic has significantly exceeded passenger growth on all routes, and in many cases by a significant margin. This reflects a trend towards previous journeys made as a foot passenger only now being made by taking a car.
- The most significant absolute growth has been on the Ardrossan - Brodick route.
CVs and coaches – change in carryings
- CV traffic has declined significantly on the high-volume routes in the Firth of Clyde. There is evidence from the haulier interviews of a significant growth in van-related traffic, moving goods which would previously have travelled in a standard HGV. Indeed, some hauliers have adapted their operational model to work on this basis.
- The Firth of Clyde routes are particularly susceptible to this change given the high frequency ferry service and their close proximity to Central Belt distribution networks.
- The growth in van traffic will account for part of the increase in car traffic, with vans less than 6m in length now being classed as cars.
- Growth on the Tarbert LF - Portavadie routes (the latter in particular) are likely to be driven by an increase in coach travel as CV fares have not changed and there is little commercial traffic moving on these routes.
Passengers – long-term trend in carryings
The figure below shows the long-term trend in passenger carryings on the Firth of Clyde routes:
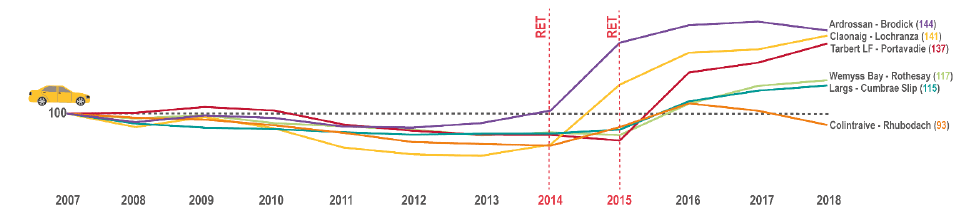
Figure 3.4: Firth of Clyde – change in passenger carryings 2007-18 (2007=100)
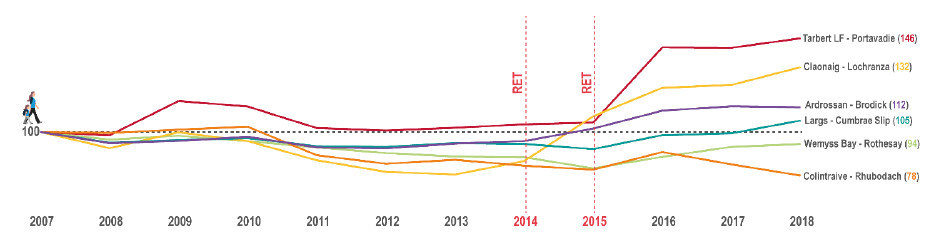
Note: RET was initially introduced on the Arran routes in 2014 before being introduced to the remaining Firth of Clyde routes in 2015.
- The introduction of RET has checked or reversed a long-term reduction in passengers across most of the Firth of Clyde routes. Both Bute routes are nonetheless below their 2007 level, with Largs - Cumbrae and Ardrossan - Brodick only marginally above this level.
- RET has generated a significant increase in passenger trips between Kintyre and Arran and Cowal.
Cars – long-term trend in carryings
The figure below shows the long-term trend in car carryings on the Firth of Clyde routes:
Figure 3.5: Firth of Clyde – change in car carryings 2007-18 (2007=100)
- Vehicle carryings on the Firth of Clyde routes were all below their 2007 level before RET was introduced, suggesting a long-term decline in this part of the CHFS network. The introduction of RET has reversed this trend and stimulated significant growth with all routes except Colintraive – Rhubodach now above their 2007 level.
- As has been common on high volume routes across the network, Ardrossan – Brodick, Wemyss Bay – Rothesay and Largs – Cumbrae experienced a significant step in demand when RET was introduced which largely levelled off thereafter.
- The Colintraive – Rhubodach route has witnessed a decline in carryings since RET was introduced. The reduction in fares on the Wemyss Bay – Rothesay route may have incentivised more people to take this route to the mainland.
- After a sustained period of gradual decline, RET has led to a significant step-change in carryings on the routes between Kintyre and Arran. This may in part be a tourism effect, but it may also be because it makes the ‘shortcut’ to the mainland via Dunoon and Brodick cheaper.
CVs and coaches – long-term trend in carryings
The figure below shows the long-term trend in CV and coach carryings on the Firth of Clyde routes:
Figure 3.6: Firth of Clyde – change in CV and coach carryings 2007-18 (2007=100)
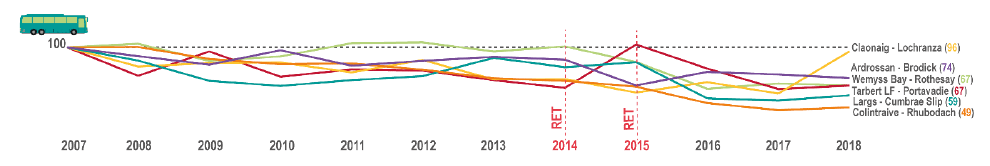
- In line with the more general Firth of Clyde trend, CV carryings have been in gradual decline on most routes since 2007.
- The introduction of RET on the high-volume routes has to some extent accelerated this decline as a result of the switch into vans less than 6 metres in length.
How did demand vary by timetable season?
* Peak Summer = July and August. Shoulder Summer = late March to end of June, September to Mid-October. Winter = Mid October to Late March
The figures below show how carryings changed by season when RET was introduced, comparing RET Year +1 and RET Year +1 (Counterfactual) passengers and cars. The difference shown for CVs and coaches is between RET Year -1 and RET Year +1 as they were not subject to RET:
Figure 3.7: Firth of Clyde – change in passenger carryings
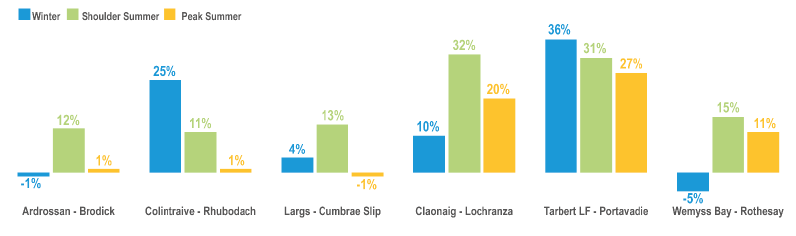
Figure 3.8: Firth of Clyde – change in car carryings by season
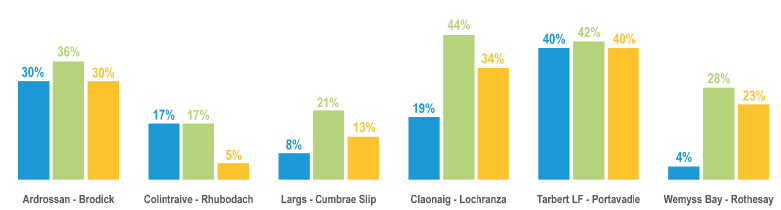
Figure 3.9: Firth of Clyde – change in CV and coach carryings by season
- Across almost all Firth of Clyde routes, passenger growth in the shoulder season has exceeded that in peak summer months – this aligns with the wider research findings that the ‘season’ is extending across many islands.
- A key finding is that, on almost all routes, the growth in car traffic has significantly exceeded the growth in passenger numbers. This highlights both the tendency for those who previously travelled as a foot passenger now taking a vehicle (the main effect) and the switch of some commercial traffic into vans less than 6m in length.
- As with passenger numbers, the growth in car carryings in the shoulder season has exceeded that in the peak season. This highlights both the growth in shoulder season but, on the Ardrossan – Brodick route, may also highlight vehicle deck capacity issues on peak sailings / sailing days.
- CV demand has declined across almost all routes and seasons, predominantly as a result of the 6m rule.
Southern Hebrides
The chart below the changes in carryings for passengers and cars between RET Year+1 and RET Year+1 CF. The difference shown for commercial vehicles and coaches is between RET Year-1 and RET Year+1. This is due to two aspects, firstly RET does not apply to commercial vehicles over 6m and secondly, there was a redefinition of the length at which a vehicle is classed as commercial from 5m to 6m.
Figure 3.10: Southern Hebrides – change in carryings
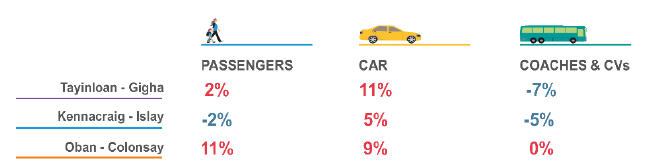
Passengers – change in carryings
- Despite the scale of the fares reductions, passenger growth across all three routes was relatively modest.
- Growth in passenger numbers was most significant on the Oban – Colonsay route. This may in part be as a result of this route experiencing the largest reduction in foot passenger fares but is more likely driven by Oban being the ultimate destination (compared to Kennacraig and Tayinloan) where a car is required for the onward journey.
Cars – change in carryings
- Across all three routes, the growth in car carryings has exceeded the growth in passenger carryings, which largely reflects previous journeys made as a foot passenger now being made by car. However, there will also be a degree of growth in van traffic at the expense of conventional commercial vehicles.
- Whilst passenger growth on Oban – Colonsay has been the highest across the three routes, car growth has been the lowest, reflecting the point made above that the final destination for many journeys will be Oban and thus taking a car is unnecessary.
- Car growth on the Islay (10%) and Gigha (12%) routes has been significant but is well below the network average of 20.6%.
CVs and coaches – change in carryings
- As is common across the network, CV numbers have declined on the Islay and Gigha routes, which will principally be a reflection of the 6m rule effect. Note that, whilst the proportions are similar, the absolute reduction on the Islay route is much larger.
- There has been no significant change on the Colonsay route, which is unsurprising given the low volumes of freight on that route, much of which is likely to be moved in vans in any case.
- Whilst there has been a significant variation in Coach and CV carryings on the Gigha and Colonsay routes, the variations in terms of absolute numbers is relatively small.
Passengers – long-term trend in carryings
The figure below shows the long-term trend in passenger carryings on the Southern Hebrides routes:
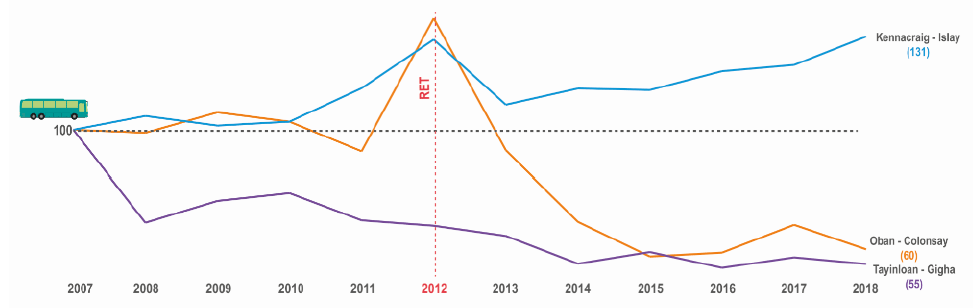
Figure 3.11: Southern Hebrides – change in passenger carryings 2007-18 (2007=100)
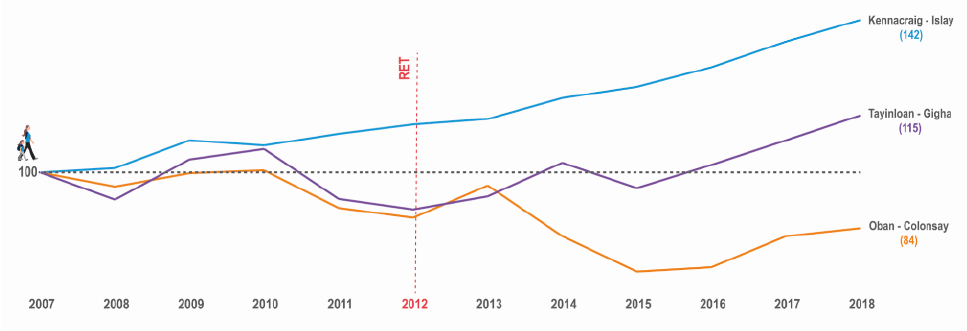
- Passenger carryings on the Oban – Colonsay route increased in the first year following the introduction of RET but declined between 2013-16. There has been modest growth in carryings since 2016, which are understood to be attributable to an improvement in the summer timetable, but annual carryings remain below their 2007 level.
- The Gigha route has grown steadily since the introduction of RET in 2012.
Cars – long-term trend in carryings
The figure below shows the long-term trend in Car carryings on the Southern Hebrides routes:
Figure 3.12: Southern Hebrides – change in car carryings 2007-18 (2007=100)
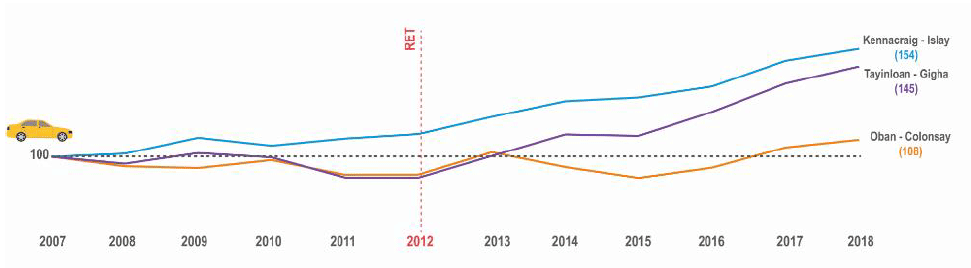
- There has been a steady growth in car carryings on the Islay and Gigha routes since the introduction of RET.
- The car trend for Colonsay broadly mirrors that for passengers, where there was an initial increase after the introduction of RET, a subsequent drop-off and then a gradual increase.
CVs and coaches – long-term trend in carryings
The figure below shows the long-term trend in CV and coach carryings on the Southern Hebrides routes:
Figure 3.13: Southern Hebrides – change in CV and coach carryings 2007-18 (2007=100)
- Following the initial reduction in CV carryings on the Islay route following the introduction of RET, there has been a gradual recovery in carryings.
- Whilst there has been a significant variation in Coach and CV carryings on the Gigha and Colonsay routes, the variations in terms of absolute numbers is relatively small.
How did demand vary by timetable season?
The figures below show how carryings changed by season when RET was introduced, comparing RET Year +1 and RET Year +1 (Counterfactual) passengers and cars. The difference shown for CVs and coaches is between RET Year -1 and RET Year +1 as they were not subject to RET:
Figure 3.14: Southern Hebrides – change in passenger carryings by season
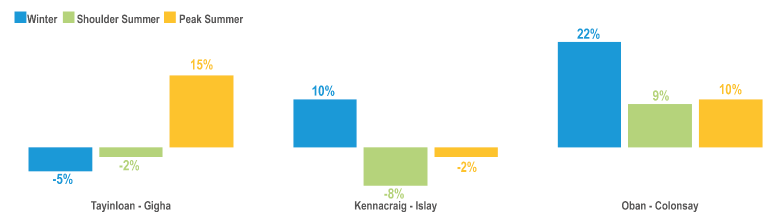
Figure 3.15: Southern Hebrides – change in car carryings by season
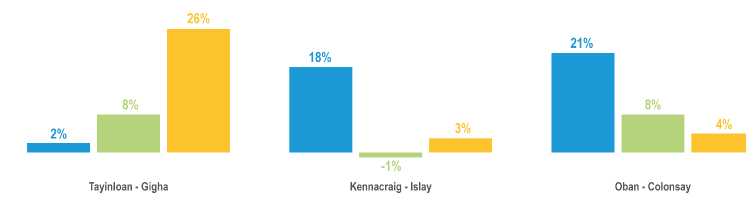
Figure 3.16: Southern Hebrides – change in CV and coach carryings by season
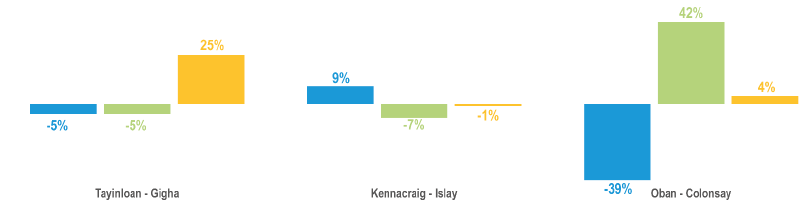
- The growth in demand on the Tayinloan – Gigha route has been heavily concentrated in the peak summer period, which implies that much of the growth is driven by increasing visitor demand. Of particular note is the 25% increase in Coaches and CVs, which given limited freight volumes to the island suggests an increase in coach trips – whilst the proportional increase is significant, the absolute growth is relatively small.
- Growth on the Kennacraig – Islay route has been almost wholly concentrated in the winter months, which is at odds with much of the rest of the network. Indeed, shoulder summer and peak summer carryings have almost declined across the board. This may highlight increasing summer capacity challenges on the Kennacraig – Islay route, with the greatest scope for growth being in the winter months.
- Passenger and car carryings on the Oban – Colonsay route have grown across all seasons, although again this has been most heavily concentrated in the winter months. This suggests that the majority of RET-induced journeys have been undertaken by residents.
Inner Hebrides
The chart below highlights the changes in carryings for passengers and cars between RET Year+1 and RET Year+1 CF. The difference shown for commercial vehicles and coaches is between RET Year-1 and RET Year+1. This is due to two aspects, firstly RET does not apply to commercial vehicles over 6m and secondly, there was a redefinition of the length at which a vehicle is classed as commercial from 5m to 6m.
Figure 3.17: Inner Hebrides – change in carryings
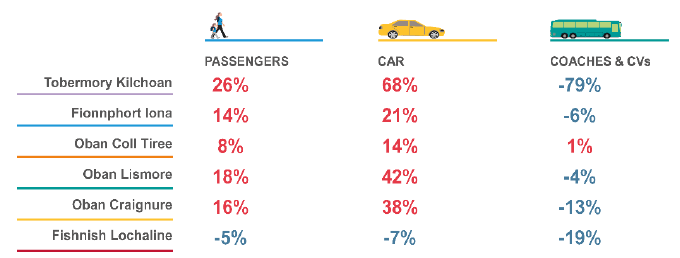
Passengers – change in carryings
- Overall, there has been a significant growth in passenger carryings across the Inner Hebrides routes.
- In proportional terms, the most significant growth was on the Tobermory – Kilchoan route, where reduced fares may have provided Ardnamurchan residents with increased opportunities to travel to Tobermory and beyond for personal business and leisure. Moreover, the lower fares to Mull and from Mull to the mainland may be promoting a different route from Ardnamurchan to its main service centres.
- In absolute terms, passenger growth was greatest on the Oban – Craignure route (16% in proportional terms), which exceeded the network average of 12%. Much of this growth is driven by those travelling on coach trips to Mull or day-trippers taking the ferry and using scheduled bus services on Mull.
- Passenger growth on the Oban – Lismore route was 18%. Interestingly, passenger numbers on the Port Appin – Lismore Point route also increased between 2015 and 2016, operated by Argyll & Bute Council, suggesting that overall volumes on the Lismore routes has grown.
Cars – change in carryings
- The growth in car carryings on the Oban – Craignure route has been significant, both in proportional and absolute terms. Mull has now become much more accessible for day-trip and short-break holidays, which is one source of this growth. However, it is important to note that the growth in car traffic has exceeded that of passenger traffic, suggesting that journeys which would previously have been made as a foot passenger are now being undertaken by car.
- As alluded to into relation passengers, the high growth in car carryings on the Tobermory – Kilchoan route may reflect both taking the car to Mull to access retail and other services and the use of Mull as a land-bridge to access Oban and the Central Belt.
- Car growth on Oban – Lismore has also been very strong and well in excess of passenger growth – this again suggests that journeys previously made as a foot passenger are now being made by car, possibly to facilitate e.g. large grocery shops in Oban.
- Car carryings on Fishnish – Lochaline have reduced by 7%, which highlights route-switching to Oban – Craignure, taking advantage of the much reduced fare on that route for accessing the mainland.
CVs and coaches – change in carryings
- Whilst there is a significant reduction in coaches and CVs on the Tobermory – Kilchoan route, the absolute change is actually very small.
- As has been common across the network, CV carryings have declined, largely due to the 6m rule. This is particularly notable on Mull, where CV carryings have witnessed double digit reductions on the Craignure and Fishnish routes.
Passengers – long-term trend in carryings
The figure below shows the long-term trend in passenger carryings on the Inner Hebrides routes:
Figure 3.18: Inner Hebrides – change in passenger carryings 2007-18 (2007=100)
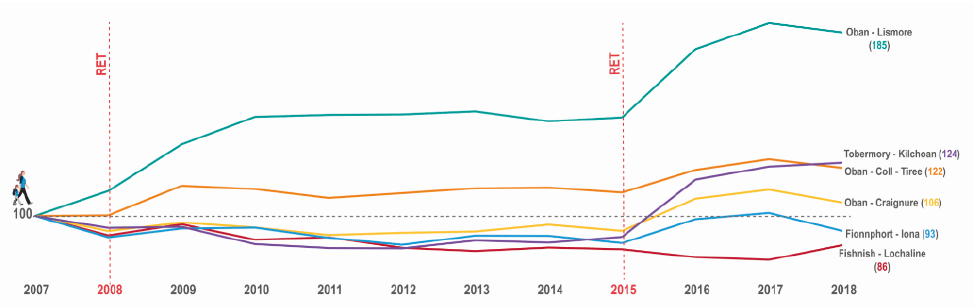
- RET has assisted in reducing a long-term reduction in passenger numbers across a number of routes, although a number of routes do remain below their 2007 level
- The growth on Oban – Lismore over the last decade has been significant, with passenger numbers now well above their 2007 level
- There has also been a step-change in passenger travel on the Tobermory – Kilchoan route
Cars – long-term trend in carryings
The figure below shows the long-term trend in car carryings on the Inner Hebrides routes:
Figure 3.19: Inner Hebrides – change in car carryings 2007-18 (2007=100)
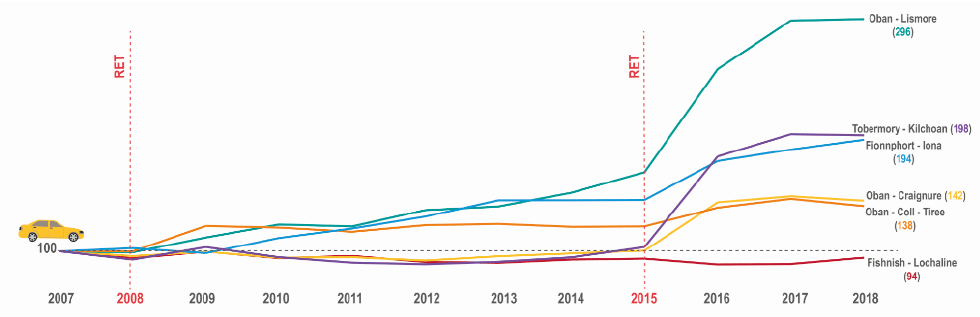
- RET has also prompted a significant growth in car carryings across the Inner Hebrides network, Lochaline – Fishnish aside for reasons previously explained.
- Proportional growth has been most significant on the Oban – Lismore route. This is a product of (i) from circa 2009-13, a potential ‘use it or lose it’ effect when it was recommended in a 2009 STAG that Lismore’s connection should be via a new Port Appin to Point vehicle ferry; (ii) from 2013 onwards, the introduction of the larger Loch Class vessel MV Loch Striven to replace the smaller Island Class vessel MV Eigg; and (iii) from October 2015, the introduction of RET.
- RET has also promoted significant vehicle carrying growth on the Oban – Craignure and Oban – Coll / Tiree routes, the two ‘Major Vessel’ routes in the Inner Hebrides network.
CVs and coaches – long term trend in carryings
The figure below shows the long-term trend in CV and coach carryings on the Inner Hebrides routes:
Figure 3.20: Inner Hebrides – change in CV and coach carryings 2007-18 (2007=100)
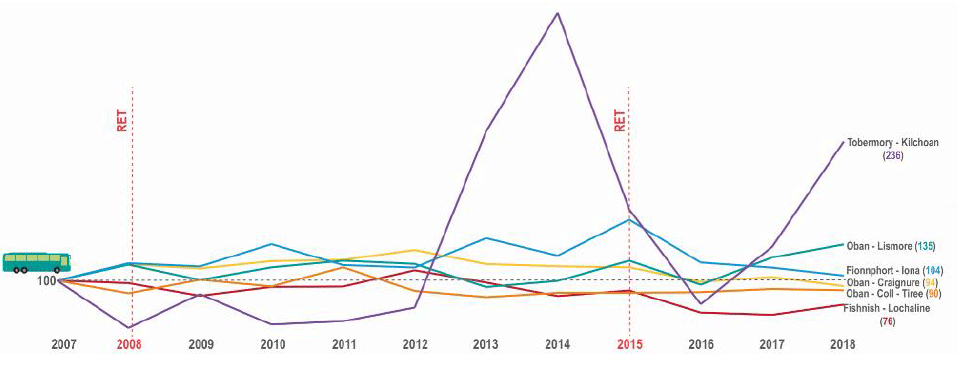
- CV carryings on Oban – Craignure and Oban – Coll / Tiree routes, the two ‘Major Vessel’ routes in the Inner Hebrides network, have declined since RET was introduced, reflecting the implementation of the 6m rule.
- CV carryings on other routes have demonstrated a degree of year-on-year volatility but by 2018 were still broadly similar to their 2007 level. The spike is a result of low volumes, meaning small changes can be big percentage changes.
How did demand vary by timetable season?
The figures below show how carryings changed by season when RET was introduced, comparing RET Year +1 and RET Year +1 (Counterfactual) passengers and cars. The difference shown for CVs and coaches is between RET Year -1 and RET Year +1 as they were not subject to RET:
Figure 3.21: Inner Hebrides – change in passenger carryings by season
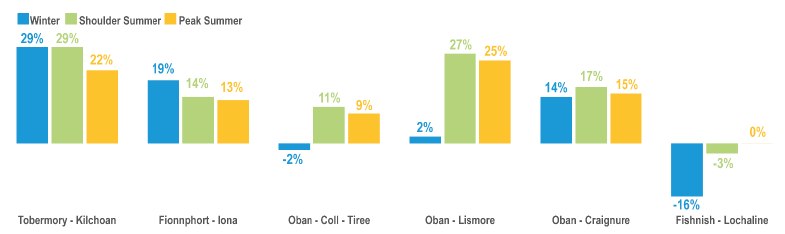
Figure 3.22: Inner Hebrides – change in car carryings by season
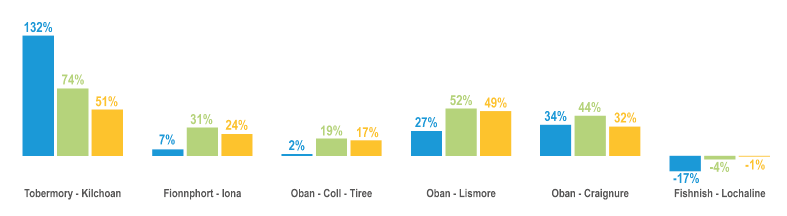
Figure 3.23: Inner Hebrides – change in CV and coach carryings by season
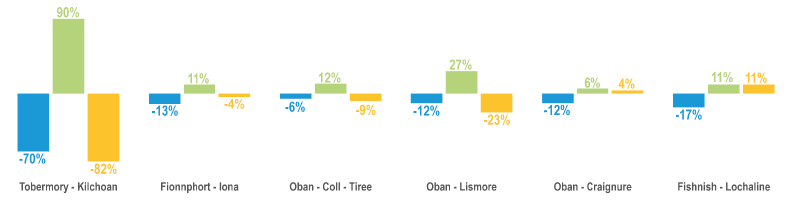
- There was growth across all seasons in passenger and car carryings on the Kilchoan – Tobermory route, but the proportional growth has, by some distance, been greatest in winter. This may reflect the use of Tobermory or Oban as main service centres during winter, reducing the need for long drives to e.g. Fort William on the limited peninsula road network during winter.
- Growth in passenger carryings on the Oban – Lismore route has been heavily concentrated in the shoulder and peak summer seasons, suggesting growth in visitor demand. There has been significantly greater car growth than passenger growth in winter, suggesting that journeys previously made as a foot passenger are now being made using a car.
- There has been passenger and car growth across all seasons on the Oban – Craignure route. Car growth has been most prevalent in the shoulder summer period, which may reflect a lengthening of the tourist season in Mull and capacity constraints on the most popular sailings in peak summer.
- The decline in all carrying types on the Lochaline – Fishnish route is greatest in winter. This suggests that visitor demand (and in particular visitors accessing Mull by one route and leaving by another) is to some extent offsetting the effect of residents switching to the Oban – Craignure route.
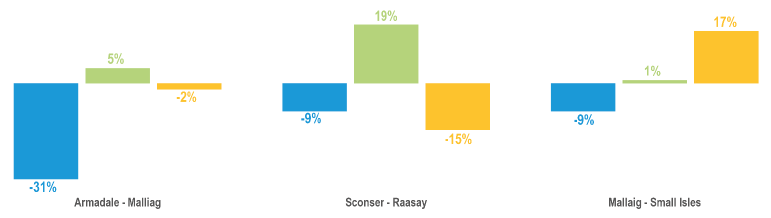
Skye, Raasay & Small Isles
The chart below highlights the changes in carryings for passengers and cars between RET Year+1 and RET Year+1 CF. The difference shown for commercial vehicles and coaches is between RET Year-1 and RET Year+1. This is due to two aspects, firstly RET does not apply to commercial vehicles over 6m and secondly, there was a redefinition of the length at which a vehicle is classed as commercial from 5m to 6m.
Figure 3.24: Skye, Raasay & Small Isles – change in carryings
Passengers – change in carryings
- The 4% increase in passenger numbers on the Mallaig – Small Isles route may reflect both residents travelling more often and a growth in visitor use of the ferry, and in particular the non-landing Small Isles cruises.
- Passenger numbers have grown significantly on the Sconser – Raasay route, which likely reflects increased visitor numbers to the island (which may in-part be driven by the opening of the Raasay Distillery in 2016, which is walkable from the ferry terminal).
Cars – change in carryings
- The Mallaig – Armadale route experienced car growth of 9% following the introduction of RET. However, this one- year comparison figure underestimates actual growth – the vessel deployment on the route was in a state of flux in 2016 and dampened demand, which grew much more strongly between 2016 and 2017 (see below).
- Proportional growth on the Mallaig – Small Isles route (48%) was also very strong, although absolute growth was more modest given the low overall volumes on the route.
- Car growth on the Sconser – Raasay route has also been very strong. This will in part be due to residents taking their car on the ferry more often, although given that onward travel from Sconser will typically be made by car, the more significant influence is likely to be increased visitor numbers to the island.
CVs and coaches – change in carryings
- The Armadale – Mallaig route carries very few CVs and thus the 13% decline is related almost entirely to coach carryings. The reduction in coach traffic has been driven almost wholly by the reliability issues associated with the current vessel deployment, and in particular the vessels used on the route in 2016.
- There are likewise few CVs on the Sconser – Raasay route. The significant increase in CV movements likely relates more to the construction of the distillery and the subsequent delivery of raw materials rather than being an RET induced demand.
Passengers – long-term trend in carryings
The figure below shows the long-term trend in passenger carryings on the Skye, Raasay and Small Isles routes:
Figure 3.25: Skye, Raasay and Small Isles – change in passenger carryings 2007-18 (2007=100)
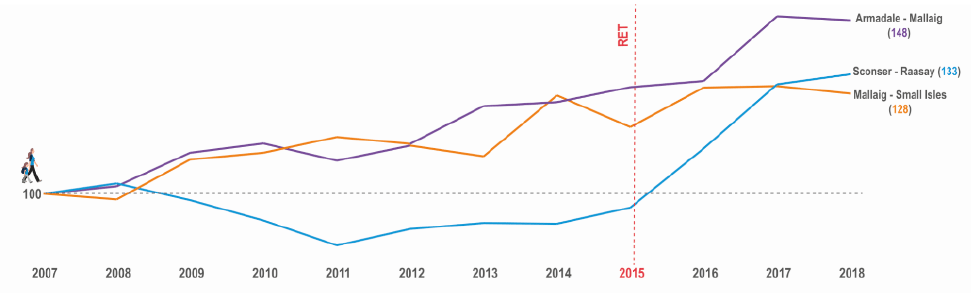
- There has been growth across all routes within this mini-network since 2007 but RET has accelerated this for the Mallaig – Armdale and Sconser – Raasay routes.
- Passenger numbers of the Small Isles route are more volatile but have nonetheless increased overall since RET was introduced.
Cars – long-term trend in carryings
The figure below shows the long-term trend in car carryings on the Skye, Raasay and Small Isles routes:
Figure 3.26: Skye, Raasay and Small Isles – change in car carryings 2007-18 (2007=100)
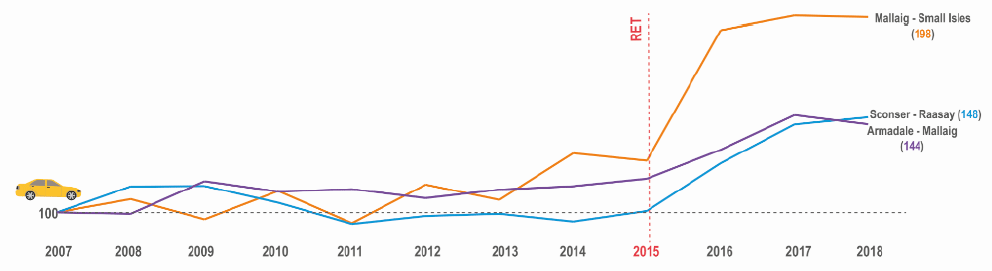
- There has been a strong growth in car traffic on the Mallaig – Armadale route since RET was introduced. The large price reduction has made the ‘shortcut’ route to the Central Belt more attractive, whilst also allowing tourists to make a circular trip to Skye using the bridge in one direction and the ferry in the other.
- Sconser – Raasay has also witnessed significant car growth in recent years reversing a period of decline since 2007. The introduction of the hybrid ferry MV Hallaig in 2013 supported modest growth on the route, with the combination of RET (2015) and the new distillery (2017) significantly accelerating that growth.
- There has been a notable growth in car carryings on the Mallaig - Small Isles route since RET was introduced. As vehicular access to the islands is almost entirely controlled by a permit system, these will be almost entirely resident trips. Following the spike in growth between 2015 and 2016, carryings have largely levelled off, suggesting a new settled level of demand.
CVs and coaches – long-term trend in carryings
The figure below shows the long-term trend in CV and Coach carryings on the Skye, Raasay and Small Isles routes:
Figure 3.27: Skye, Raasay and Small Isles – change in CV and coach carryings 2007-18 (2007=100)
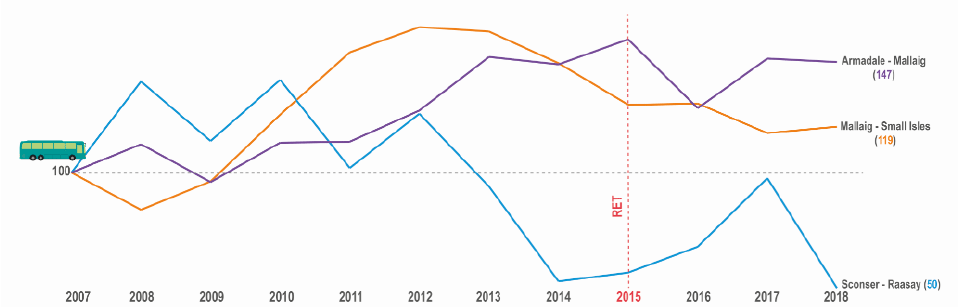
- Armadale – Mallaig has experienced a steady growth in coach traffic since 2007, although this has been dampened by the vessel deployment issues since summer 2016.
- There was a long-term decline in CV & coach carryings on the Sconser – Raasay route between 2007 and 2014, the reasons for which are not clear. However, the construction of the Distillery led to a growth in CV carryings before a subsequent drop-off in 2018 (despite the ongoing demand for distillery deliveries). Despite the magnitude of the changes, the absolute changes are relatively small.
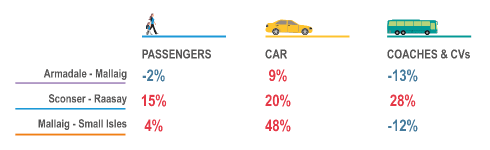
How did demand vary by timetable season?
The figures below show how passenger carryings changed by season when RET was introduced, comparing RET Year +1 and RET Year +1 (Counterfactual) passengers and cars. The difference shown for CVs and coaches is between RET Year -1 and RET Year +1 as they were not subject to RET:
Figure 3.28: Skye, Raasay and Small Isles – change in passenger carryings by season
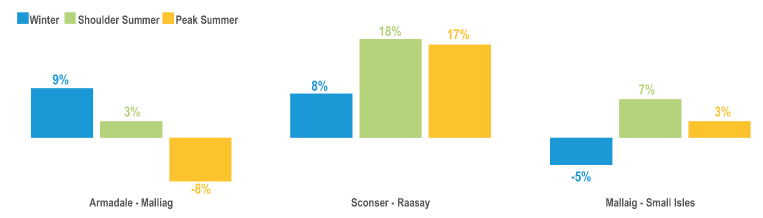
Figure 3.29: Skye, Raasay and Small Isles – change in car carryings by season
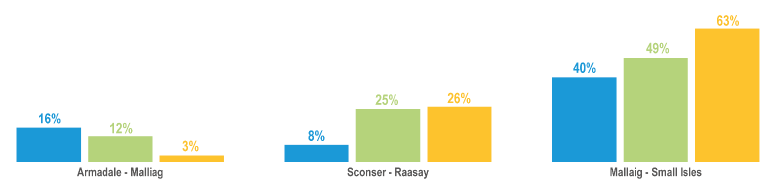
Figure 3.30: Skye, Raasay and Small Isles – change in CV and coach carryings by season
- There has been growth in passenger and car carryings on the Mallaig - Armadale route in the winter period. However, following the commencement of winter timetable, the route reduces to two return sailings per day on a low capacity vessel (MV Lochnevis) and therefore the changes in carryings are likely to be very small in absolute terms.
- The introduction of RET has supported strong shoulder summer growth on the Armadale – Mallaig route across all carrying types. Peak summer passenger carryings have however reduced by 6% (due to the reduction in coaches using the route (-2%), whilst car growth was a modest 3%. It can be argued that vessel deployment on this route since the summer 2016 timetable period has dampened the RET impact.
- Sconser – Raasay has demonstrated strong growth across all periods, particularly in the shoulder and peak summer periods. Car-based growth has outstripped passenger growth.
- Car growth on the Mallaig – Small Isles route has substantially outstripped passenger growth, which suggests that residents are now taking cars for trips they previously made as a foot passenger.
Outer Hebrides
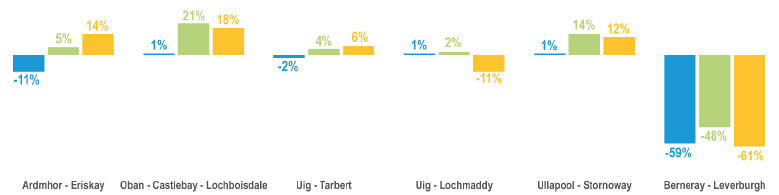
The figure below highlights the changes in carryings for passengers and cars between RET Year+1 and RET Year+1 CF. The difference shown for commercial vehicles and coaches is between RET Year-1 and RET Year+1. This is due to two aspects, firstly RET does not apply to commercial vehicles over 6m and secondly, there was a redefinition of the length at which a vehicle is classed as commercial from 5m to 6m.
Figure 3.31: Outer Hebrides – change in carryings
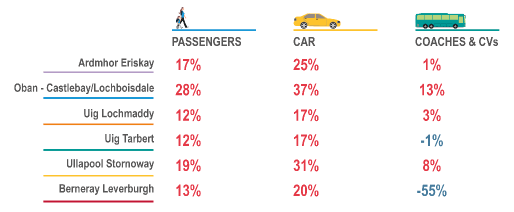
Passengers – change in carryings
- There has been strong passenger growth across the Outer Hebrides routes, with the largest growth on the longest routes (where the fares reductions were largest). Passenger numbers increased by 28% on the Oban – Castlebay / Lochboisdale route, despite the infrequency of the service and its susceptibility to weather-related disruption. Ullapool - Stornoway, the second longest route, grew by 19%.
Cars – change in carryings
- The Outer Hebrides set the trend for car growth exceeding passenger growth on most routes, suggesting that journeys previously made as a foot passenger are now being made by car.
- Growth was again very strong on the longest routes, albeit the relatively low carryings on Oban – Castlebay / Lochboisdale meant that the absolute growth was not significant. On the other hand, 31% growth on Stornoway – Ullapool, the volume route to the Outer Hebrides, represents strong absolute growth.
- The Sound routes have also grown strongly, fostering improved connectivity along the spine of the Outer Hebrides.
CVs and coaches – change in carryings
- The picture in relation to CVs is more nuanced in the Outer Hebrides than elsewhere. When RET was introduced in 2008, it included CVs and thus there was an initial increase, which was swiftly reversed when it was withdrawn in 2012 and the 6m rule introduced.
- On the Sound of Harris route, the redefinition of CV length from 5m to 6m when RET was introduced incentivised a switch of CV traffic into vans. This has contributed to a dramatic reduction in CV carryings on this route, which in 2016 were less than half their 2014 level (although there was a degree of recovery in 2017).
- The MV Isle of Lewis took up the Castlebay – Oban route for the summer 2016 timetable. As she is closed deck, she cannot carry certain categories of dangerous goods when in passenger operation. The increase in CV carryings on Ardmhor – Eriskay suggests that these CVs may be routing across the Sound of Barra.
Passengers – long-term trend in carryings
The figure below shows the long-term trend in passenger carryings on the Outer Hebrides routes:
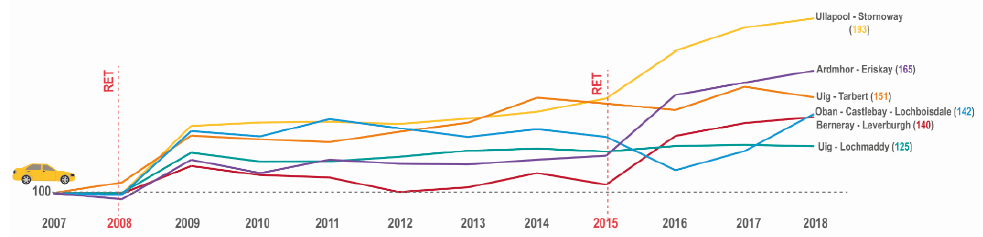
Figure 3.32: Outer Hebrides – change in passenger carryings 2007-18 (2007=100)
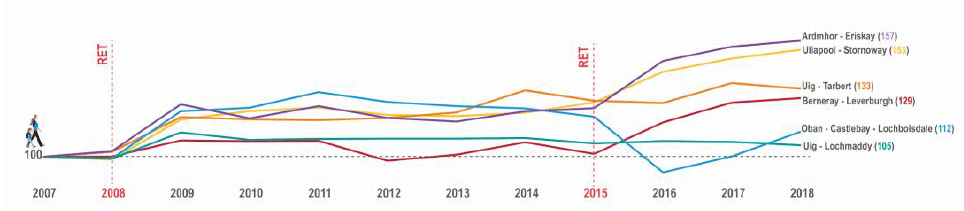
- Passenger numbers increased across all Outer Hebrides routes when RET was introduced in 2008. The general pattern was a one-off step change before returning broadly to the pre-RET trend. The RET story around the 2009-11 period is a complicated one, with the financial crash and subsequent recession dampening demand to some degree, but at the same time the ‘staycation’ effect supported an increase in demand.
- Passenger numbers on the Sound routes also increased when RET was introduced in 2015 – the main difference with these routes is that demand does not appear to have flattened off, with continued growth from 2016 onwards (albeit at a lesser rate than the first year).
- Passenger numbers increased on various routes between 2014 and 2016, but this was as a result of supply-side changes (e.g. the introduction of MV Loch Seaforth).
Cars – long-term trend in carryings
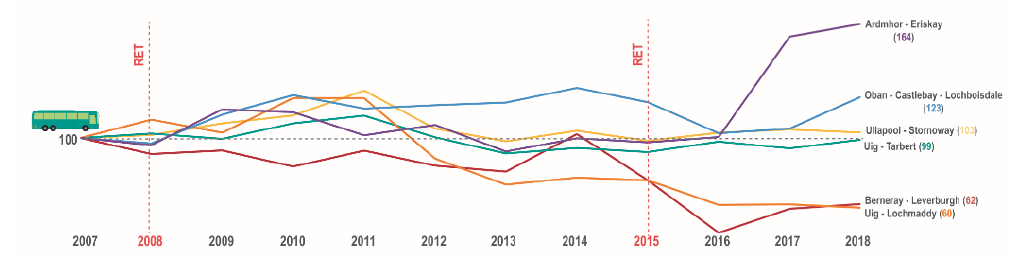
The figure below shows the long-term trend in car carryings on the Outer Hebrides routes:
Figure 3.33: Outer Hebrides – change in car carryings 2007-18 (2007=100)
- The growth in car traffic across all routes followed a similar trend, with a one-off step in growth followed by a broad return to trend. The magnitude of growth was though, much larger than was the case for passengers, highlighting the ‘foot passenger to vehicle’ switching effect.
- Car traffic growth on the Sound routes has also been significant and sustained.
CVs and coaches – long-term trend in carryings
The figure below shows the long-term trend in CV and coach carryings on the Outer Hebrides routes:
Figure 3.34: Outer Hebrides – change in CV and coach carryings 2007-18 (2007=100)]
- CV numbers increased across most routes when RET was first introduced in 2008 because, at that stage, commercial traffic benefitted from reduced fares. When RET was withdrawn for CVs in 2012, there was an Outer Hebrides-wide decline in commercial traffic, predominantly due to the redefinition of the length at which a vehicle is defined as commercial from 5m to 6m.
- It should be noted that the demise of MacAskill Haulage (one of the larger Lewis hauliers) at around the same time RET was withdrawn confuses the picture to some degree as it led to a state of flux in the market. Nonetheless, there was an evident reduction in CV carryings when RET was removed.
- CV carryings have grown strongly on the Ardmhor – Eriskay route since 2016. However, this is unrelated to RET, rather it reflects the deployment of a closed-deck vessel (the MV Isle of Lewis) on the Castlebay – Oban route, meaning that certain categories of dangerous goods now have to route across the Sound of Barra.
How did demand vary by timetable season?
The figures below show how passenger carryings changed by season when RET was introduced, comparing RET Year +1 and RET Year +1 (Counterfactual) passengers and cars. The difference shown for CVs and coaches is between RET Year -1 and RET Year +1 as they were not subject to RET:
Figure 3.35: Outer Hebrides – change in passenger carryings by season
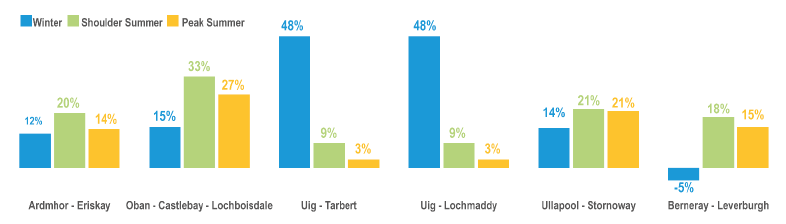
Figure 3.36: Outer Hebrides – change in car carryings by season
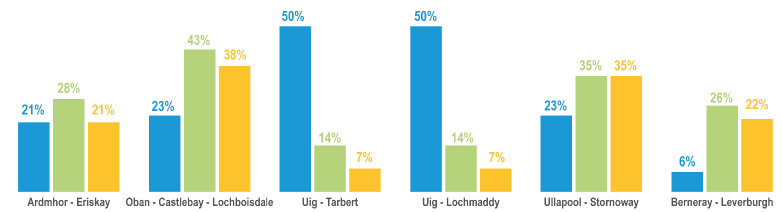
Figure 3.37: Outer Hebrides – change in CV and coach carryings by season
- RET has prompted growth across all seasons on most of the Outer Hebrides routes. Unsurprisingly, growth was strongly concentrated in shoulder and peak summer.
- The winter growth on Berneray – Leverburgh route is much more modest than other routes due to the reduction in the timetable imposed by the operational restrictions on that route.
Has this impacted on other modes of transport?
Non-RET ferry services
- Despite the introduction of RET on the Kennacraig – Islay route in 2012, passenger carryings on the Port Askaig – Feolin (Jura) route actually declined originally, only recovering to their pre-RET level in 2017. In contrast however, vehicle carryings have grown by over 10%, which again highlights that those previously travelling as a passenger are now taking their car to the mainland via Islay.
- Car carryings on the Corran Ferry have grown by around 4% between 2015 and 2017 despite the reduction in vehicle numbers of the Lochaline – Fishnish route (although the Tobermory – Kilchoan route has grown strongly).
- Despite an initial reduction in passenger numbers on the Port Appin – Point route when RET was introduced in 2015, numbers had recovered to their pre-RET levels by 2017. This suggests that the overall travel market from Lismore has grown.
Air
- With the exception of Stornoway, there was no significant reduction in airport terminal passengers in island airports when RET was introduced. There was a brief reduction in passengers at Islay when RET was introduced in 2012, but these promptly recovered in 2013. Terminal passengers at Stornoway have also since recovered to their pre-RET level.
- Whilst RET may have had an impact on air passenger numbers, it is not possible to demonstrate causality given that the aviation market is highly fluid in terms of e.g. routes, schedules, operators etc.
Rail
- In the year following the introduction of RET, rail passenger numbers declined at all ferry interchange stations except Mallaig. This reduction was particularly noticeable at Ardrossan Harbour (-11%) and Wemyss Bay (-7%), which highlights the RET induced switch from people who previously made journeys as a foot passenger now taking a car.
- The growth at Mallaig may reflect the increased frequency service on Mallaig – Armadale and use by passengers on the new Lochboisdale – Mallaig route, albeit the train times do not align well with the ferry timetable on that route.
- With the exception of Ardrossan Harbour (and possibly Wemyss Bay) which is a dedicated ferry interchange station, it is not possible to demonstrate causality between RET and the change in rail passenger numbers as these stations serve a much wider catchment than ferry passengers alone.
Road
- Ferry traffic accounts for such a small proportion of overall road-based traffic that it is difficult to identify any RET-related impact.
There is a paucity of bus passenger data available but feedback from several island bus companies in the ‘2015 RET’ islands suggests that use of island bus services has diminished as more ferry users now take their car. This finding was supported to some degree in the Arran RET Evaluation, which found that on-island bus passengers declined despite the larger volume of people on the island post the introduction of RET.
The survey and stakeholder feedback raised significant concerns on the impact of RET on bus services and local roads. However, there is only limited empirical data to evidence this point and thus more detailed investigation and analysis would be required in order to properly quantify these impacts.
How did ‘2015 RET’ island residents respond to the reduction in fares?
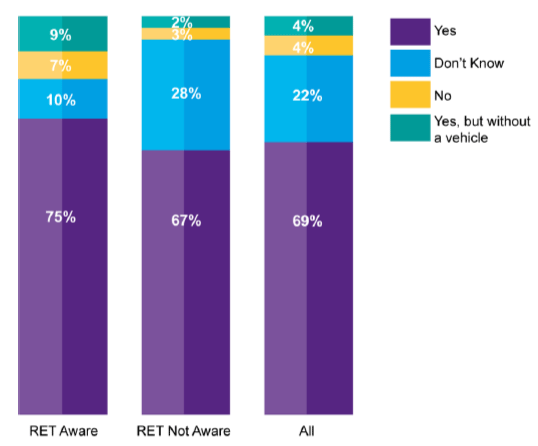
A key question is how island / peninsula residents responded to the introduction of RET – this is summarised in the figure below:
Figure 3.38: How did your use of the ferry change when RET was introduced? (Source: Resident Survey, n=568)
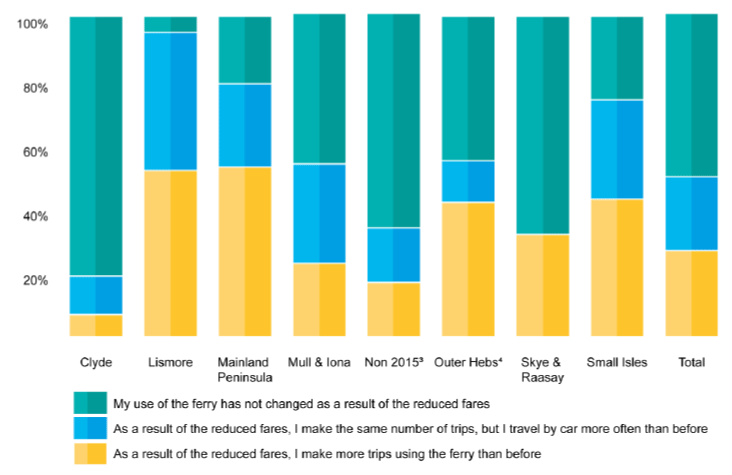
So overall, approximately:
- 50% did not change their use of the ferry
- 25% make more trips
- 25% make the same number of trips but take a car onboard more often
However, it can be seen from the above figure that the Clyde routes are very much the exception – here over 80% of respondents did not change their use of the ferry, reflecting the widespread prior use of multi-journey discounted tickets.
Key point: Around 25% of island residents made more ferry trips as a result of the introduction of RET, with a further 25% making the same number of trips as before RET was introduced, but they are now taking the car onboard more often.
Why did half of the people surveyed not change their use of the ferry?
Figure 3.39: Why did your use of the ferry not change when RET was introduced? (Source: Resident Survey, n=272)
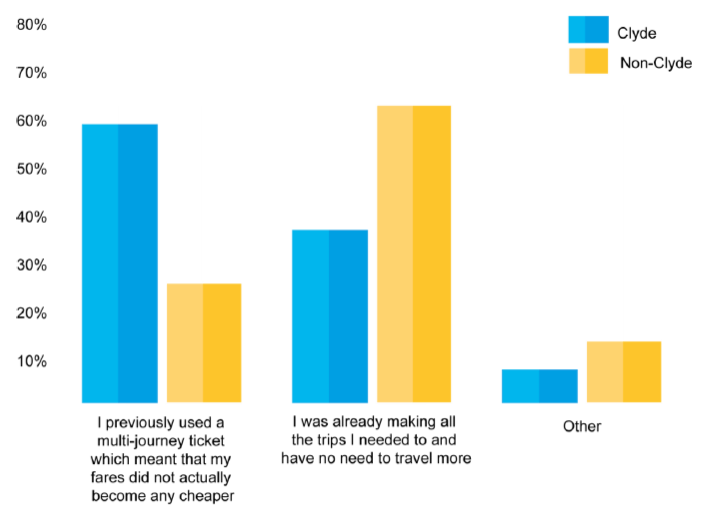
- For the Clyde routes, the multi-journey tickets are the main factor. On other routes, most people said they were already making all the journeys they wished to make and had no need to travel more often.
- Related to this, 75% of Clyde-based respondents said that RET had not saved them money. For the other islands, 60% of respondents said that they had saved money. Those who had not saved money overwhelmingly said that the reason for this was their previous use of multi-journey book tickets.
Key point: For those who did not make more trips when RET was introduced, the main reasons were the widespread use of discounted multi-journey books prior to the introduction of RET (particularly on the Clyde routes) and because residents were making all the journeys they wished to make and had no need to travel more often.
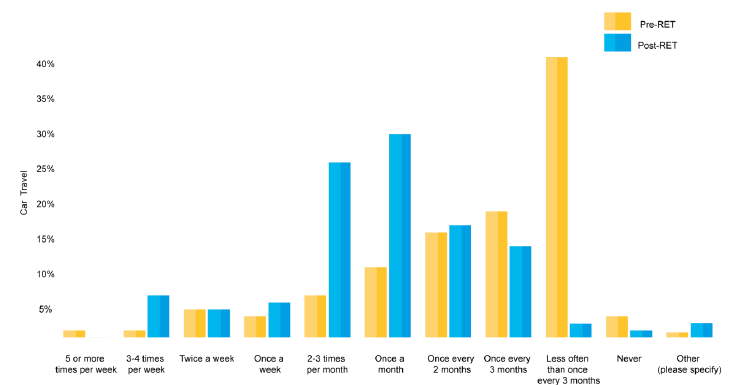
How many more trips do people make?
In the resident survey, those who indicated that they now travel more often were asked to indicate how often they travelled as a foot passenger and as a car-based passenger before and after RET was introduced – the responses to this question are summarised in the figures below for foot passengers and cars respectively:
Figure 3.40: How many more foot passenger trips are made following the introduction of RET? (Source: Resident Survey, n=144)
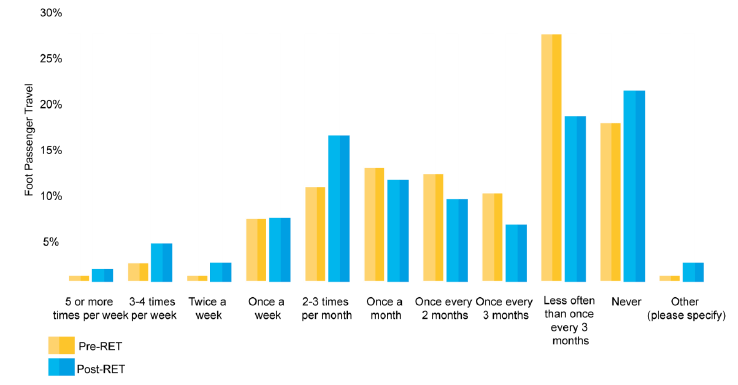
The survey findings suggest that additional foot passenger travel is being made by island residents. All of the less frequent travel categories (i.e. reading from ‘once a month’ to the right) reduce, whilst all of the more frequent categories increase. This implies that RET has stimulated additional journeys – whilst this aligns with carryings data presented, it should be noted that the figures imply a greater increase in travel than the carryings data would suggest (potentially reflecting a response bias where more frequent ferry users have responded).
It is also notable from the above figure that there is a small increase in those who now ‘never’ travel as a foot passenger. As there are no foot passenger capacity constraints on the vessels, this is likely to be almost wholly due to those who previously travelled on foot now taking a car on the ferry, responding to the incentive provided by the lower fares.
The equivalent figure for car-based travel is shown below:
Figure 3.41: How many more car-based trips are made following the introduction of RET? (Source: Resident Survey, n=144)
The figure above aligns with the trend noted in the carryings data, whereby the frequency of car travel on the ferry is increasing across almost all categories. Moreover, those who used to travel infrequently by car (i.e. less than once every 3 months) are now travelling more often. There is also a corresponding reduction in the number of people who ‘never’ take a car, which aligns with the suggested switch from foot passenger to car driver identified in the commentary on the previous figure.
As with the equivalent data for foot passengers, the responses presented above imply a greater increase in travel than the carryings data would suggest, again potentially indicating a reason bias in favour of more frequent users.
Key point: The resident survey suggests that residents of the ‘2015 RET’ islands are now using the ferry more frequently as both foot passengers and car drivers. However, the responses also suggest a switch from travelling as a foot passenger to now taking a car onboard the ferry, a point which is supported by the carryings data.
In the onboard survey, people were asked whether they would still be making their trip had RET not been introduced. Those unaware of RET were informed that fares would be 20%-30% higher under a no-RET scenario and asked to judge whether they would have still made the journey. The results are presented in the figure below:
Figure 3.42: Would you still be making this journey had RET fares not been introduced? (Source: Onboard Survey, n=1,320)
The figure above suggests that the growth in ferry travel on the ‘2015 RET’ routes as a result of the fares reduction is actually relatively minimal – in total, if the “don’t knows” are excluded, 6% of journeys would not have been made without RET (these proportions did not differ significantly between residents and visitors).
It should though be noted that these figures imply a lower increase in travel as a result of RET than the carryings data would suggest.
Key point: The level of induced demand as a result of RET on the ‘2015 RET’ routes is relatively small, some 6% in total (although it should be noted that this is a more modest increase than the carryings data would suggest).
For what purpose are these additional trips?
In the resident survey, respondents were asked the main purpose they travelled for when making these new trips – the results are shown in the figure below:
Figure 3.43: Trip purpose of additional resident journeys (Source: Resident Survey, n-133)
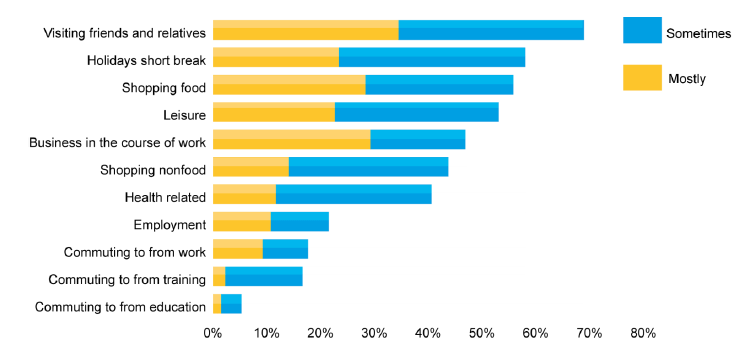
The figure suggests that RET-induced journeys by residents are primarily made to:
- visit friends and relatives, which is a social benefit and critically important element of island wellbeing (for example, this could be parents visiting children who have moved away or elderly relatives on the mainland)
- go food shopping, which is beneficial for the consumer but implies a disbenefit for the island as a result of economic leakage (i.e. money being spent off-island)
- undertake business travel in the course of work, implying that new business opportunities are being taken up
The sample sizes for journeys which would not have been undertaken in the absence of RET in the onboard surveys are small. For visitors, all are holiday, day-trip or leisure-based trips. For residents, leisure day-trip, visiting friends and relatives and shopping were the main purposes of these new trips.
Key point: The additional trips generated by the reduction in fares in the ‘2015 islands’ are predominantly for visiting friends and relatives, shopping, business travel and day-trips / holidays. It is also important to note that RET has made a significant contribution to facilitating health-related journey purposes, a highly positive outcome given the significant challenges / inequalities which can be experienced by island residents accessing healthcare.
To what extent have people switched from travelling as a foot passenger to car-based travel?
In the resident survey, those switching from foot-passenger to vehicle-based travel were asked how often they took a car on board before and after RET:
Figure 3.44: How often was a car taken on the ferry before and after RET? (Source: Resident Survey, n=128)
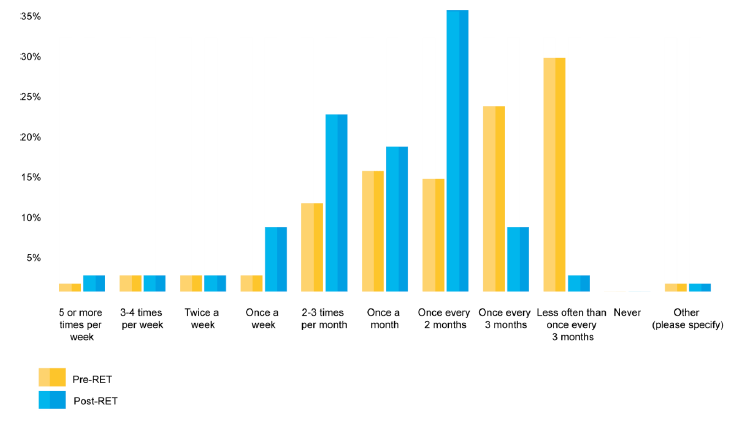
The responses to this question broadly correlate with the question on the number of additional trips being made as a foot passenger and by car. In general, residents are now taking their car on the ferry much more frequently – in the above figure, the less frequent usage categories drop sharply, especially ‘less often than once every 3 months’. This implies that cost was a significant barrier for many to travelling by car and RET has removed this.
From the onboard survey, it was estimated that 6% of surveyed trips would have been undertaken as a foot passenger in the absence of RET (if ‘don’t knows’ are excluded).
Key point: RET has incentivised additional journeys by car amongst residents. This implies that the cost of taking a car was a significant barrier for many and RET has removed this in the ‘2015 RET’ islands.