2. Emissions trends for Scotland
Carbon Account for Transport No. 11: 2019 Edition
2. Emissions trends for Scotland
In 2017, Scotland's total emissions, measured at source, were 40.5 MtCO2e. This is a reduction of 3.3% from the 2016 figure of 41.9 MtCO2e, and 46.8% below the 1990 baseline of 76.3 MtCO2e. The general downward trend in total emissions has been driven by a reduction in emissions from the energy supply, business and industrial processes, waste management, and agriculture and related land use sectors.
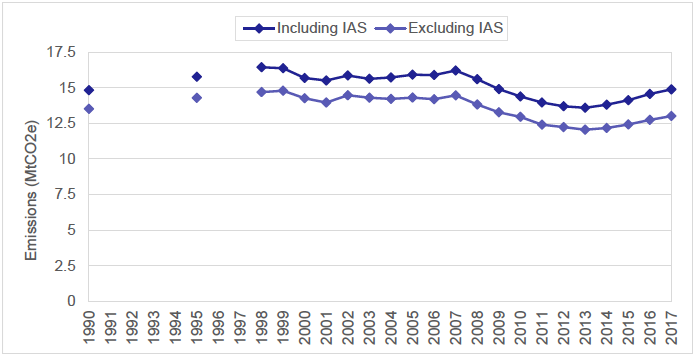
Transport emissions, including international aviation and shipping, accounted for 14.9 MtCO2e in 2017; a 2.2% increase from 2016 and 0.4% above the 1990 baseline. It is the fourth consecutive year that transport emissions have risen since the previous low in 2013, and the first year since 2009 that transport emissions have exceeded the 1990 baseline. Figure 1 shows Scotland's annual transport emissions between 1990 and 2017.
Figure 1: Time series of Scotland's total transport emissions, 1990-2017.
Source: National Atmospheric Emissions Inventory.
Transport (including IAS) was the largest contributing sector to total Scottish greenhouse gas emissions for the third consecutive year in 2017, accounting for 36.8% of Scotland's total emissions.
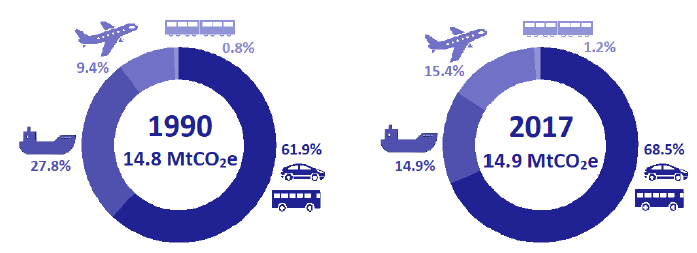
Road transport accounted for 10.2 MtCO2e (68.5% of all transport emissions), the largest share of all transport modes. Emissions for shipping and aviation were 2.30 MtCO2e (15.4%) and 2.21 MtCO2e (14.9%) respectively, and rail emissions were 0.17 MtCO2e (1.2%). Since 1990, the share of transport emissions due to shipping has generally fallen, while the shares due to road, rail and aviation have generally increased. Figure 2 illustrates the sectoral contributions to Scotland's transport emissions in 1990 and 2017.
Figure 2: Share of transport emissions by transport sector, 1990 and 2017.
Source: National Atmospheric Emissions Inventory.
A detailed discussion of emissions for each transport sector is presented in sections 2.1-2.4.
2.1 Road transport
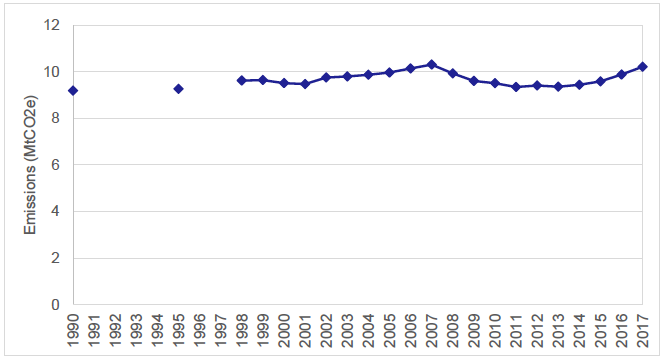
Road transport emissions were 10.2 MtCO2e in 2017, accounting for 68.5% of Scotland's total transport emissions. Figure 3 shows Scotland's annual road transport emissions between 1990 and 2017.
Figure 3: Time series of Scotland's road transport emissions. 1990-2017.
Source: National Atmospheric Emissions Inventory.
A number of factors have influenced the fluctuations in road transport emissions in recent years. While road vehicles have become more fuel efficient, this has largely been offset by an increase in vehicle kilometres. Since 2011, total road vehicle kilometres have increased every year, and in 2017 were higher than at any point in the 10 years prior. Between 2011 and 2017, road emissions increased by 9.3%, while road vehicle kilometres increased by 10.6% over the same period. Conversely, between 2007 and 2011 road emissions fell by 9.3% while vehicle kilometres fell by 2.9%.[2]
2.1.1 Road emissions by vehicle type
Cars
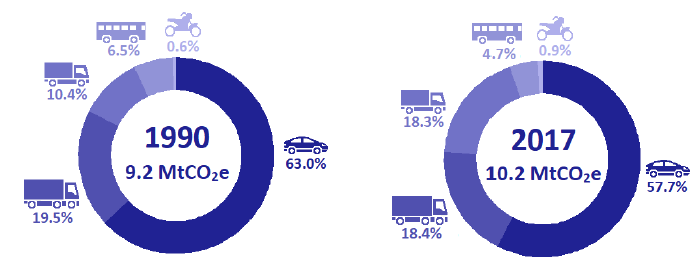
Car emissions were 5.89 MtCO2e in 2017, an increase of 2.3% from 2016, and 1.7% above the 1990 baseline. Between 2016 and 2017 car kilometres increased by 2.4%. Cars accounted for 39.5% of all transport emissions, the largest contribution of any transport mode, and 57.7% of road transport emissions. Car emissions have risen every year since 2013, before which they had generally fallen since 2007.
Heavy goods vehicles
HGV emissions were 1.88 MtCO2e in 2017, an increase of 3.5% from 2016, and 5.2% above the 1990 baseline, accounting for 12.6% of all transport emissions. Between 2016 and 2017 HGV kilometres increased by 2.0%.
Light goods vehicles
LGV emissions were 1.87 MtCO2e in 2017, an increase of 6.5% from 2016. LGV emissions have increased by 95.6% since 1990, the largest increase of all road transport modes, and have increased every year since 2009. LGV kilometres have also increased significantly in recent years. Between 2016 and 2017 LGV kilometres increased by 7.7%. This has coincided with recent growth in the UK e-commerce market, for which LGVs are a prime means of delivery. The UK e-commerce market grew by 15.8% in 2017, the largest year-on-year increase since 2011.[3]
Buses and coaches
Bus and coach emissions totalled 0.48 MtCO2e in 2017, 3.2% of all transport emissions. This is an increase of 5.1% from 2016, but is 19.4% lower than the 1990 baseline. In general, bus emissions have gradually declined since 1990. Bus kilometres increased by 3.7% between 2016 and 2017, but have generally been decreasing since 2010.
Motorcycles
Motorcycle emissions for 2017 were 0.04 MtCO2e, an increase of 6.2% from 2016, but 8.7% below the 1990 baseline. Between 2016 and 2017, motorcycle kilometres increased by 5.5%. Motorcycles accounted for 0.2% of Scotland's transport emissions in 2017.
Figure 4 shows the proportion of Scotland's total road emissions contributed by each transport mode, in 1990 and 2017.
Figure 4: Proportion of Scottish road transport emissions by transport mode, 1990 and 2017.
Source: National Atmospheric Emissions Inventory.
2.1.2 Road emissions by type of road
Emissions from motorway driving were 1.94 MtCO2e in 2017, an increase of 2.7% from the previous year, and accounted for 19.1% of road emissions. Motorway emissions have increased significantly since 1990, with the 2017 figure 73.5% above that of the 1990 baseline. This increase in motorway emissions has coincided with a significant increase in the length of Scotland's motorway network. Between 1990 and 2017 Scotland's motorway network increased in length from 312km to 645km. Motorway vehicle kilometres rose from 3.2 billion in 1990 to 8.1 billion in 2017.[4]
Rural road emissions were 4.52 MtCO2e in 2017, accounting for 44.6% of road emissions, and urban road emissions were 3.68 MtCO2e (36.3%). The methodology used to classify between urban and rural roads has changed since the last publication, therefore it is not possible to compare the most recent emissions figures for these roads to previous years. However, between 1990 and 2016 there was a small decrease in urban emissions, and a slight increase in rural emissions.
2.1.3 Emissions of licensed vehicles
There were 249,713 new vehicle registrations in Scotland in 2017, a decrease of 7.6% from the previous year. The total number of vehicles registered in Scotland at the end of 2017 was 2.96 million, 1.5% more than at the end of 2016.
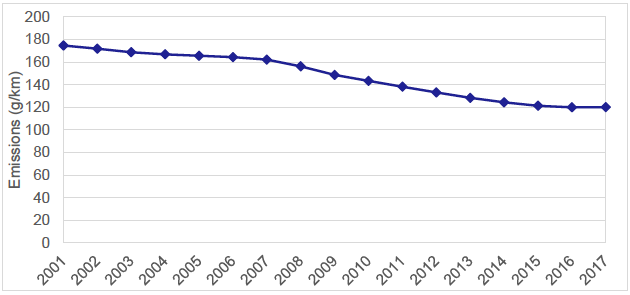
The average CO2 emissions of new cars registered in Scotland in 2017 was 120.2g per kilometre, 0.1% higher than the 2016 all-time low of 120.0 g/km. This was the first time that the average emissions of new car registrations increased since records began in 2001, and is broadly due to a shift towards the registration of larger models. Figure 5 shows the average annual emissions of newly registered cars in Scotland.
Figure 5: Average emissions of newly registered cars in Scotland, 2001-2017.
Source: Scottish Transport Statistics, table 13.6a.
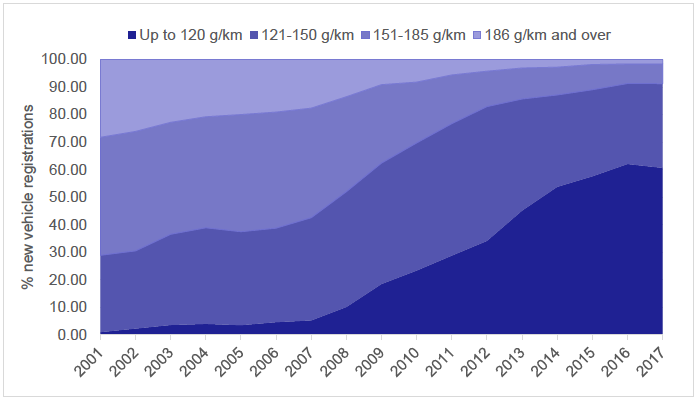
The proportion of new cars registered in higher emissions bands fell significantly between 2001 and 2017. In 2001, 71% of newly registered cars, for which emissions were known, had emissions of at least 151 g/km, compared with just 9% in 2017.[5] The proportion of newly registered cars with emissions of less than 120 g/km rose from 1% in 2001 to 61% in 2017. Figure 6 illustrates the proportions of newly registered cars in each emissions band.
Figure 6: Newly registered cars in Scotland by emissions band, 2001-2017.
Source: Scottish Transport Statistics, table 13.6a.
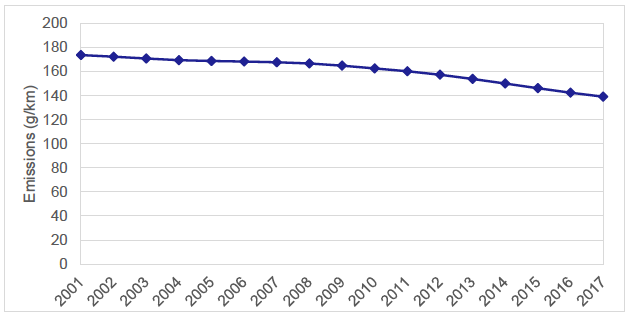
The improvements in efficiency of newly registered cars between 2001 and 2017 caused the average emissions of all cars licensed in Scotland to decrease every consecutive year during this period. At the end of 2017, the average CO2 emissions of cars licensed in Scotland was 139.1 g/km, down 2.3% from the previous year, and 19.9% below the 2001 average. Figure 7 shows average annual average emissions of all cars licensed in Scotland.
Figure 7: Average emissions of all cars licensed in Scotland, 2001-2017.
Source: Scottish Transport Statistics, table 13.6b.
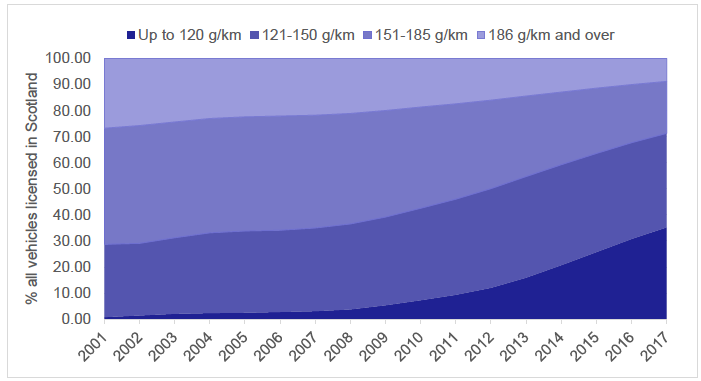
The proportion of all cars licensed in Scotland emitting 120g/km of CO2 or less increased from 1% in 2001 to 35% in 2017, while the proportion of cars emitting 186g/km or more of CO2 fell from 27% in 2001 to 9% in 2017. Figure 8 shows the proportions of all licensed cars by emissions band between 2001 and 2017.
Figure 8: Cars licensed in Scotland by emissions band, 2001-2017.
Source: Scottish Transport Statistics, table 13.6b.
2.1.4 Ultra-low emissions vehicles (ULEVs)
The Scottish Government has committed to phasing out the need for new petrol and diesel cars and vans by 2032. This will be supported by a significant increase in the uptake of ultra-low emissions vehicles.
An ultra-low emissions vehicle (ULEV) is defined as any road vehicle that emits less than 75g of CO2 per kilometre. ULEVs include battery electric vehicles, hybrid electric vehicles, range-extended electric vehicles, and hydrogen fuel cell vehicles.
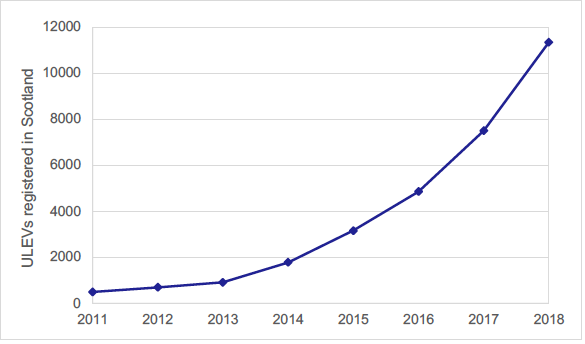
The number of ULEVs registered in Scotland has been grown significantly in recent years, from 497 vehicles in 2011 to 11,350 ULEVs registered in Scotland at the end of 2018 Figure 9 shows the total number of ULEVs registered in Scotland at the end of each year, for 2011 to 2018.
Figure 9: Number of ULEVs registered in Scotland at year end, 2011-2018.
Source: Scottish Transport Statistics, table 13.8.
44% of respondents to the 2018 Scottish Household Survey said they would consider buying an electric car or van, an increase from 41% in 2016. For respondents who said they would not consider buying an electric vehicle, the main deterrents were the distance that could be travelled on a single charge (46%) and the availability or convenience of charging points (also 41%).[6]
Scotland's electric vehicle charging network, ChargePlace Scotland, has grown substantially in recent years. At the end of 2017 there were 1,032 public and non-public (workplace) charge points available on the ChargePlace Scotland estate, and by the end of 2018 this had increased by a further 14.8% to 1,185.
In 2017, the ChargePlace Scotland network was used 424,865 times and provided charge for 20.7 million electric vehicle kilometres. In 2018 it was used 590,590 times and provided charge for 32.7 million electric vehicle kilometres.
2.2 Shipping
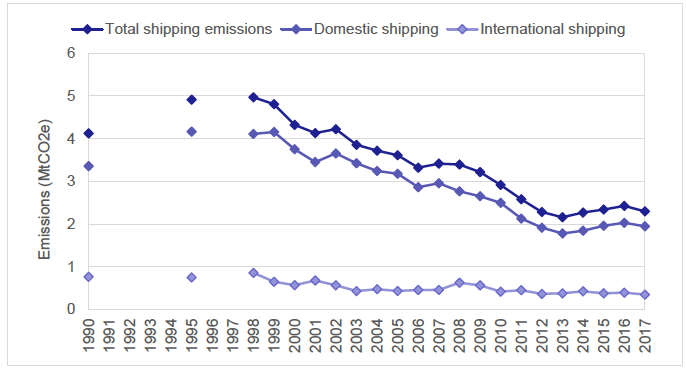
Shipping emissions were 2.30 MtCO2e in 2017, a decrease of 5.3% from 2016 and 44.3% below the 1990 baseline. This accounted for 15.4% of transport emissions.
Both domestic and international shipping emissions fell in 2017, with domestic shipping accounting for 1.95 MtCO2e and international shipping accounting for 0.35 MtCO2e. This is an all-time low for international shipping. Since 1990, domestic shipping emissions have fallen by 42% and international shipping emissions have fallen by 54.3%.
Figure 10 shows Scotland's annual shipping emissions between 1990 and 2017.
Figure 10: Time series of Scotland's shipping emissions, 1990-2017.
Source: National Atmospheric Emissions Inventory.
2.3 Aviation
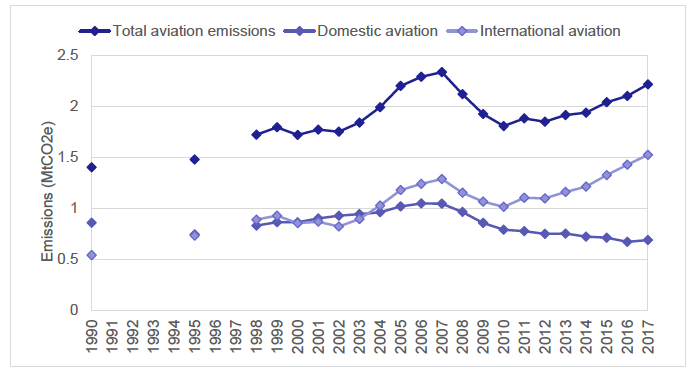
Total aviation emissions, including aircraft support vehicles and military aircraft, were 2.21 MtCO2e in 2017, an increase of 5.4% from 2016 and 58.0% above the 1990 baseline. Aviation emissions were 14.9% of Scotland's total transport emissions in 2017, the largest share they have ever accounted for.
Both domestic and international aviation emissions rose in 2017, with domestic aviation accounting for 0.69 MtCO2e and international aviation accounting for 1.52 MtCO2e. Since 1990, domestic aviation emissions have decreased by 19.7% while international aviation emissions have risen by 181.3%.
Figure 11 shows Scotland's annual aviation emissions between 1990 and 2017.
Figure 11: Time series of Scotland's aviation emissions, 1990-2017.
Source: National Atmospheric Emissions Inventory.
2.4 Rail
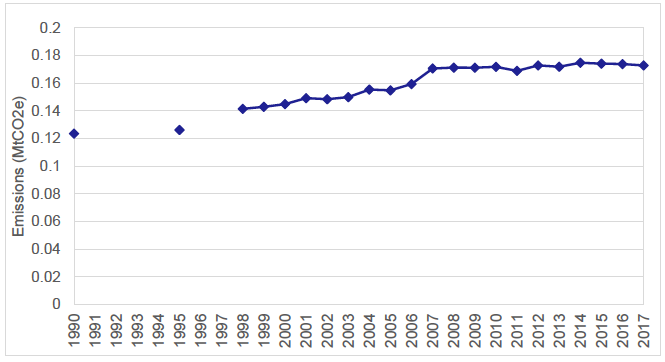
Rail accounted for 0.17 MtCO2e (1.2%) of transport emissions in 2017, a decrease of 0.6% from 2016, but 39.9% above the 1990 baseline. Figure 12 shows Scotland's annual rail emissions between 1990 and 2017.
Figure 12: Time series of Scotland's rail emissions, 1990-2017.
Source: National Atmospheric Emissions Inventory.
The general long-term increase in rail emissions has largely been due to a significant increase in the number of rail passengers. In the 10 years to 2017, passenger kilometres increased by 22.0%, and scheduled train kilometres increased by 14.4%.