Emissions of licensed vehicles
Emissions of licensed vehicles
There were 233,058 new vehicle registrations in Scotland in 2018, a decrease of 7.1% from the previous year. The total number of vehicles registered in Scotland at the end of 2018 was 2.9 million, 1% more than at the end of 2017.[5]
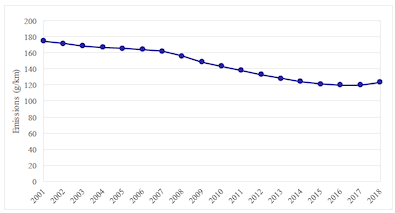
The average CO2 emissions of newly registered cars in Scotland in 2018 was 123.6 grams per kilometre, 2.8% higher than last year. This is the second year that average emissions for newly registered vehicles have seen an increase since records began in 2001. Since 2001 newly registered cars with an average emissions value higher than 140 grams CO2 per kilometre have fallen significantly, with 94,746 fewer vehicles on the road in 2018, this represents a decline of 254%. Figure 5 shows the year-on year change in average emissions of newly registered cars in Scotland.
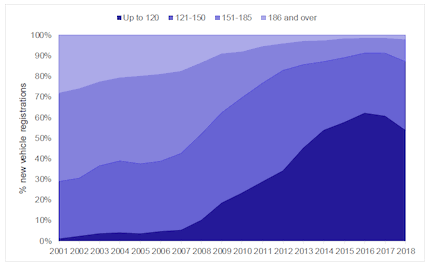
The number of newly registered cars with average emissions of up to 120 grams of CO2 per kilometre has increased by 98.6% since 2001, while those with average emissions between 121-150 grams of CO2 per kilometre on average have increased by 31.6%. New registrations of cars emitting 151 grams of CO2 per kilometre or over have decreased by 353.9% since 2001.[6]
As a result of the improved fuel-efficiency of newly registered cars between 2001 and 2018, average emissions of the total number of cars licensed in Scotland have continued to decrease every year. In 2018, the average emissions of all cars licensed in Scotland fell by 2.6 grams of CO2 per kilometre, representing a 1.9% drop in average emissions per kilometre travelled. Additionally, since the baseline, the average grams of CO2 per kilometre driven by cars has fallen by 37.2 or 27.3%.
Figure 5: Average emissions of newly registered cars in Scotland, 2001-2018 (Source: Scottish Transport Statistics, Table 13.6a)

The proportion of new cars registered in higher emissions bands fell significantly between 2001 and 2018. In 2001, 53% of newly registered cars had emissions of at least 151 g/km, compared with just 13% in 2018. The proportion of newly registered cars with emissions of less than 120 g/km rose from 1% in 2001 to 53.4% in 2018. Figure 6 illustrates the proportions of newly registered cars in each emissions band.
Figure 6: Newly registered cars in Scotland by emissions band, 2001-2018 (Source: Scottish Transport Statistics 2019, Table 13.6a).

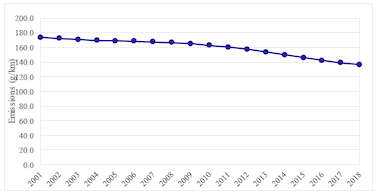
The improvements in efficiency of newly registered cars between 2001 and 2018 caused the average emissions of all cars licensed in Scotland to decrease every consecutive year during this period. At the end of 2018, the average CO2 emissions of cars licensed in Scotland was 136.5 g/km, down 1.9% from the previous year, and 27.3% below the 2001 average. Figure 7 shows the year-on-year change in average emissions of all cars licensed in Scotland.
Figure 7: Average emissions of all cars licensed in Scotland, 2001-2018 (Source: Scottish Transport Statistics, Table 13.6b).

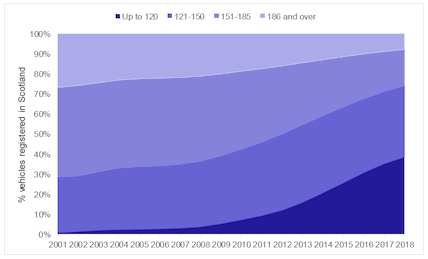
The proportion of cars licensed in Scotland emitting 120g/km of CO2 or less increased from 0.1% in 2001 to 37.7% in 2017. The proportion of cars emitting 186g/km or more of CO2 increased from 2.5% in 2001 to 7.6% in 2018.
Figure 8: Cars licensed in Scotland by emissions band, 2001-2018 (Source: Scottish Transport Statistics, Table 13.6b).
