Delivery evaluation – Where and how were the audits conducted? What did the audits find?
Characteristics of the evaluated CSA/SRA projects
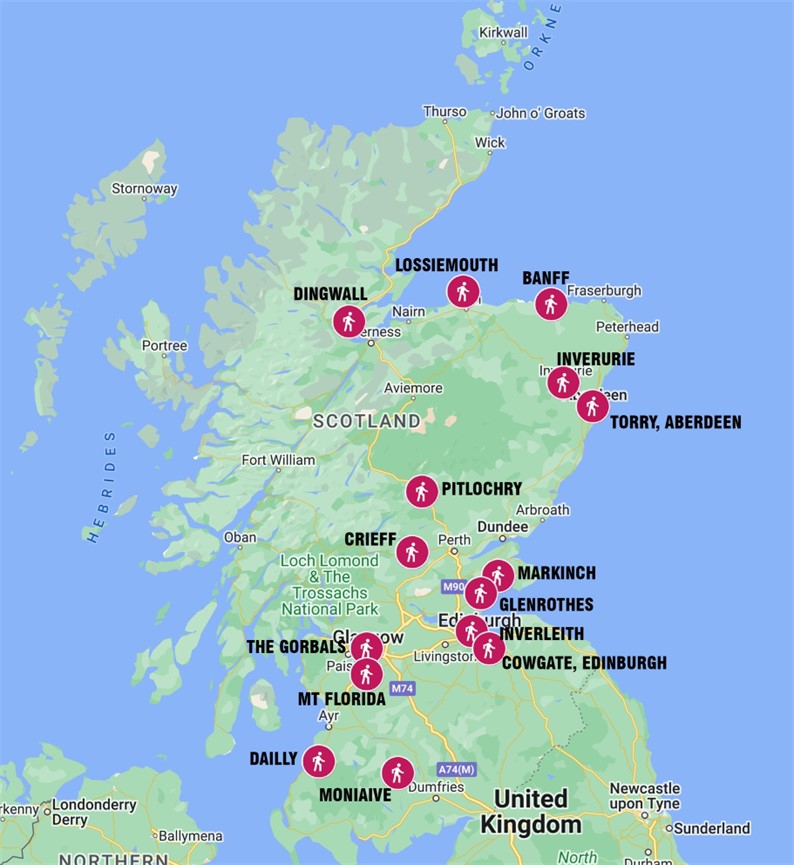
The sixteen evaluated CSA/SRA projects represent a geographic spread across Scotland and settlement types. There was a fairly even rural-urban split, with nine projects in rural locations (56%) and seven projects in an urban setting (44%). The settlement types included were varied, including two rural villages (13%), seven rural towns (44%), two large towns (13%), and five city settings (31%). Of note is that while Dingwall and Lossiemouth are within the Highlands and Islands Enterprise Area, no projects were available from the Islands or more remote rural settings. Despite this limitation, the included selection broadly represents settlement types in Scotland.
| No. | Report name | Settlement | Population | Settlement type |
|---|---|---|---|---|
| 1 | Lower Speed Communities - Lossiemouth | Lossiemouth | 6,840 | Rural town |
| 2 | Making Room for Pedestrians - Moniaive | Moniaive | <865 | Rural village |
| 3 | Lower Speed Communities - Mount Florida | Mount Florida, Glasgow | 1,028,220 | Urban suburb |
| 4 | Living Streets Audit - Dingwall | Dingwall | 5,360 | Rural town |
| 5 | Community Street Audit Report, Inverurie Town Centre | Inverurie | 14,660 | Rural town |
| 6 | Community Street Audit Report Pitlochry | Pitlochry | 2,880 | Rural town |
| 7 | Community Street Audit of Broich Road and Routes to School, Crieff | Crieff | 7,280 | Rural town |
| 8 | A Community Street Audit Report of Streets in The Gorbals, Glasgow | The Gorbals, Glasgow | 1,028,220 | Urban suburb |
| 9 | Street Audit Report for 'The Hen Hooses', Torry, Aberdeen | Torry, Aberdeen | 220,690 | Urban suburb |
| 10 | Edinburgh Cowgate - Community Street Audit Report | Cowgate, Edinburgh | 530,990 | Urban suburb |
| 11 | A Community Street Audit of a Route in Markinch, Fife | Markinch, Fife | 2,428 | Rural town |
| 12 | Community Street Audit Report - Glenrothes | Glenrothes | 44,760 | Large Town |
| 13 | Community Street Audit Report - For Falkirk Area Disability and Access Panel Falkirk Grahamston Station to Falkirk Retail Park | Falkirk | 103,380 | Large Town |
| 14 | Walkable Communities. A Community Street Audit of a Route in Dailly | Dailly | <1,652 | Rural village |
| 15 | Walkable Inverleith Project Report Deanhaugh Street, Raeburn Place and Comely Bank Road, Edinburgh | Inverleith, Edinburgh | 530,990 | Urban suburb |
| 16 | Community Street Audit Report - Banff | Banff | 4,000 | Rural town |
- Population column - National Records of Scotland (2022) Mid-2020 Population Estimates for Settlements and Localities in Scotland. Table 2.1: Population Estimates of Settlements by Sex and Broad Age Group
- Population for number two - Scottish Government (2020) Scottish Index of Multiple Deprivation Interactive Mapping
- Population for 14 - DETR Environment Transport Regions (1998) Walking in Great Britain Transport Statistics Report
The included projects represent a range across SIMD deciles. Three projects (19% of all projects) include areas from the most deprived 10%. A total of six projects (38%) had areas within the most deprived 20%. Only two projects (13%) are located in areas of the least deprived 30%. About eight projects (50%) can be described as mixed SIMD, including areas above and below the mid-point. For this evaluation, the sample was considered a relevant representation across SIMDs as it includes some of the most deprived areas of Scotland.
| No. | Settlement | Local authority | SIMD deciles |
|---|---|---|---|
| 1 | Lossiemouth | Moray Council | 7, 7, 4 |
| 2 | Moniaive | Dumfries and Galloway Council | 6 |
| 3 | Mount Florida, Glasgow | Glasgow City Council | 8, 2, 3 |
| 4 | Dingwall | The Highland Council | 6, 2, 4, 9 |
| 5 | Inverurie | Aberdeenshire Council | 8, 4, 6, 7 |
| 6 | Pitlochry | Perth and Kinross | 9, 8 |
| 7 | Crieff | Perth and Kinross | 6, 4, 5 |
| 8 | The Gorbals, Glasgow | Glasgow City Council | 1, 1, 1, 4, 1, 5, 2 |
| 9 | Torry, Aberdeen | Aberdeen City | 1, 1, 3 |
| 10 | Cowgate, Edinburgh | City of Edinburgh Council | 6, 2 |
| 11 | Markinch, Fife | Fife Council | 6, 8, 6 |
| 12 | Glenrothes | Fife Council | 3, 1, 10 |
| 13 | Falkirk | Falkirk Council | 3 |
| 14 | Daily | South Ayrshire Council | 4, 5 |
| 15 | Inverleith, Edinburgh | City of Edinburgh | 9, 10, 10, 10 |
| 16 | Banff | Aberdeenshire Council | 4 |
Legend:
1 = most deprived, 10 = least deprived
Settlement numbers 3, 4, 8, 9, 10 and 12 include the most deprived 20%
Settlement numbers 6 and 15 include the least deprived 30% only
Commissioning and timeline
While there are sixteen projects included in the evaluation, six had two audits resulting in twenty-two CSAs and SRAs. Thirteen CSAs (59%) and 9 SRAs (41%) were included. Most projects were commissioned by a local authority partner (88%), with only two commissioned by a community group (13%). Thirteen local authority areas are covered across the sixteen projects. In three cases, the local authority had commissioned a series of CSAs: the City of Edinburgh Council commissioned six, Perth & Kinross Council commissioned eleven, and Aberdeenshire Council commissioned seven. The audits were conducted between 2014 and 2019. From 2020, Living Streets paused the auditing process due to the Covid-19 pandemic.
Strategic and amenity value of audit routes
The routes were selected with the local community partners and represent short, everyday journeys. Twelve (75%) project routes included a high street or retail centre, thirteen (81%) projects included schools and/or a college or nursery facility, fourteen projects (88%) included access to a greenspace or park, seven (54%) included a major transport interchange such as a local train or bus station (not including local bus services). All sixteen (100%) project locations included a community or medical facility such as a sports centre or hospital. As such, the selected audit routes are of high amenity value and overlap with core everyday walking zones for each settlement.
The audit routes are understandably walking scale. The average audit route length is 1.3 km, with a range from the shortest route of 0.5 km to the longest of 2.8km. From the perspective of a more vulnerable user, such as a child or an older person, a distance of 1.3 km represents about 26 minutes of walking (Based on a walking speed of 3 km per hour). For a non-disabled person, this same distance represents less than 20 minutes of walking (Based on a walking speed of 5 km per hour). As such, the audit routes fall within core walking distance potential and given the high amenity value, relate well to the emerging 20-Minute Neighbourhood agenda.
Engagement and community
The audits demonstrated a strong approach to community engagement. Fourteen (88%) projects included additional engagement before or after audit walkabouts. These ranged from interviews, facilitated workshops, mapping, and drop-in sessions to social media engagement, posters, and questionnaires. Just over half of the projects (10) included collaboration with a local school or college.
Focus on inclusion
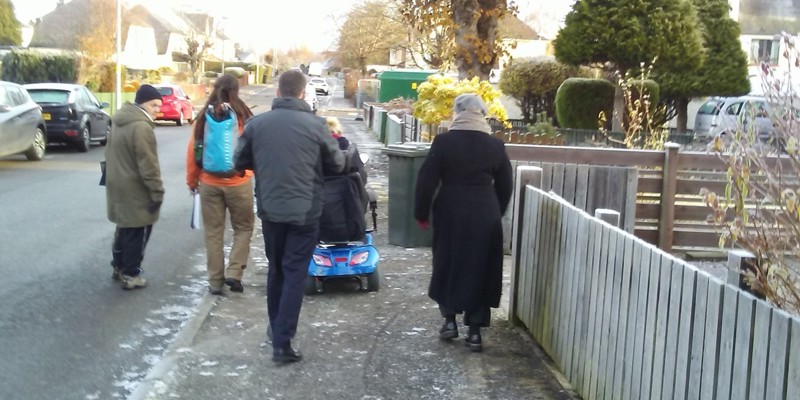
All projects had a stated inclusion focus which ranged from meeting the walking needs of children to enabling walking for older people and Disabled people, including specific mobility needs such as the use of a mobility scooter, wheelchair, guide dog, sight cane, or pushchair. Six audits were conducted with children (38%), and six were conducted with Disabled people (38%). Two projects included older people (13%). However, in both cases, the inclusion of older people was through engagement and consultation separate from the audit walkabout. Nine audit processes included representatives of Disabled people, and/or older people and children, which included local parents or members of parent councils and officers from local or national Disability groups. Overall, the inclusion focus of the audits was strong, with fifteen projects (94%) engaging Disabled people, older people and children, and/or their representatives, in the audit walkabouts.
| No. | Settlement | Disabled people | Older people | Children | Representatives |
|---|---|---|---|---|---|
| 1 | Lossiemouth | n/a | n/a | Yes | n/a |
| 2 | Moniaive | n/a | n/a | Yes | n/a |
| 3 | Mount Florida, Glasgow | n/a | n/a | Yes | Parents |
| 4 | Dingwall | Yes (mobility scooter) | n/a | Yes | n/a |
| 5 | Inverurie | Yes (wheelchair user) | n/a | n/a | n/a |
| 6 | Pitlochry | Yes (visually impaired people) | Yes* | n/a | n/a |
| 7 | Crieff | n/a | n/a | n/a | Parents, school staff |
| 8 | The Gorbals, Glasgow | n/a | n/a | Yes | Parents, school staff |
| 9 | Torry, Aberdeen | n/a | n/a | Yes | Parents, carers, school staff |
| 10 | Cowgate, Edinburgh | Yes | n/a | n/a | Participant from the Edinburgh Access panel |
| 11 | Markinch, Fife | no direct inclusion participation | no direct inclusion participation | no direct inclusion participation | no direct inclusion participation |
| 12 | Glenrothes | n/a | n/a | n/a | Participant Glenrothes Youth Forum |
| 13 | Falkirk | Yes (motorised wheelchair users, visually impaired user with cane) | n/a | n/a | n/a |
| 14 | Daily | n/a | n/a | n/a | member of Dailly Primary School Parent Council, parent |
| 15 | Inverleith, Edinburgh | Yes (guide dog user) | n/a | n/a | Guide Dogs Scotland Community Officer |
| 16 | Banff | n/a | Yes* | n/a | Dementia Friendly Aberdeenshire* |
LEGEND:
*Indicates this was facilitated in pre- or post- walkabout engagement
Areas in number 11 highlight where there was no direct inclusion participation
Community identified recommendations
Each audit identified issues and then made recommendations for improvements along the route. The median number of community recommendations identified per audit was thirty-eight, with the lowest number of recommendations being fifteen and the highest 136 within one audit. Across all sixteen evaluations, a total of 732 recommendations were identified. Analysing these by broad category shows that the majority (59%) of recommendations are for walking infrastructure improvements, followed by crossings (11%) and improvements to the carriageway (11%). These broader categories reveal that the identified recommendations could typically fall across different services for the local authority partner.
| Recommendations by category | Quantity | % |
|---|---|---|
| Footway & assets | 431 | 59 |
| Crossings | 78 | 11 |
| Carriageway improvements | 78 | 11 |
| Cross-service collaboration | 55 | 8 |
| Maintenance | 51 | 7 |
| Active travel behaviour change | 39 | 5 |
| Total Measures | 732 | 100 |
The identified recommendations were classified into twenty different types, which demonstrates the highly variable nature of the recommendations. Exploring these in detail reveals that the most frequently identified recommendations were footway repairs (20%), followed by drop kerb and tactiles (13%), and footway improvements such as widening, new footpaths, or footpath extensions (8%). New crossings, including signalised (4%), informal crossings such as zebra crossings and traffic islands (5%), and continuous footways at side junctions (2%), were also important. All crossings combined made up 11% of the recommendations. The overall scale of the recommendations is small and can be defined as minor measures.
| Category | Recommendation type | Quantity | % |
|---|---|---|---|
| Footway & assets | Place quality | 20 | 3 |
| Footway & assets | Footway quality & repair* | 143 | 20 |
| Footway & assets | Footway connectivity and widening* | 62 | 8 |
| Footway & assets | Drop kerbs & tactile paving* | 97 | 13 |
| Footway & assets | Footway assets / benches | 37 | 5 |
| Footway & assets | Pedestrian Signage | 19 | 3 |
| Footway & assets | Decluttering | 53 | 7 |
| Crossings | Signalised crossings | 32 | 4 |
| Crossings | Informal crossings / non-signalised | 34 | 5 |
| Crossings | Side junctions | 12 | 2 |
| Carriageway | Road Signage | 20 | 3 |
| Carriageway | Road markings | 19 | 3 |
| Carriageway | Road layout | 18 | 2 |
| Carriageway | Parking | 19 | 3 |
| Cross-service collaboration | Enforcement & management | 51 | 7 |
| Cross-service collaboration | Bus routing | 4 | 1 |
| Maintenance | Footway maintenance | 40 | 5 |
| Maintenance | Drainage | 6 | 1 |
| Maintenance | Lighting | 5 | 1 |
| Active travel behaviour change | Travel plans & engagement | 39 | 5 |
| All categories | Total measures | 732 | 100 |
LEGEND:
*shows three most frequently identified community recommendations