Method of travel
Method of travel
Modal share of all journeys
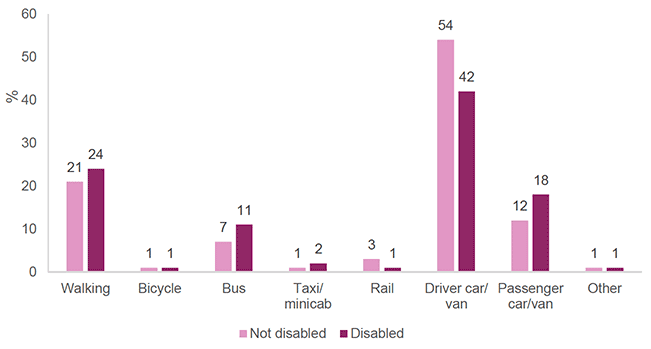
When disabled people are compared to those who are not disabled, they are less likely to drive (42% to 54%), and more likely to be a car or van passenger (18% to 12%), take the bus (11% to 7%), or walk (24% to 21%). [Figure 4]
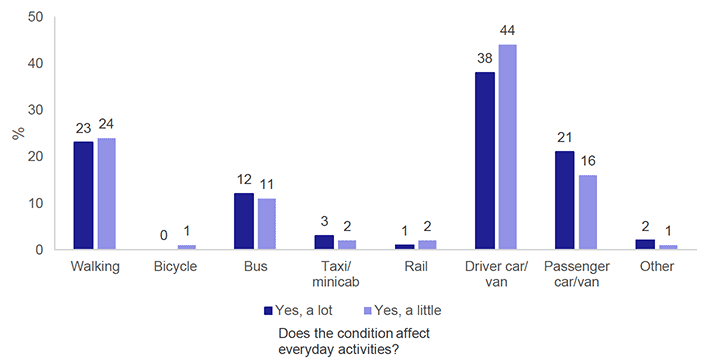
Those whose disability reduced their ability to carry out day-to-day activities were less likely to drive than those whose ability to carry out activities was reduced a little (38% compared to 44%), and more likely to be a passenger in a car (21% to 16%). Walking levels were similar (23% to 24%). [Figure 5]
Method of travel to work
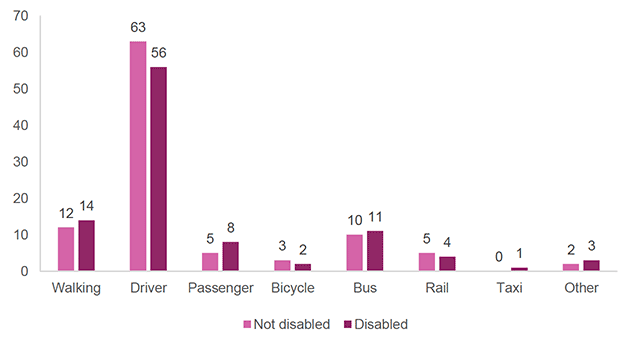
Fewer disabled people drove to work than non-disabled people (59% compared to 63%), and more were passengers in a car (8% to 5%). [Figure 6]
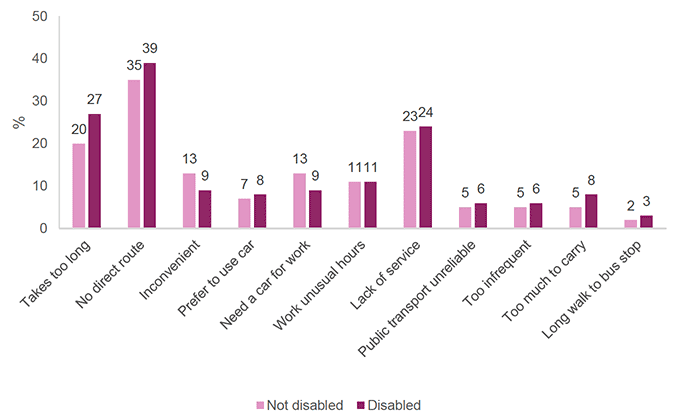
Reasons for not using public transport to work
Responses for disabled people and those who were not disabled were fairly similar. The most common reasons were 'no direct route' (39% for disabled people, and 35% for those not disabled), 'lack of service' (24% and 23%) and takes too long (27% an 20%). Numbers were very low for 'health reasons', 'uncomfortable' and 'difficult access' (not included on chart). [Figure 7]
Travel to school
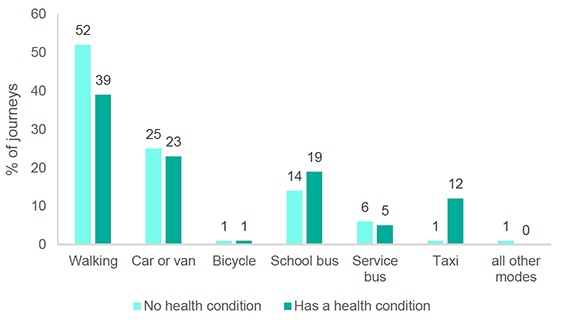
School children with a long-term condition are less likely to walk than those without a condition (39% compared to 52%). Those with a long term condition use a school bus more often (19% compared to 14%) and a taxi far more often (12% compared to 1%). [Figure 8]
