Car Travel
Driving Licence
Disabled people are less likely to possess a driving licence drive than those who are not disabled. (55% compared to 77%). [shown in Figure 19 below]
Those whose condition reduces their ability to carry out day to day activities a lot are less likely to have a licence than those whose condition affects activities a little (47% compared to 64%). [shown in Figure 19 below]
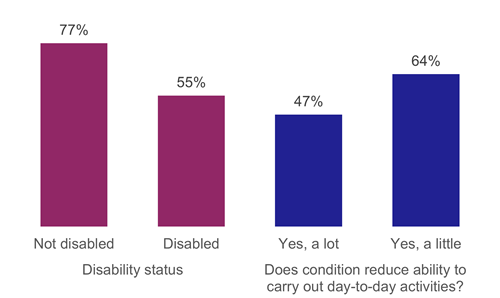
Figure 19: Driving licence possession, by whether adult is disabled and whether the condition limits their ability to carry out day-to-day tasks, 2017 to 2021 (combined)
There are fewer licence holders for disabled people with all particular conditions than for those not disabled. Driving licence ownership was particularly low for disabled people with speech impairment (20%), learning or behavioural problems (19%), and epilepsy (17%).
Household car access
Disabled people are less likely to have a car available to their household than non-disabled people (57% compared to 80%). [shown in Figure 20 below]
49% of those whose condition reduces their ability to carry out day-to-day tasks a lot have no access to a car, compared to 64% of those whose ability to carry out day-to-day tasks in affected a little. [shown in Figure 20 below]
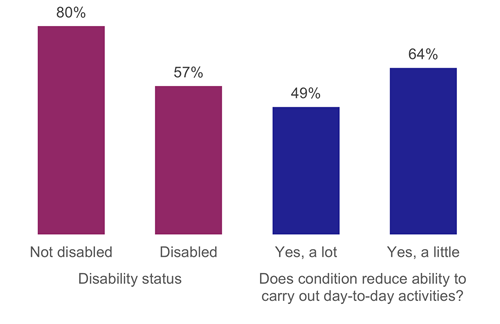
Figure 20: Household access to at least one car, by whether is disabled and whether their condition limits their ability to carry out day-to-day tasks, 2017-2021 (combined)
Age and income are likely to be factors in whether someone owns a car. But even when comparing only people in a household on a low income (in the lowest 30 per cent of incomes) and aged under 60, disabled people are still less likely to have access to a car (40%) than those not disabled (56%). [shown in Figure 21 below]
Those with a condition that affects day-to-day activities a lot on low household incomes are least likely to have access to a car (36%), compared to 45% of those whose day-to-day activities were affected a little. [shown in Figure 21 below]
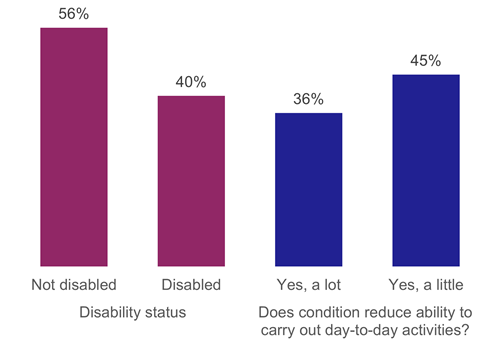
Figure 21: Household access to a car for adults aged under 60 in a low household income, by whether adult has disability and whether their condition limits their ability to carry out day-to-day tasks, 2017 to 2021 (combined)
Frequency of driving
People who are disabled are less likely to drive at least once a week than those who are not (45% compared to 71%). [shown in Figure 22 below]
Those whose condition reduces their ability to carry out day to day activities a lot are less likely to drive at least once a week than those whose disability only affects activities a little (35% compared to 56%). [shown in Figure 22 below]
For all categories of limiting health conditions, weekly driving is less frequent than for people without a limiting health condition. The least frequent drivers are disabled people with a speech impairment (12%), learning or behavioural difficulties (12%) and epilepsy (13%).
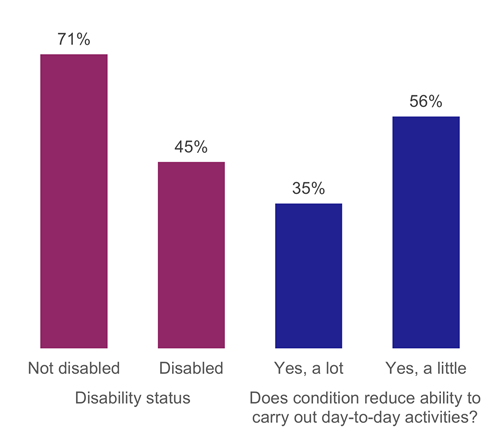
Figure 22: Percentage driving at least once a week, by whether adult is disabled and whether their condition limits their ability to carry out day-to-day tasks, 2017 to 2021 (combined)