Distance travelled
All journeys
Disabled adults had a shorter average (median) journey (3.2 km), than those who were not (4.4 km). [shown in Figure 14 below]
Those disabled people whose ability to carry out day-to-day activities was reduced a lot had a shorter median journey (2.8 km) than those whose ability to carry out activities was reduced a little (3.3 km). [shown in Figure 14 below]
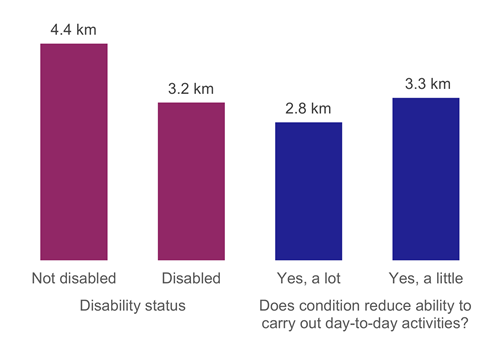
Figure 14: Average (median) journey length (km), by whether adult is disabled and whether their condition limits the ability to carry out day-to-day tasks, 2017-2021 (combined)
When only people not employed and aged under 60 are considered, journeys are still slightly shorter for disabled people than for non-disabled people (2.4 km compared to 2.9 km), Those whose condition affected day-to-day activities a lot travelled least far (2.3km). [shown in Figure 15]
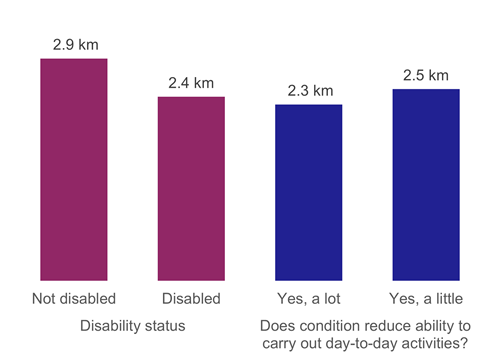
Figure 15: Average (median) journey length for adults not employed (either full- or part- time) and aged under 60, by whether adult is disabled and whether their condition limits their ability to carry out day-to-day tasks, 2017 to 2021 (combined)
Journey to work
Median distance to work was lower for disabled than non-disabled people (6.3 km and 7.8 km respectively). [shown in Figure 16]
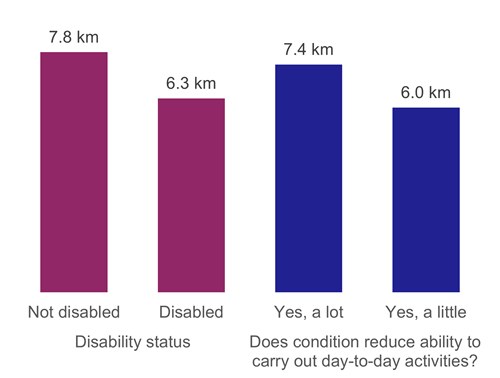
Figure 16: Average (median) length of journey to work (km), by whether adult is disabled and whether their condition limits their ability to carry out day-to-day tasks, 2017 to 2021 (combined)