Frequency of travel
The average (mean) number of journeys taken per day by disabled people (1.54) is less than that for people who are not disabled (1.96). Those whose condition reduces their ability to carry out day-to-day activities a lot have an even lower average number of journeys (1.25). [shown in Figure 12 below]
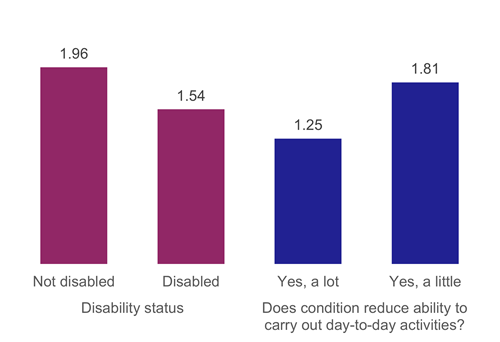
Figure 12: Mean number of journeys per day, by whether adult is disabled and whether their condition limits their ability to carry out day-to-day tasks, 2017 to 2021 (combined)
When only those working full-time are considered, differences are small (2.10 compared to 2.02 for those not disabled). [shown in Figure 13 below]
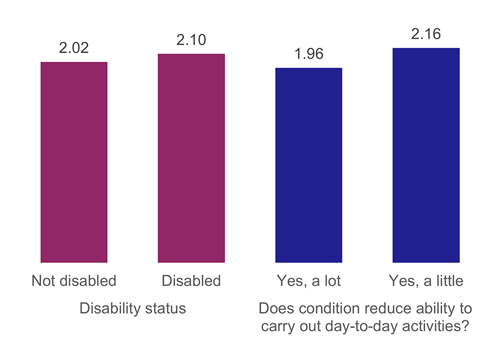
Figure 13: Mean number of journeys per day for full-time employees, by whether adult is disabled and whether their condition limits their ability to carry out day-to-day tasks, 2017 to 2021 (combined)