Method of travel
Modal share of all journeys
When disabled people are compared to those who are not disabled, they are less likely to drive (43% to 54%), and more likely to be a car or van passenger (17% to 11%), take the bus (9% to 6%), or walk (26% to 23%). [shown in Figure 4 below]
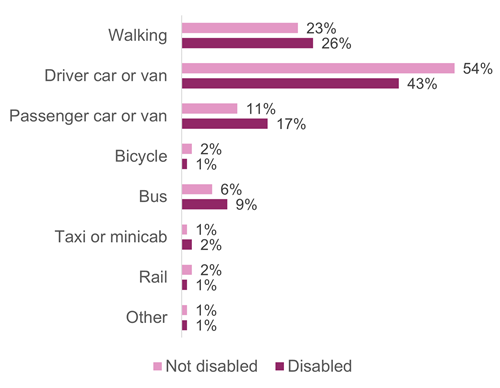
Figure 4: Main mode of travel (selected), by whether adult is disabled, 2017-2021 (combined)
Those whose disability reduced their ability to carry out day-to-day activities were less likely to drive than those whose ability to carry out activities was reduced a little (39% compared to 46%), and more likely to be a passenger in a car (21% to 14%). [shown in Figure 5 below]
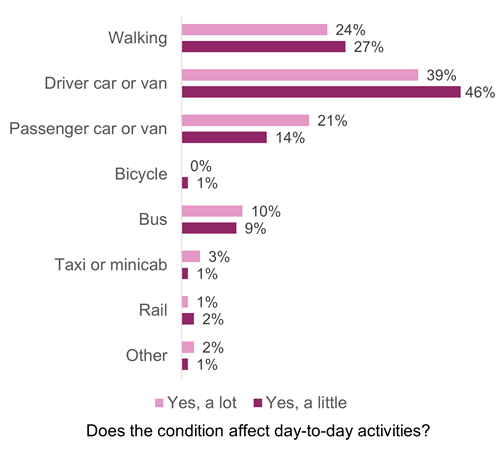
Figure 5: Main mode of travel for disabled people, by whether their condition limits their ability to carry out day-to-day tasks, 2017-2021 (combined)
Method of travel to work
Of those working, slightly fewer disabled people drove to work than non-disabled people (61% compared to 64%), and more were passengers in a car (7% to 4%). [shown in Figure 6 below]
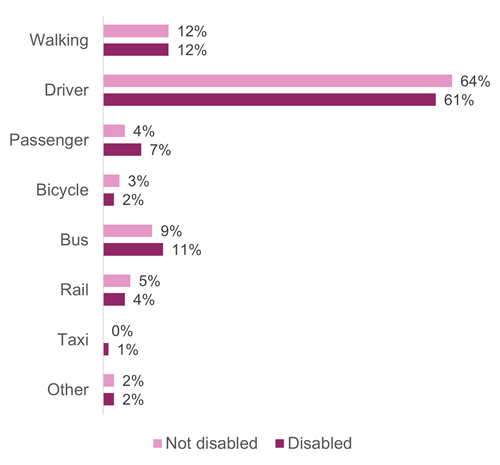
Figure 6: Method of travel to work, by whether adult is disabled, 2017 to 2021(combined)
Reasons for not using public transport to work
Responses for disabled people and those who were not disabled were fairly similar. The most common reasons were ‘no direct route’ (36% for disabled people, and 35% for those not disabled), ‘lack of service’ (25% and 21%) and takes too long (31% and 24%). [shown in Figure 7 below]
A small number of disabled people chose ‘health reasons’ (3%), ‘uncomfortable’ (3%) and ‘difficult access’ (2%). For people who were not disabled, these percentages rounded to zero. [shown in Figure 7 below]
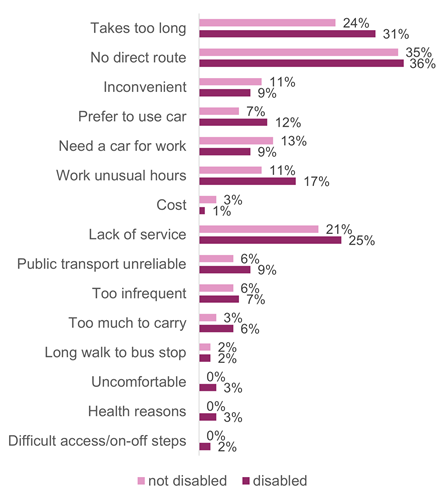
Figure 7: Reasons for not using public transport (selected), by whether adult is disabled, 2016, 2018 and 2020 (combined)
Travel to school
School children with a long-term health condition are less likely to walk than those without a condition (39% compared to 54%). Those with a long term condition use a school bus more often (20% compared to 14%) and a taxi far more often (12% compared to 1%). [shown in Figure 8 below]
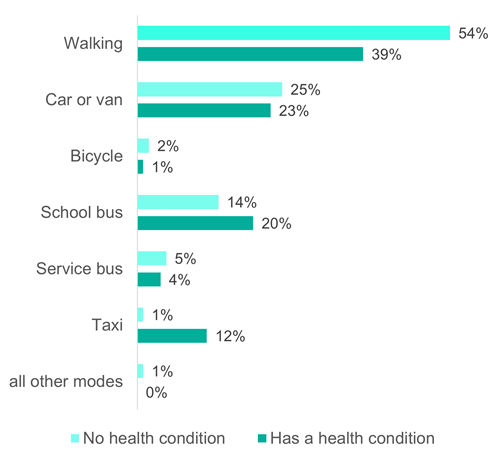
Figure 8: Method of travel to school (selected), by whether child has a long-term condition, 2017-2021 (combined)