Purpose of journey
A smaller percentage of the journeys of disabled people were to work (12%, compared to 24% for those who are not disabled) and greater percentage of the journeys of disabled people were to the shops (32% compared to 22%). [shown in Figure 9 below]
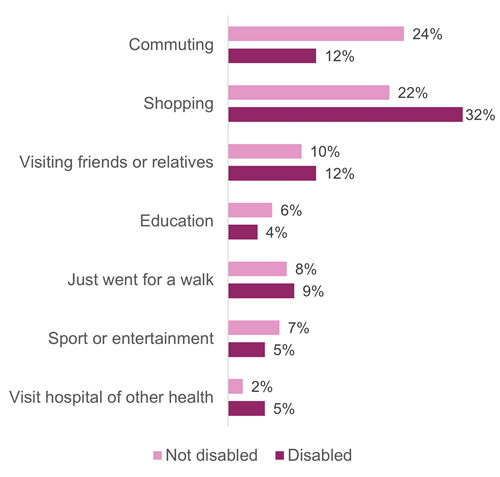
Figure 9: Purpose of journey (selected categories), by whether adult has a disability, 2017-2021 (combined)
For those whose disabilities reduced their ability to carry out day-to-day activities a lot, these discrepancies were greater (8% of journeys were to work and 35% to the shops), whereas those disabled people with a little difficulty carrying out day-to-day activities, these percentages were closer to those of people without a limiting condition (14% to work and 29% to the shops). [shown in Figure 10 below]
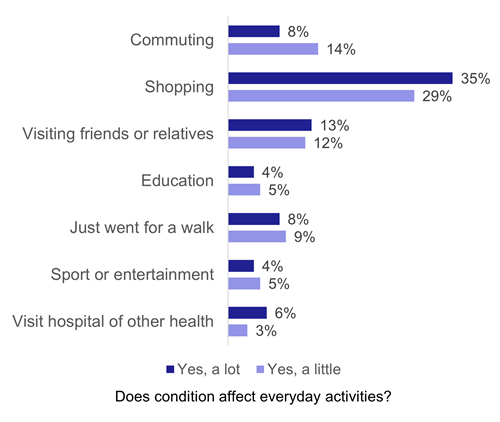
Figure 10: Purpose of journey (selected categories), by whether disabled adult’s condition limits their ability to carry out day-to-day tasks (2017-2021 combined)
When looking at only those in full-time work, there was greater similarity between disabled and non-disabled people. The percentage of journeys for commuting was 32% for disabled adults compared to 38% for non-disabled adults, and shopping was similar at 19% and 17%. [shown in Figure 11 below]
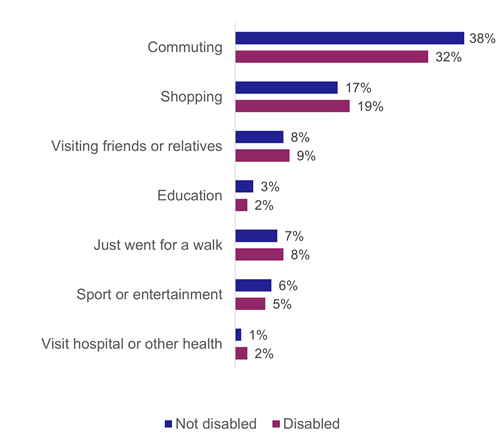
Figure 11: Purpose of journey (selected categories) for people in full-time work, by whether adult is disabled, 2017-2021 (combined)