Appendix A: Figures

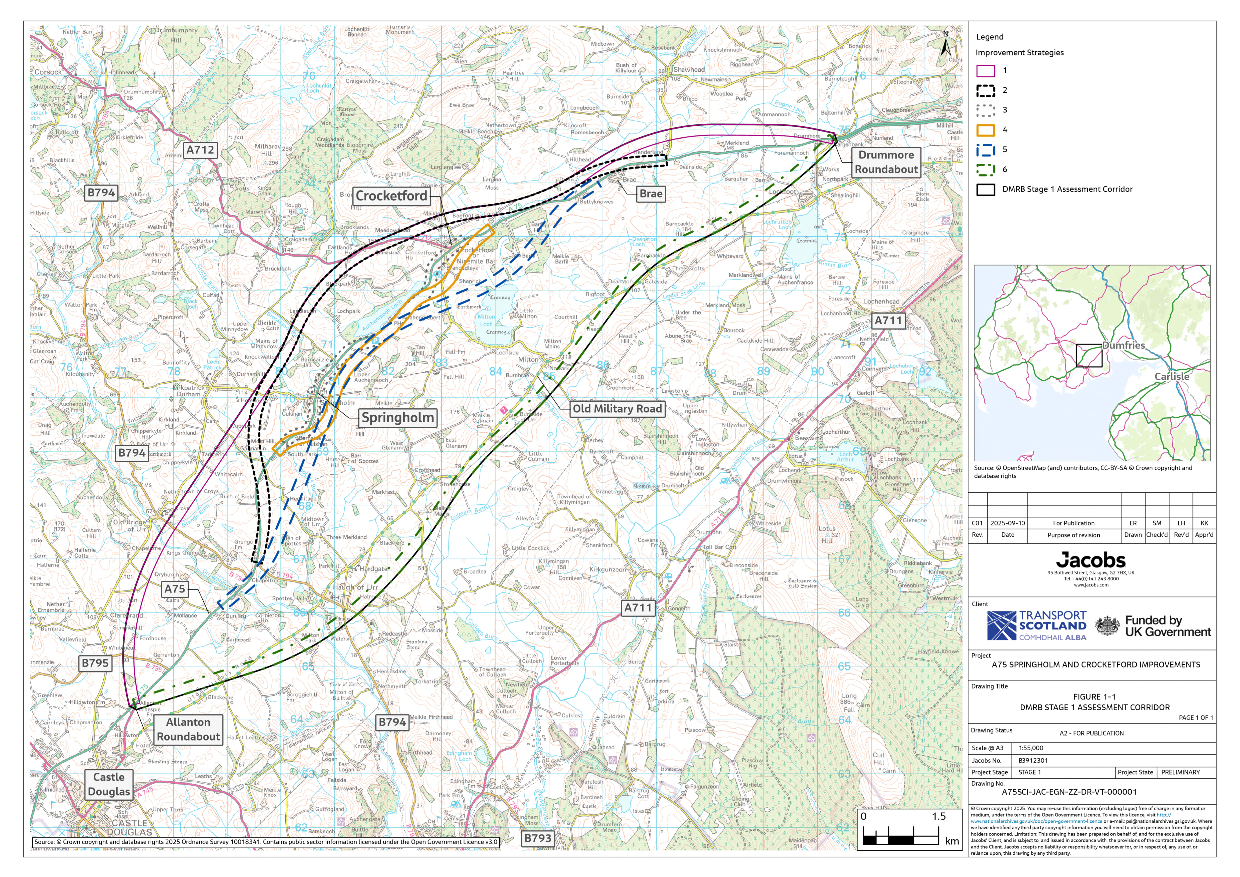
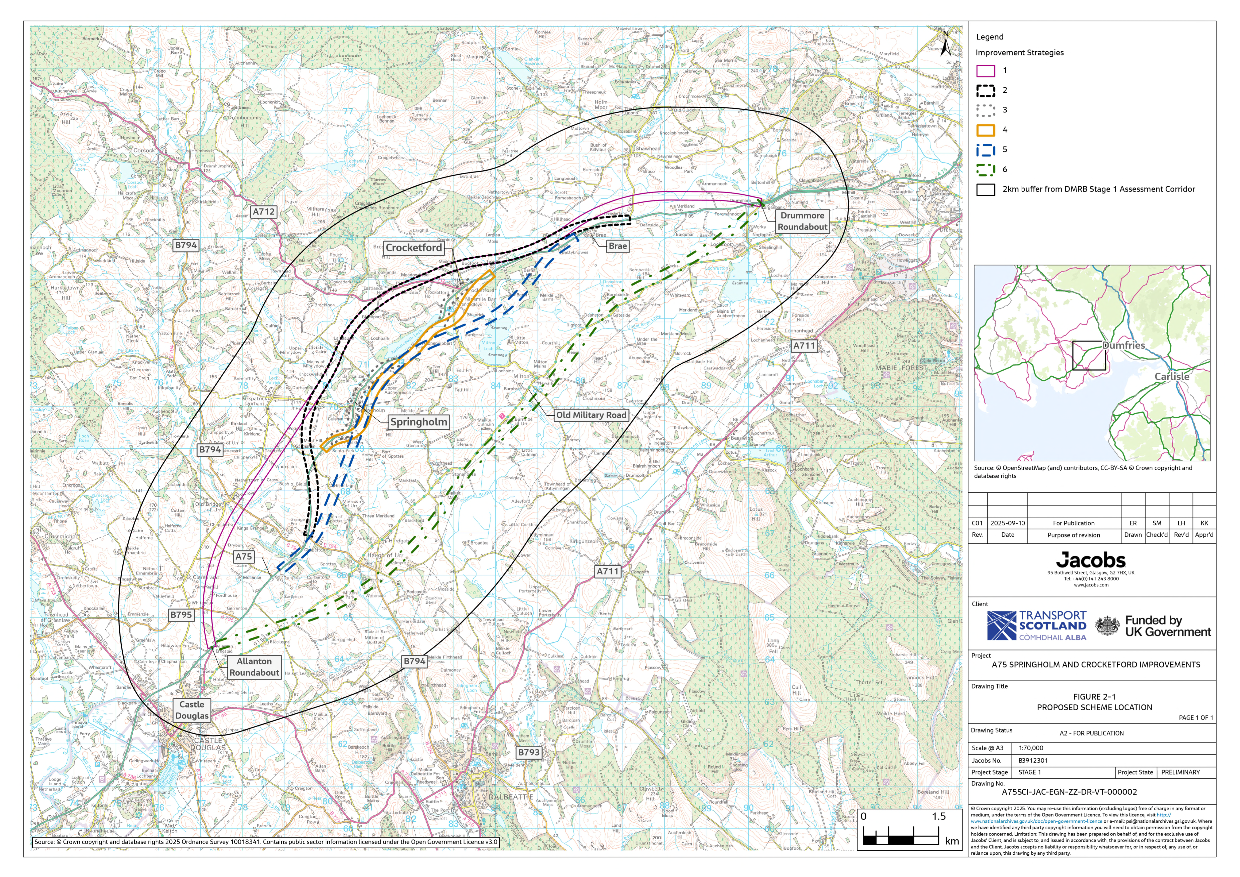
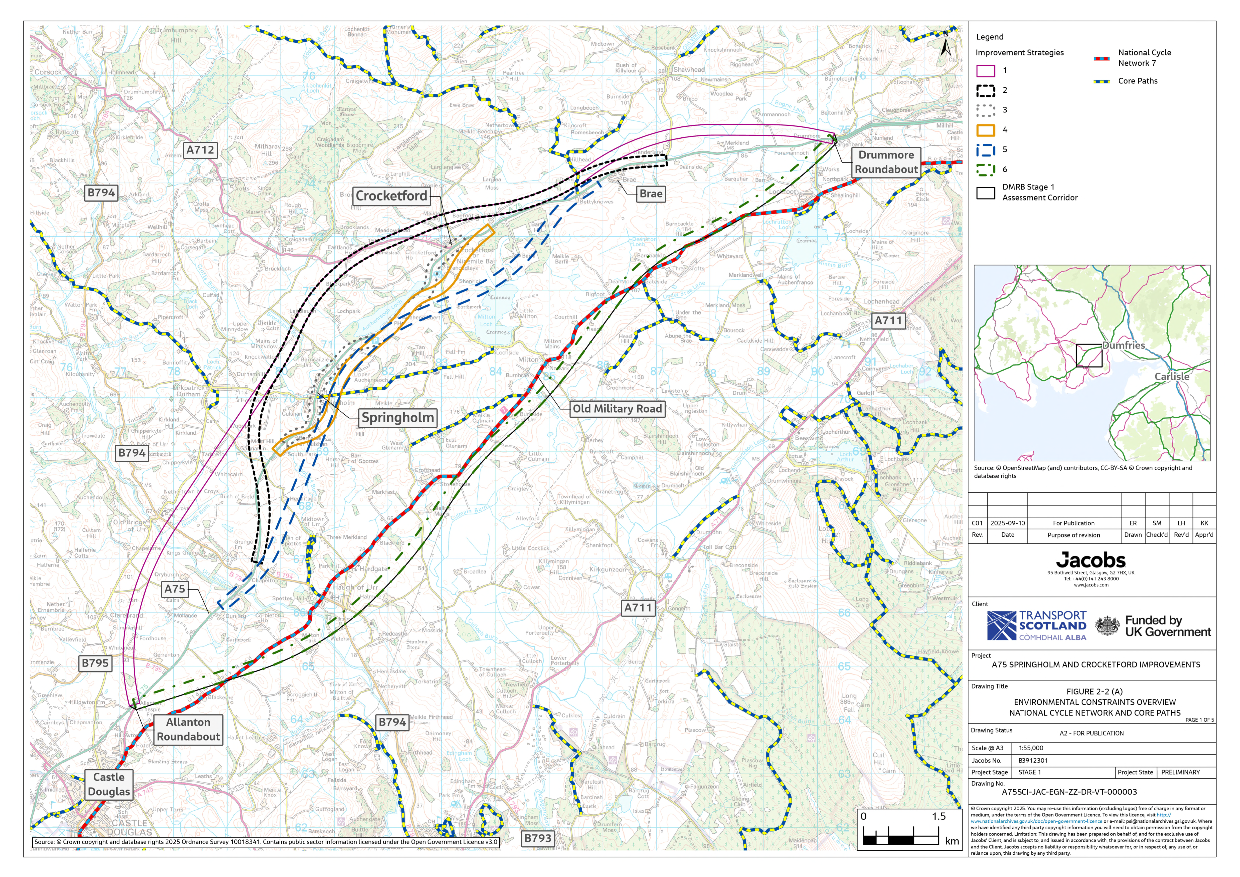
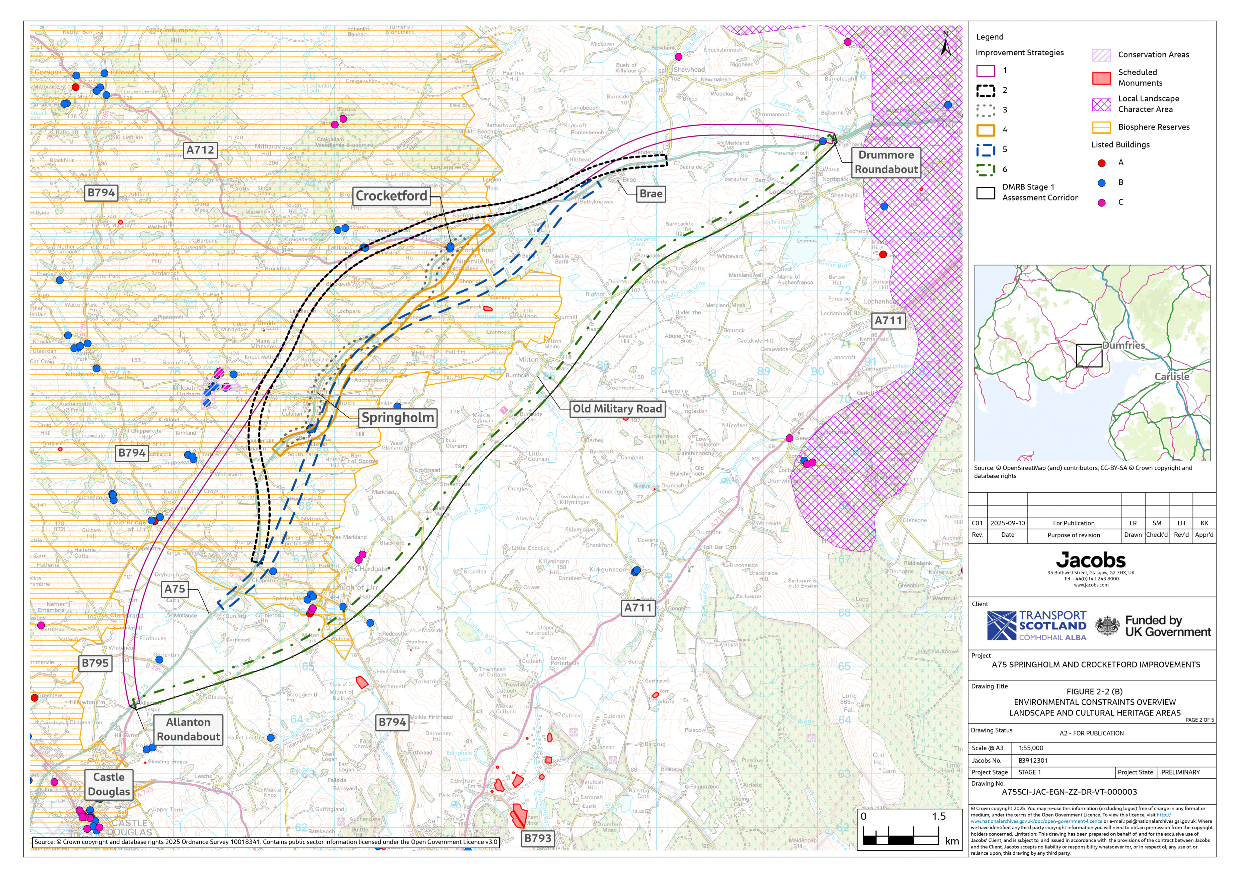
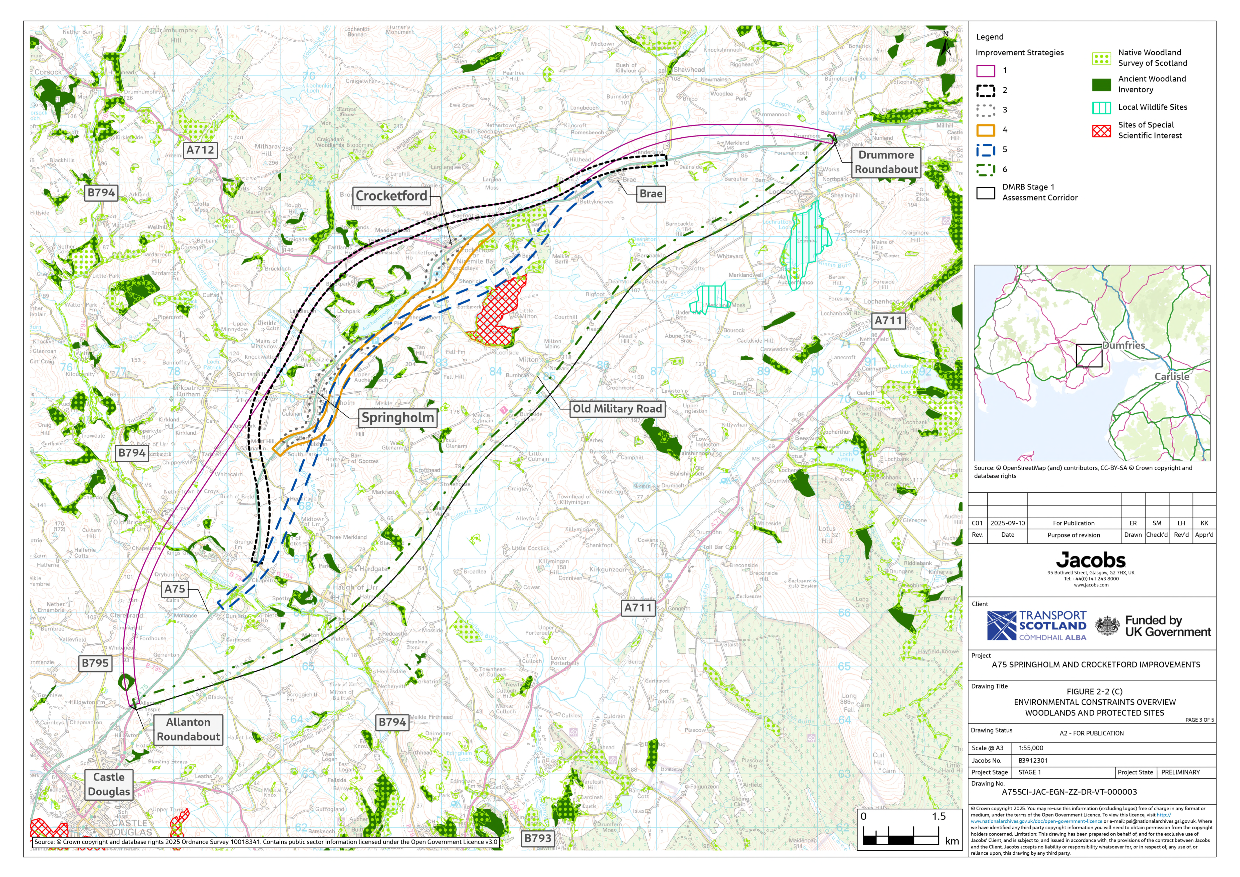
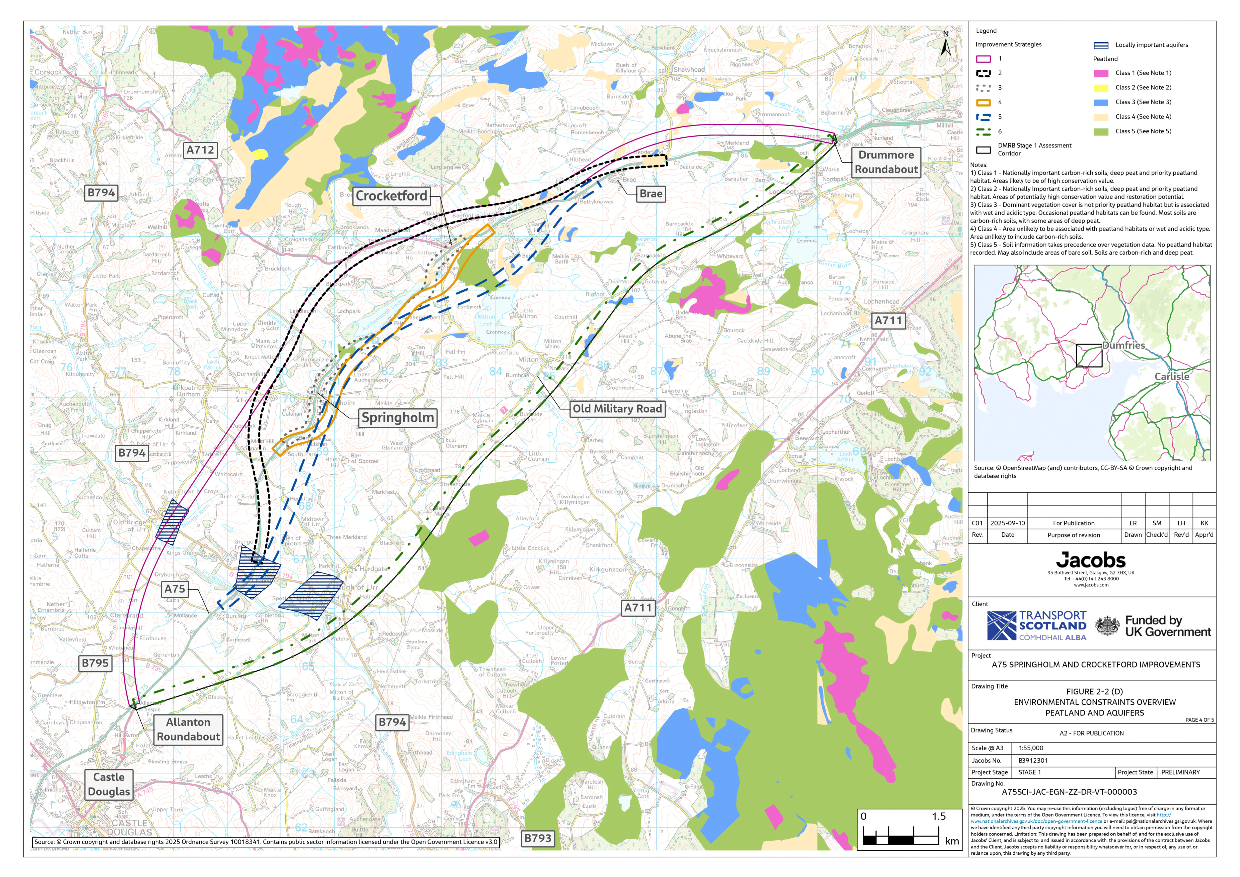
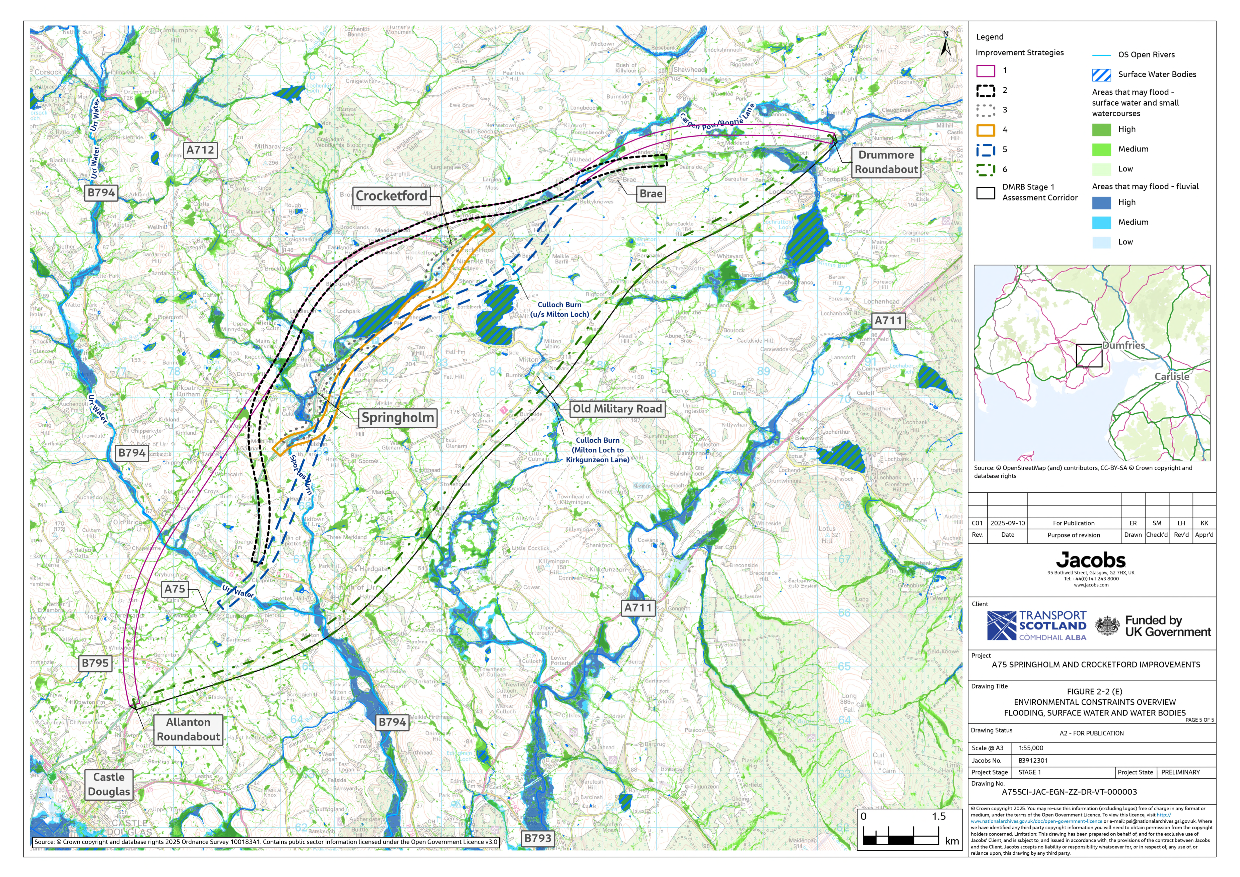
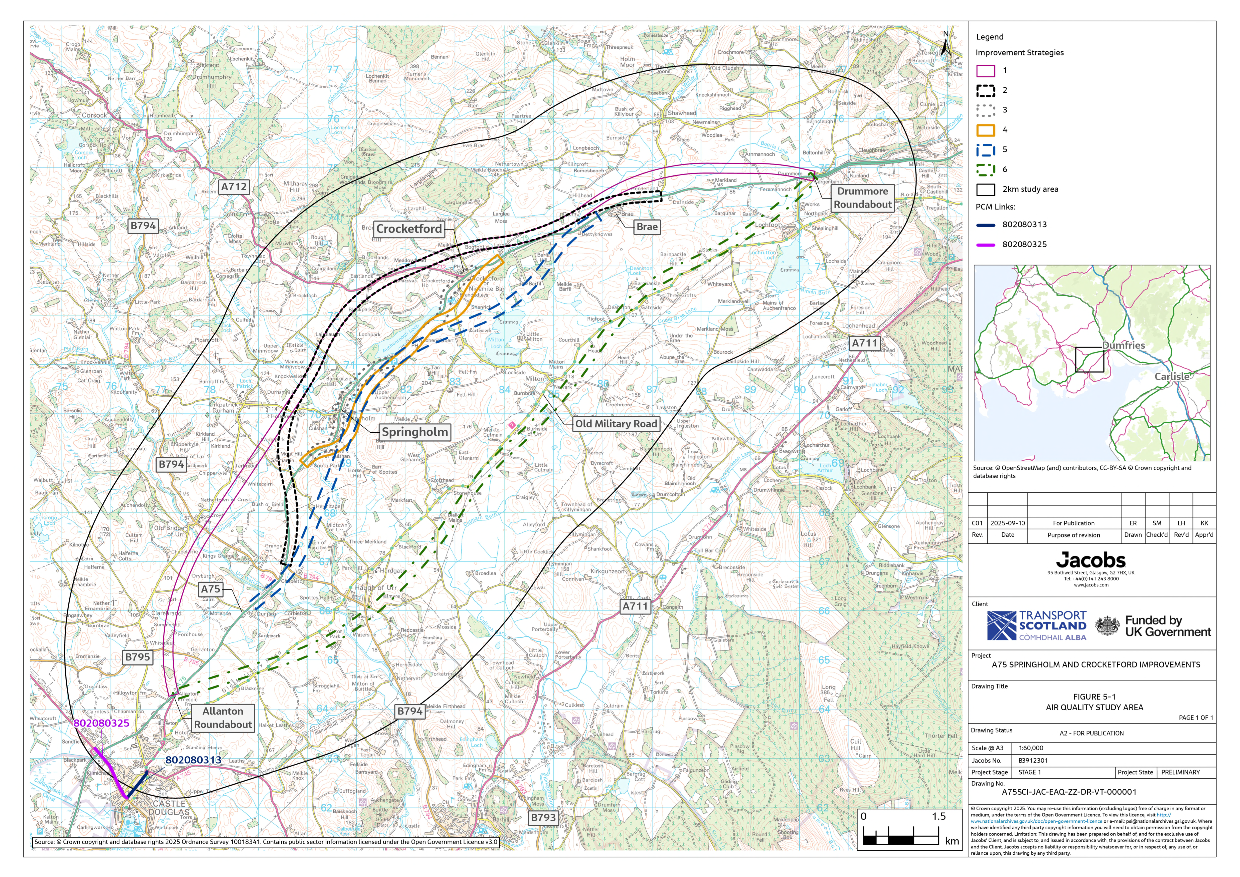
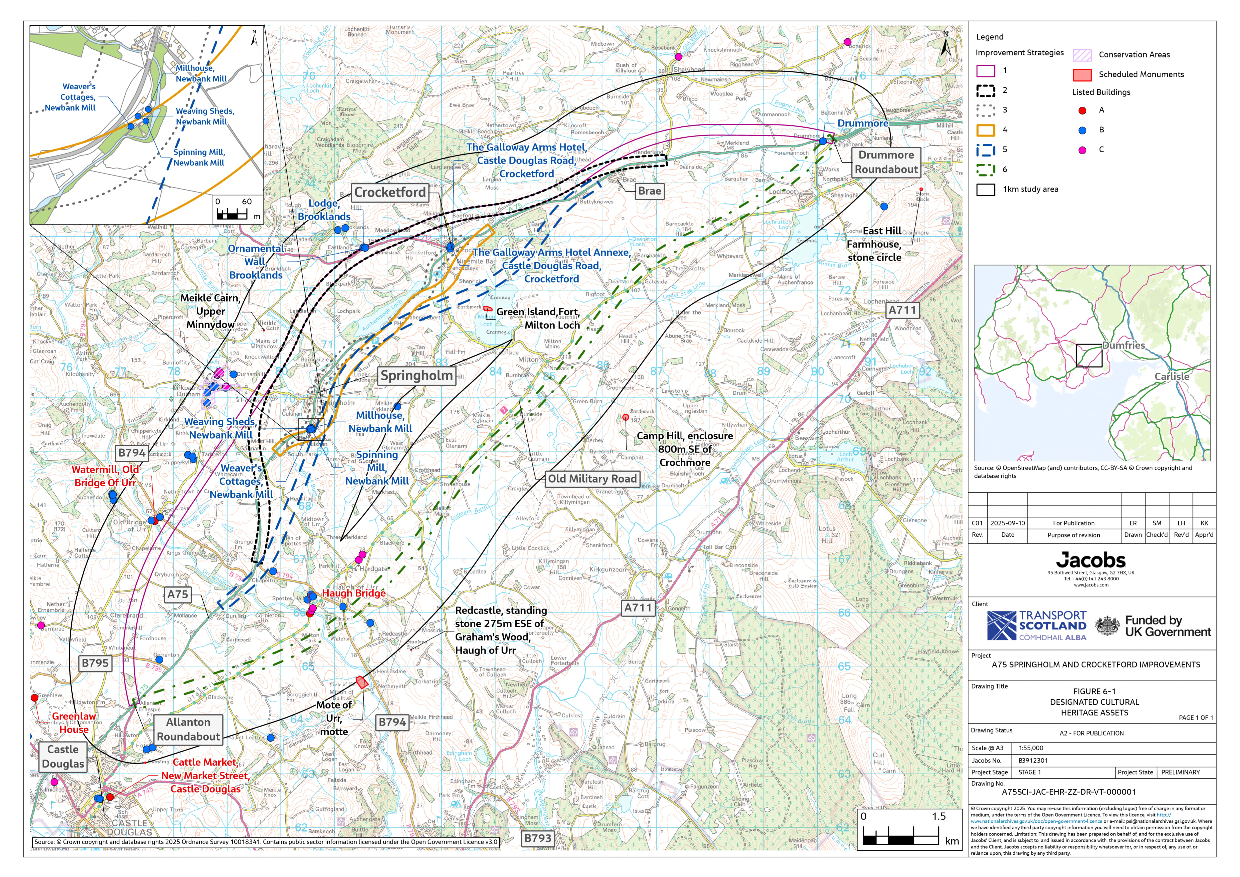
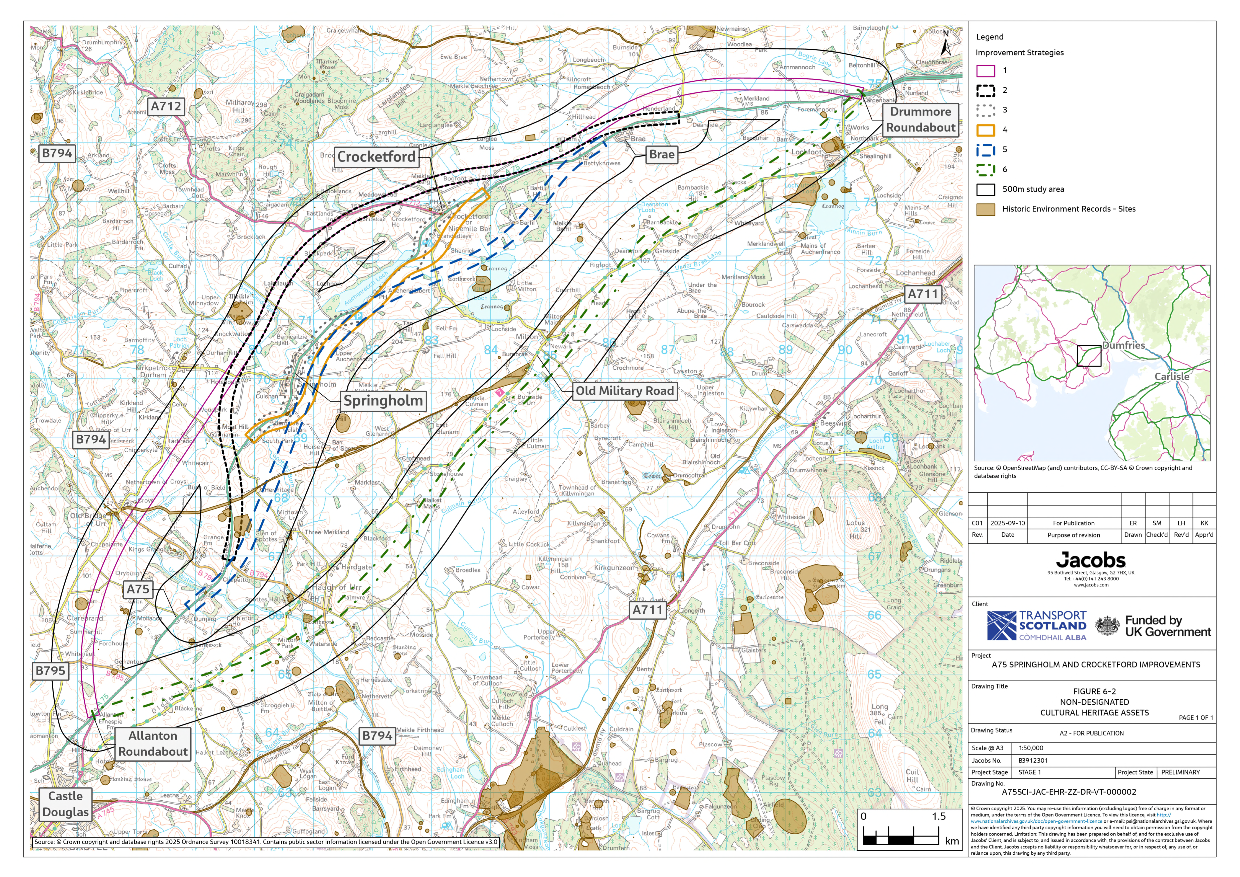
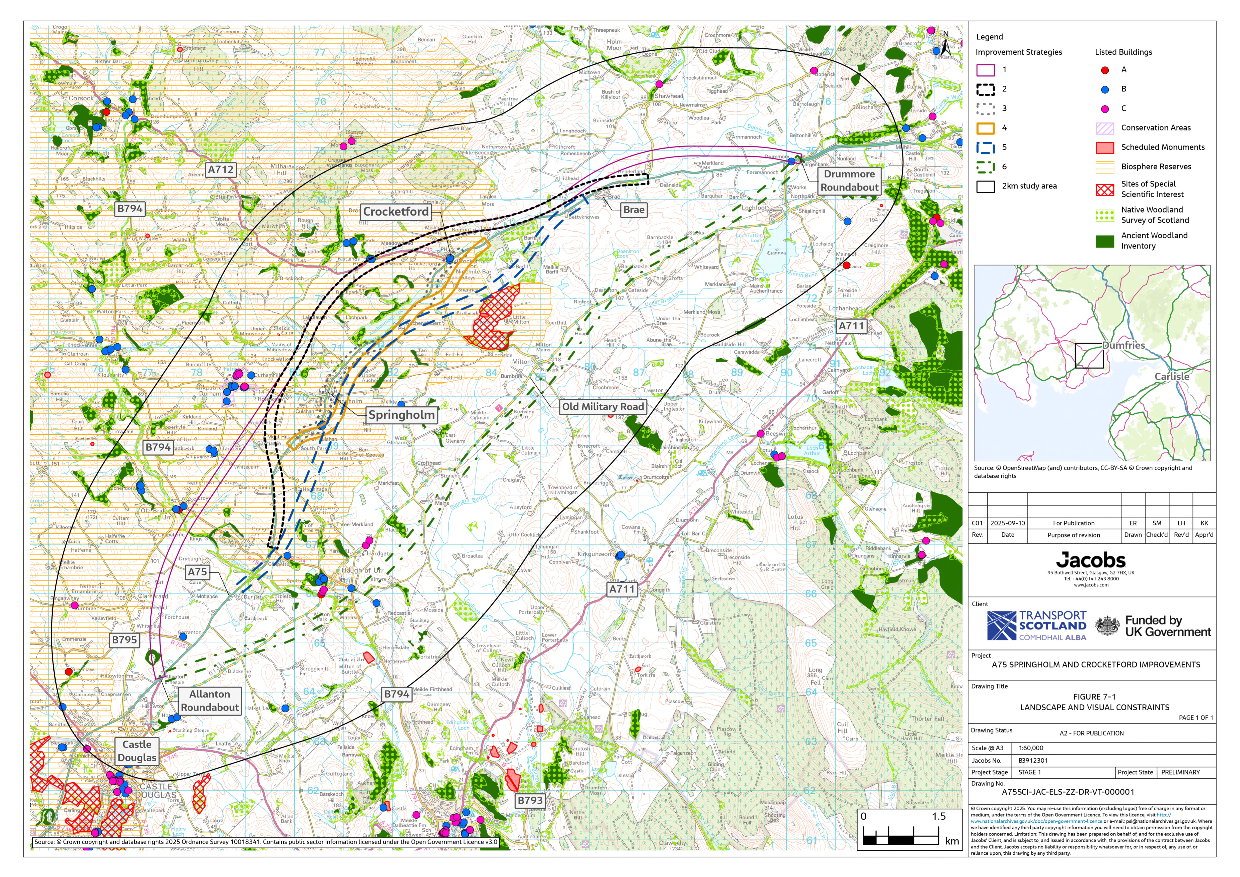
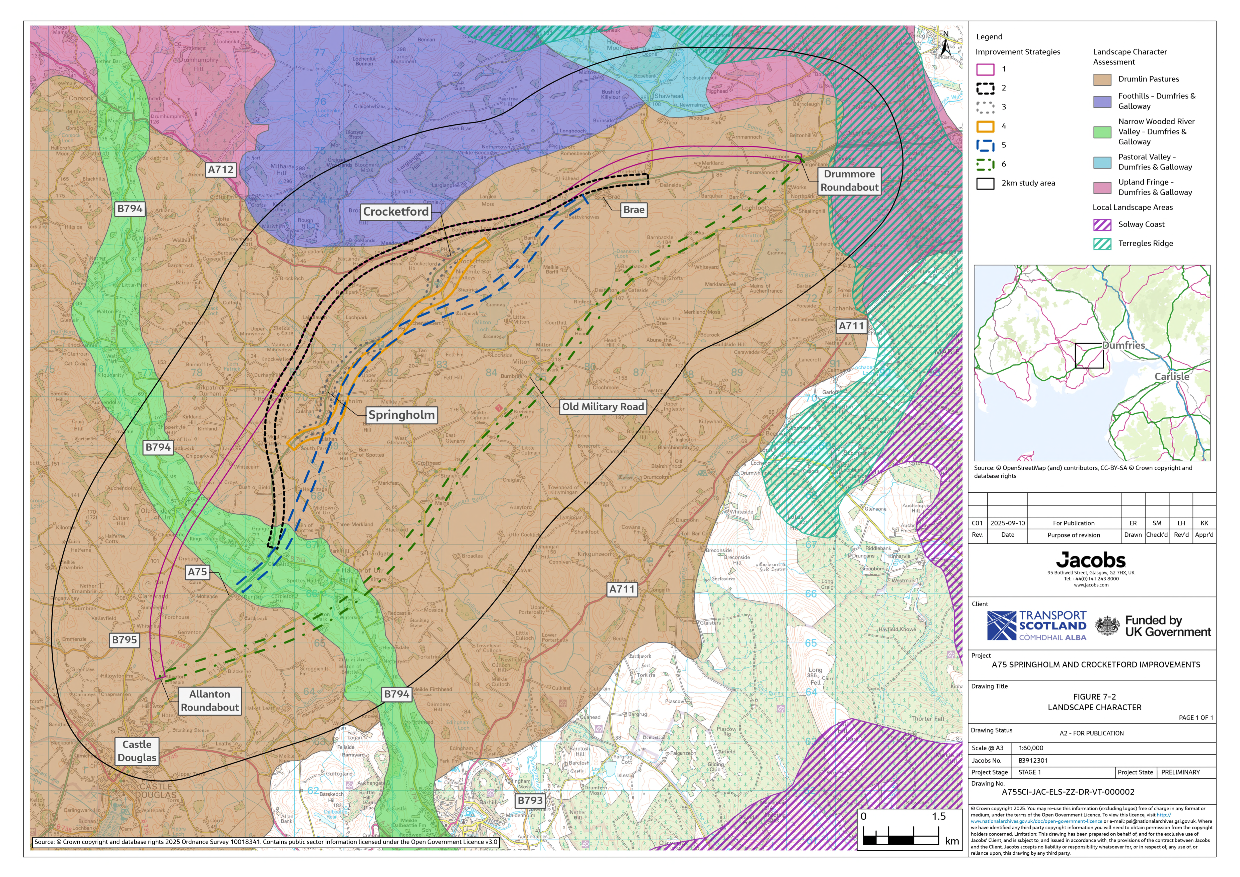
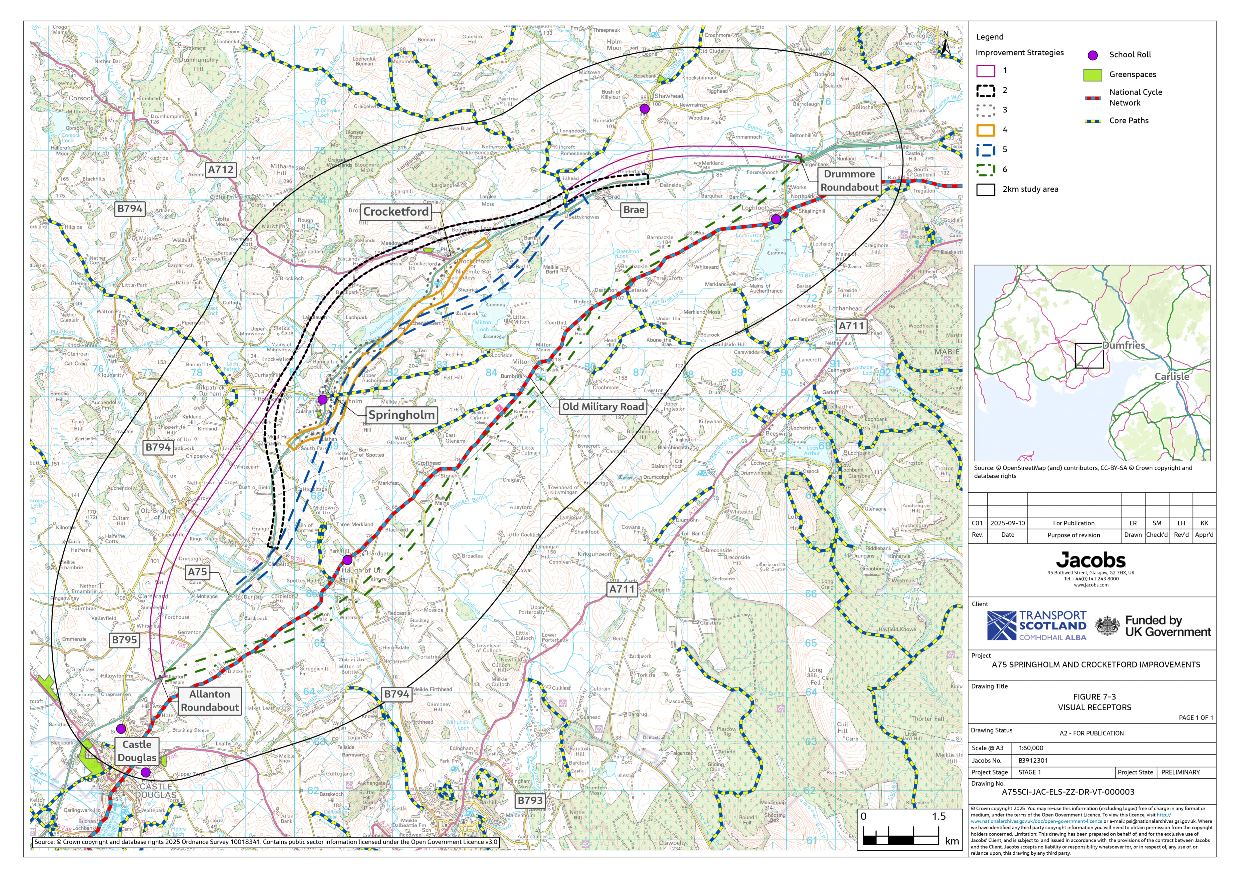
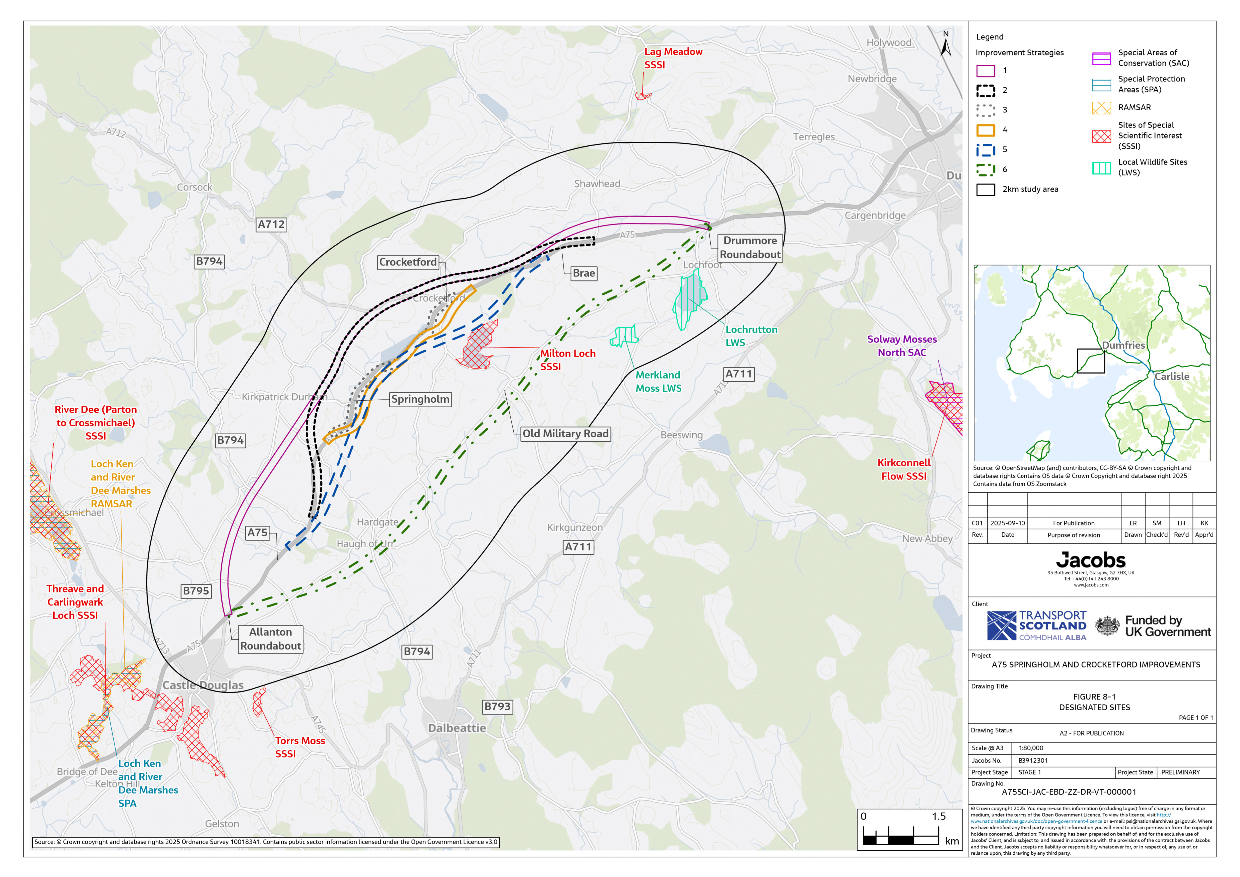
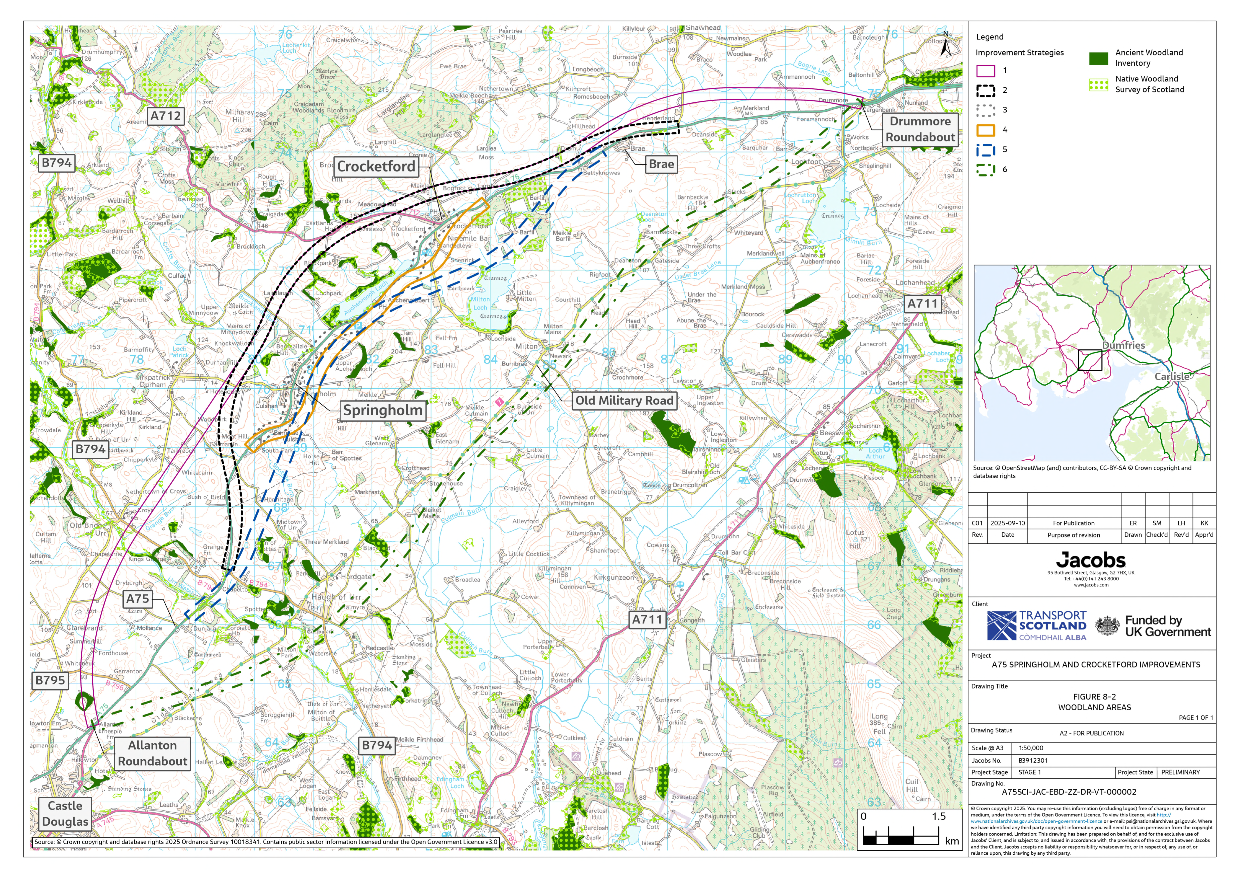
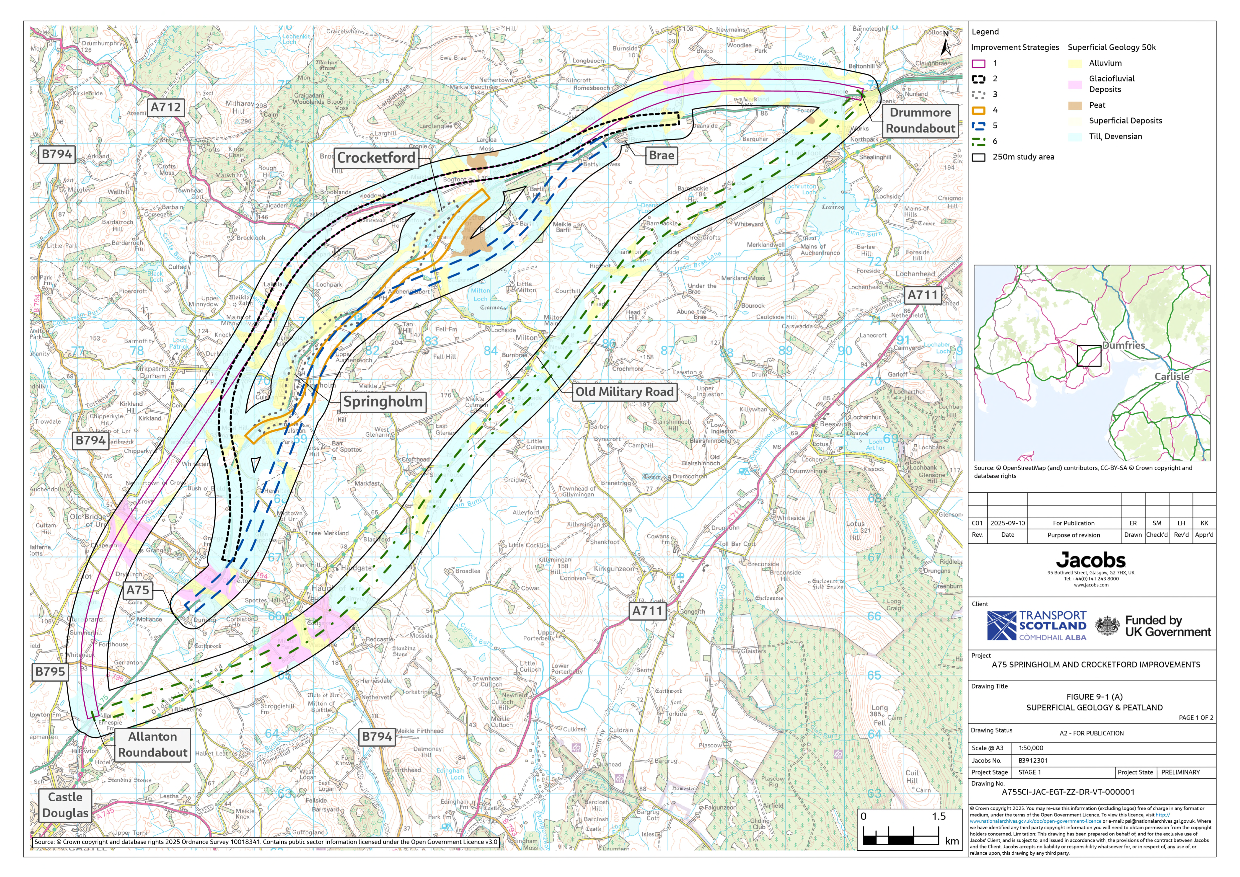
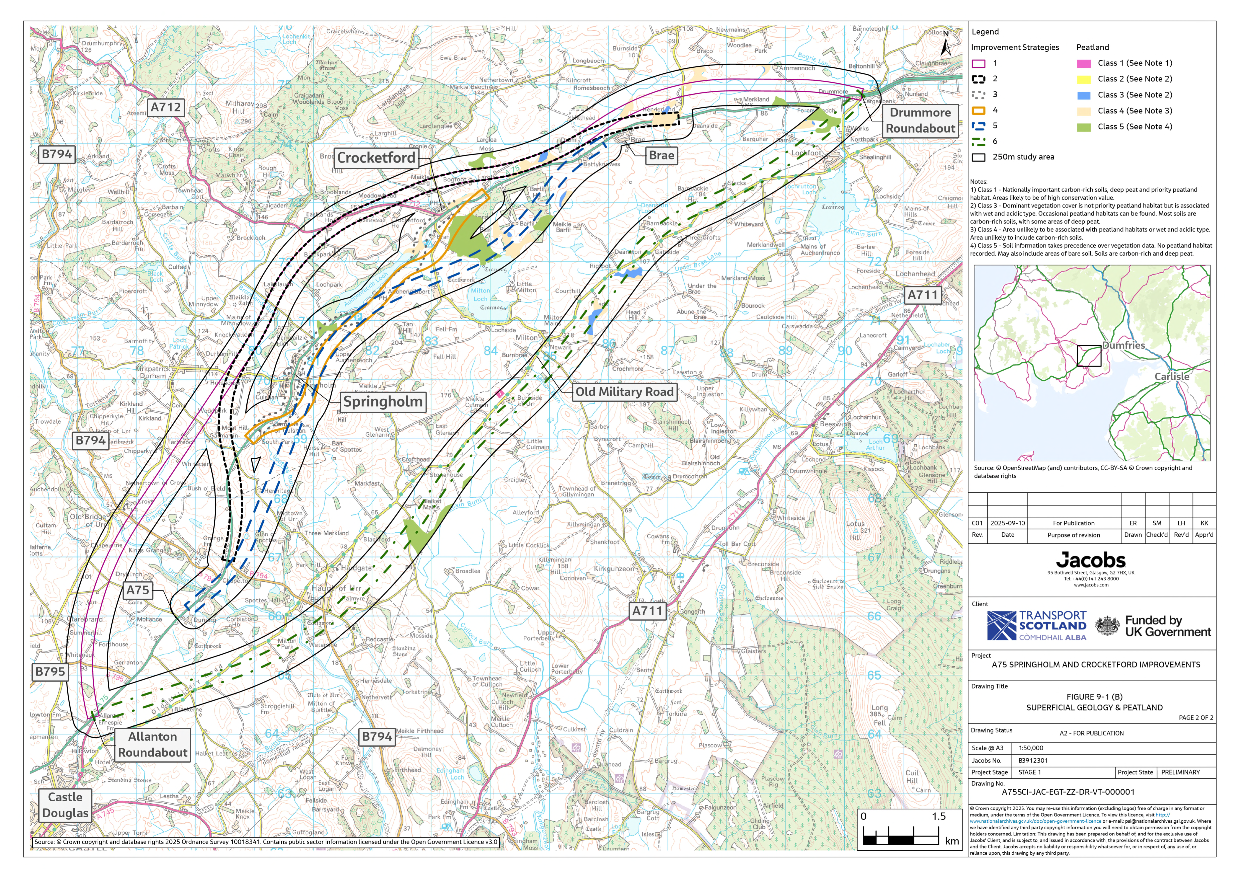
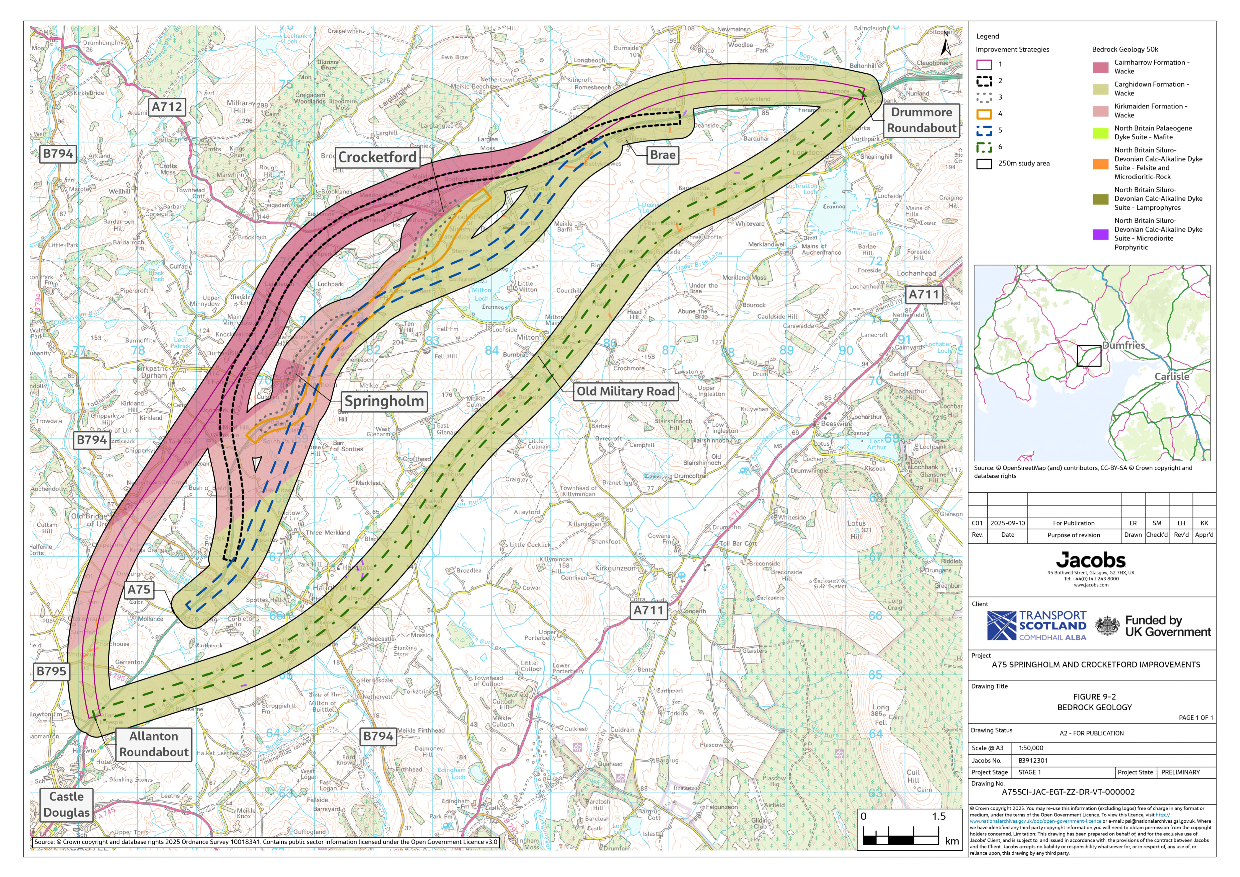
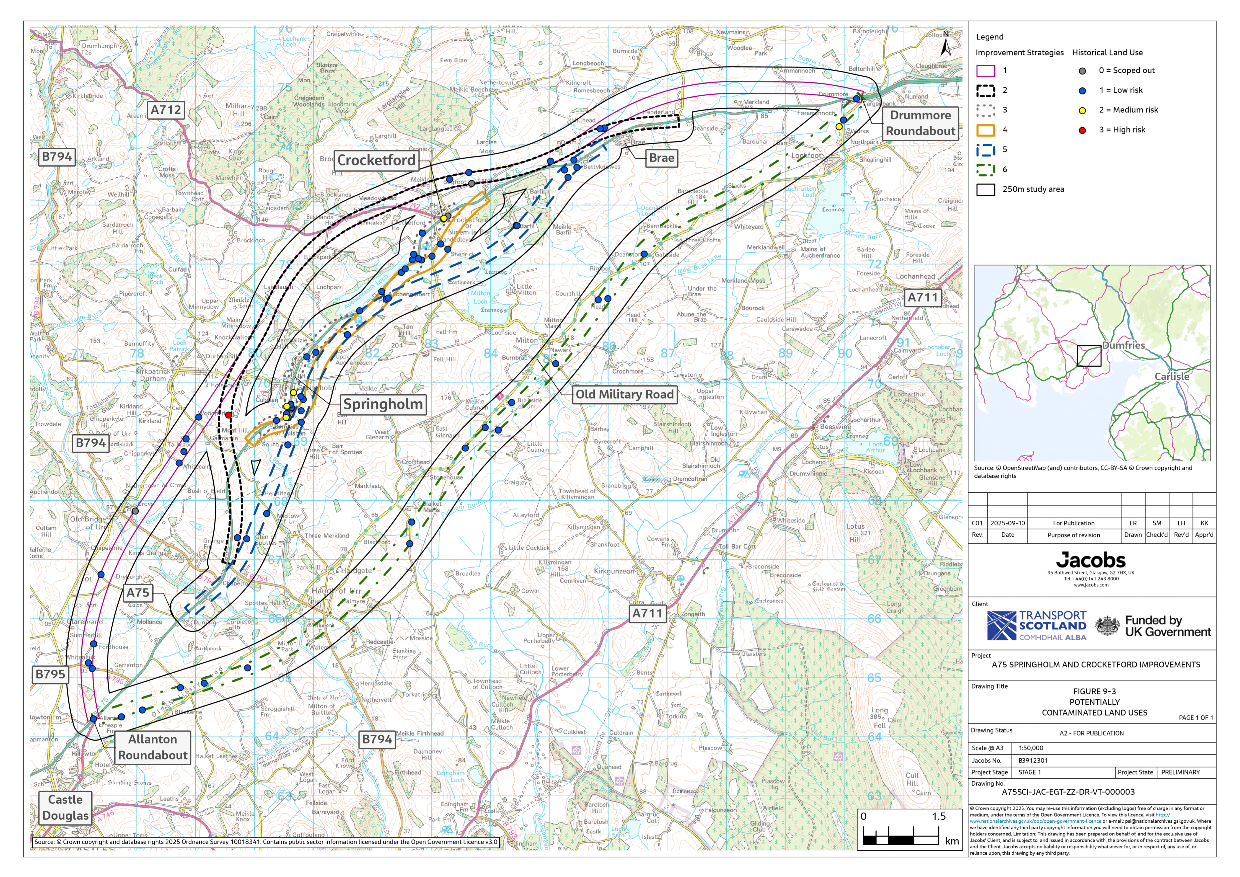
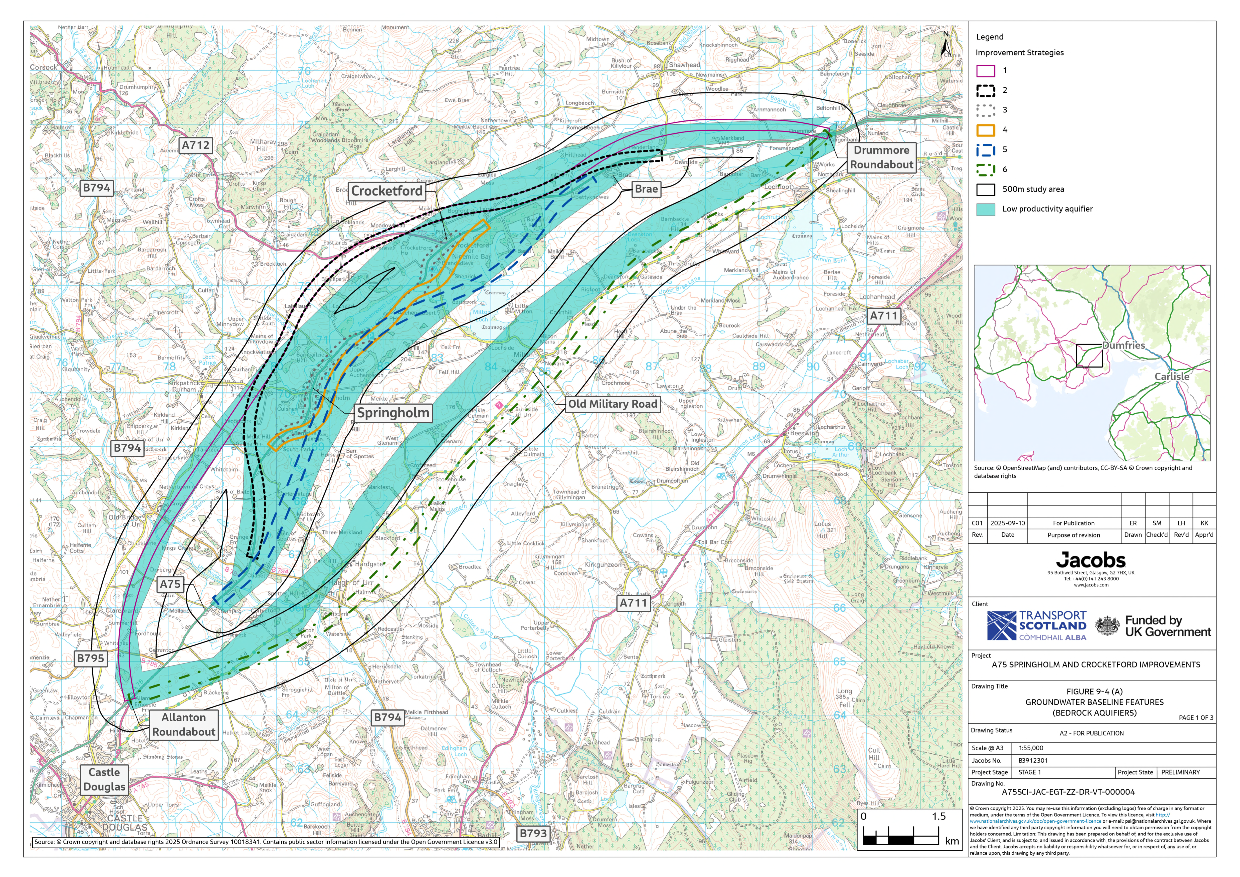
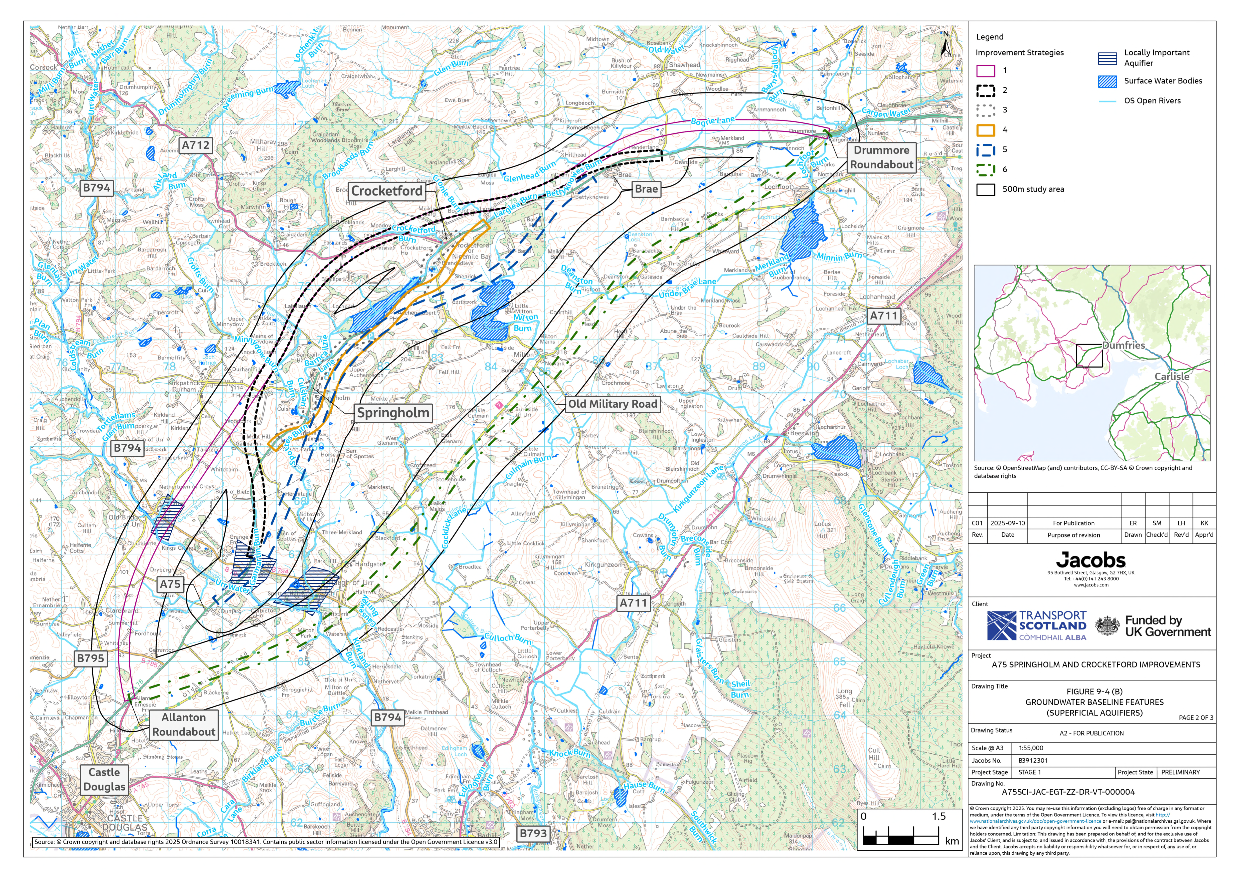
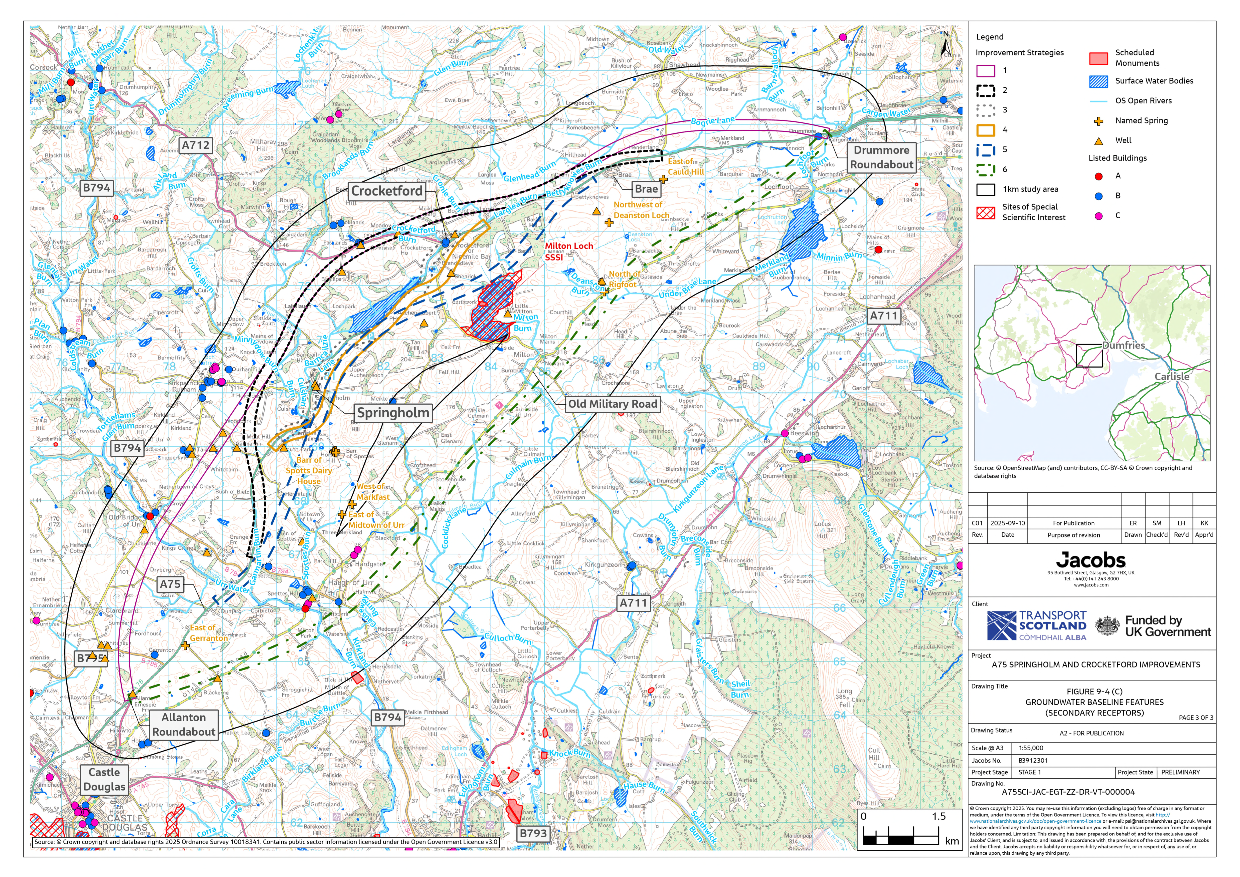
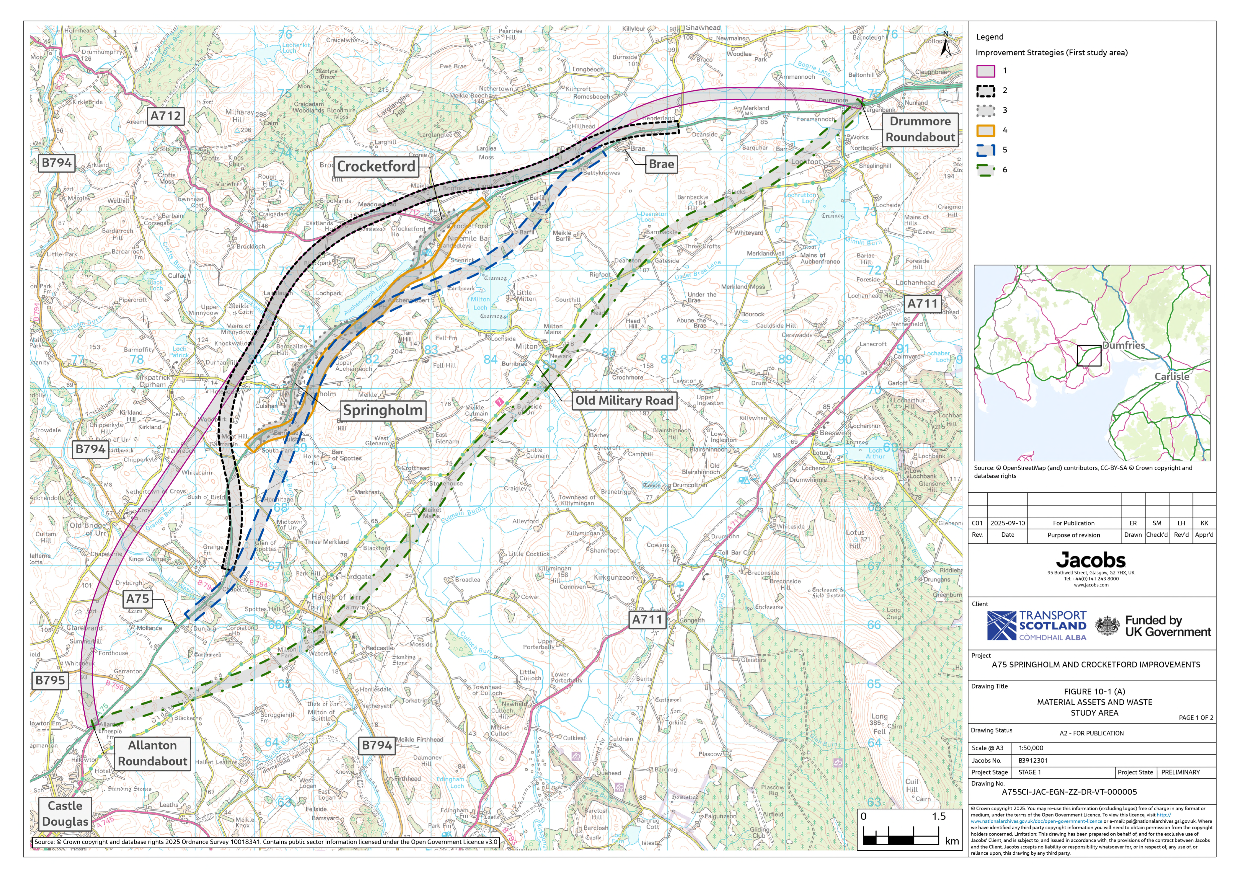
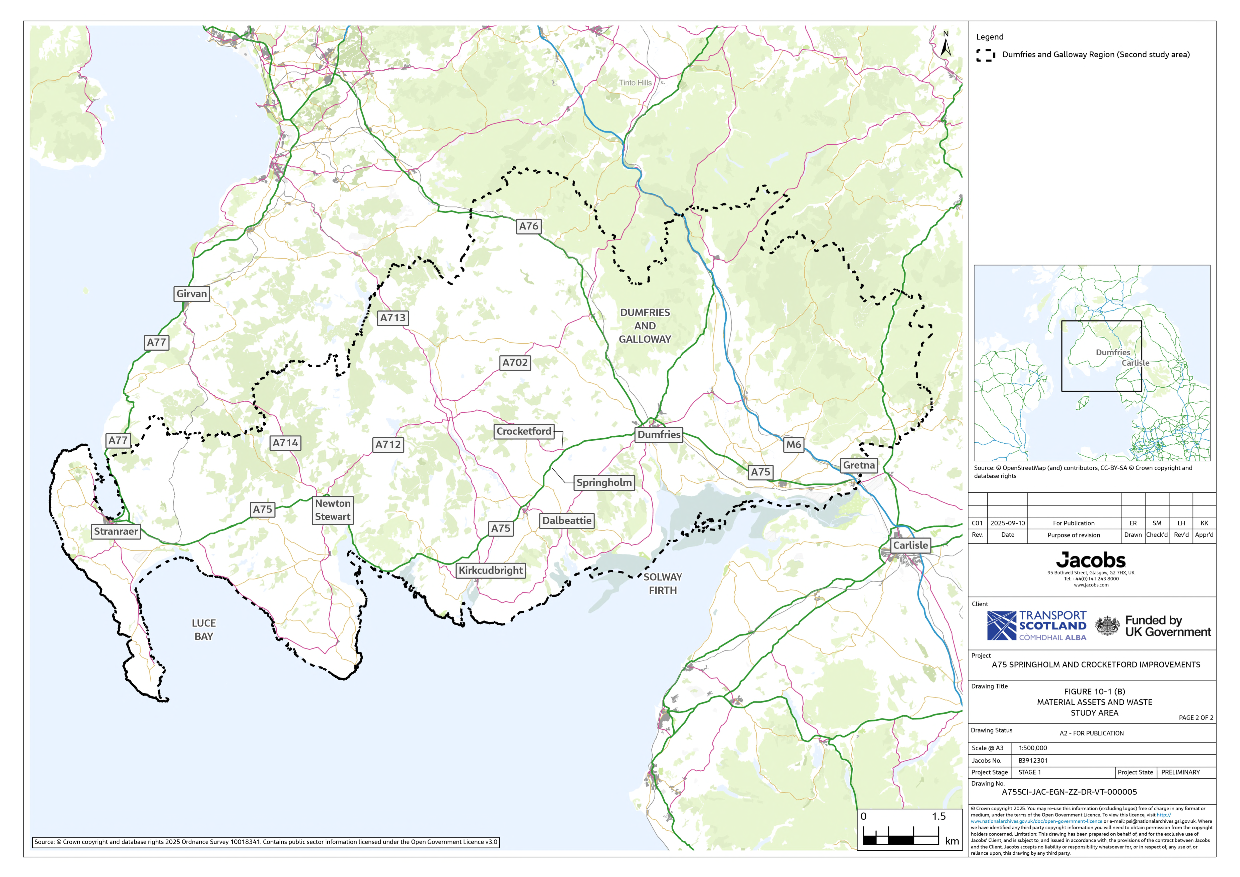
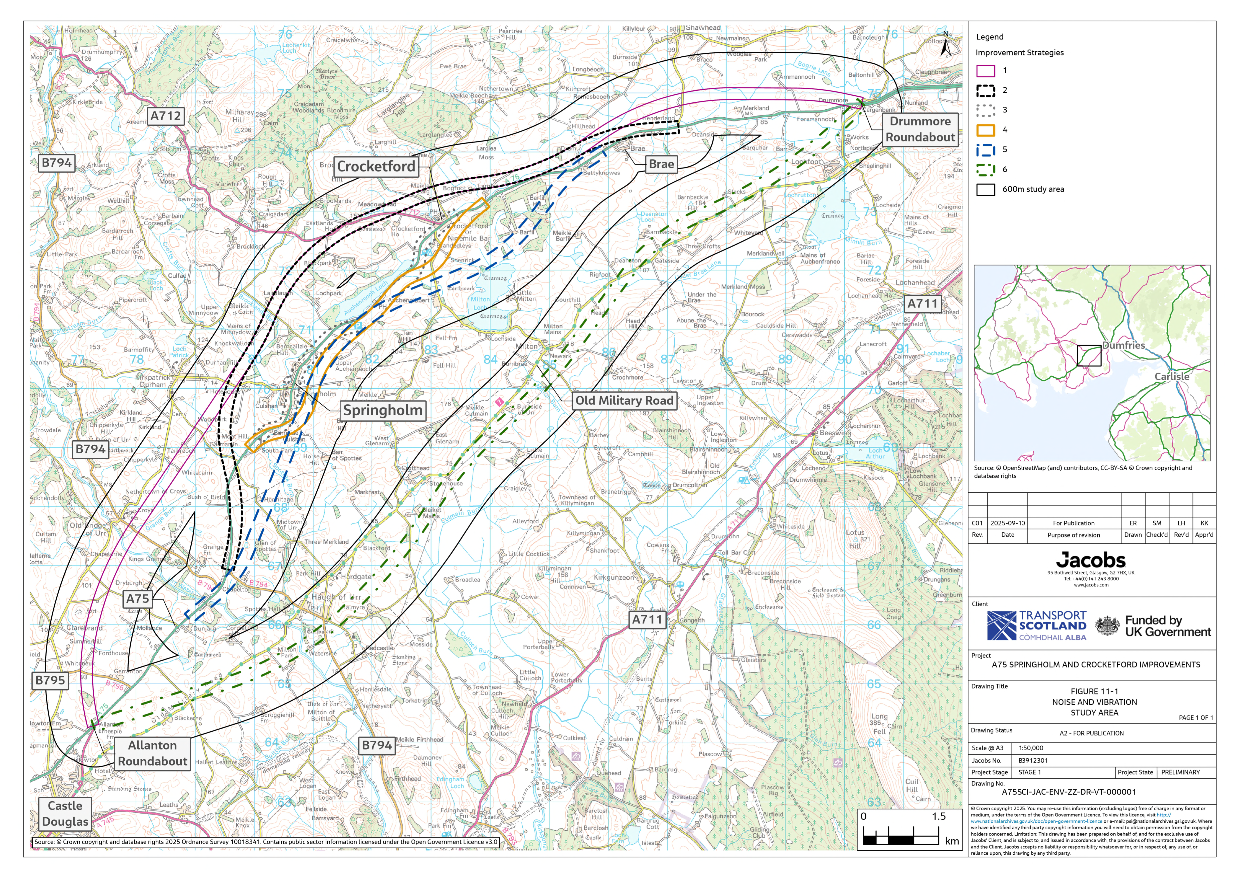
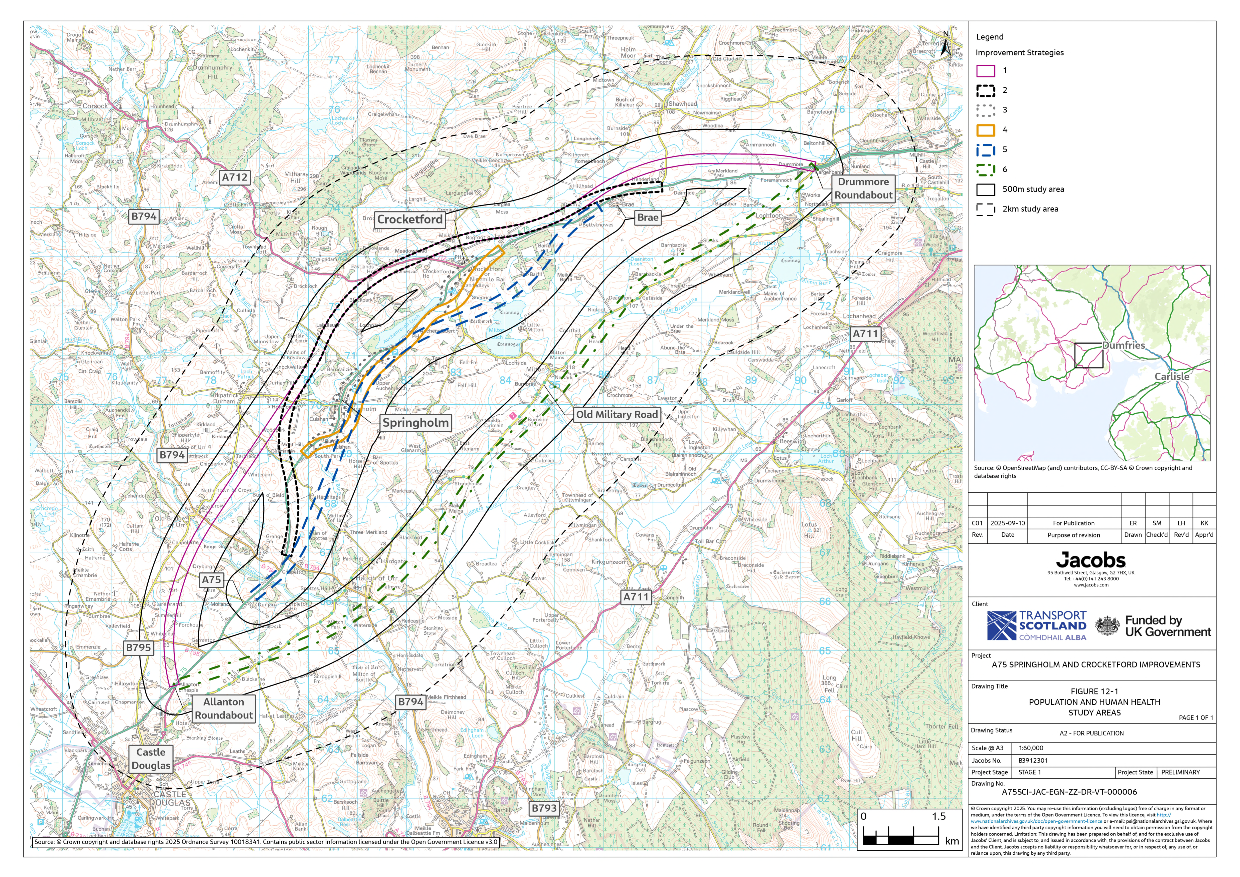
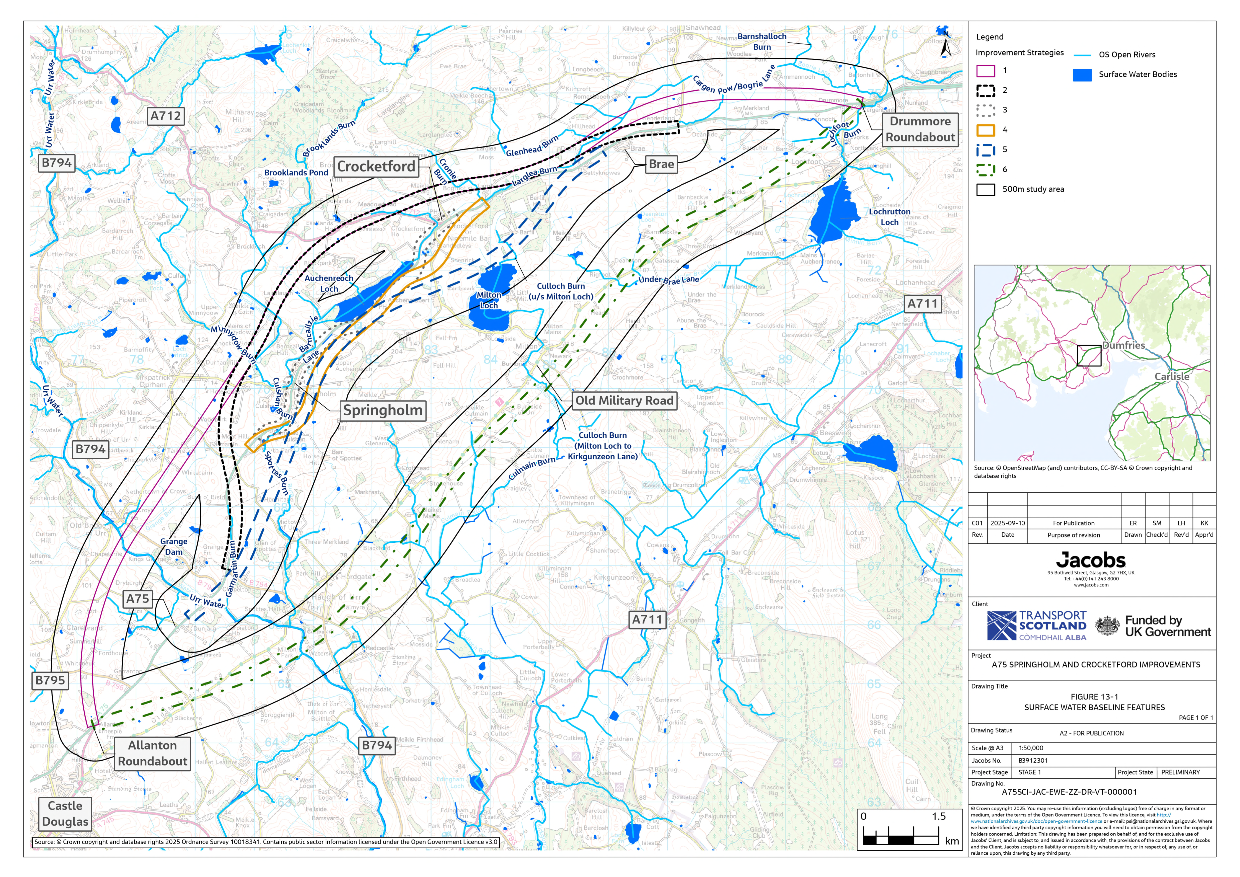
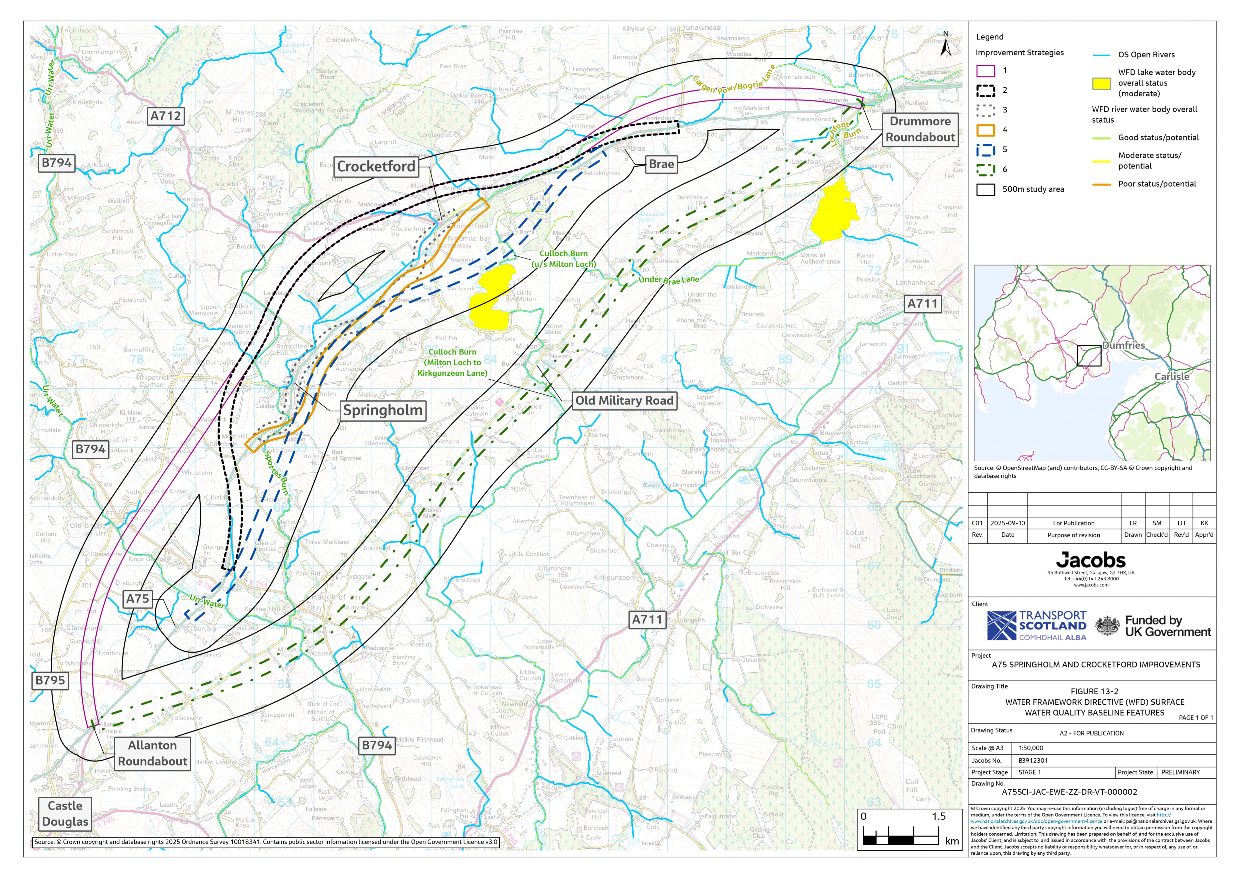
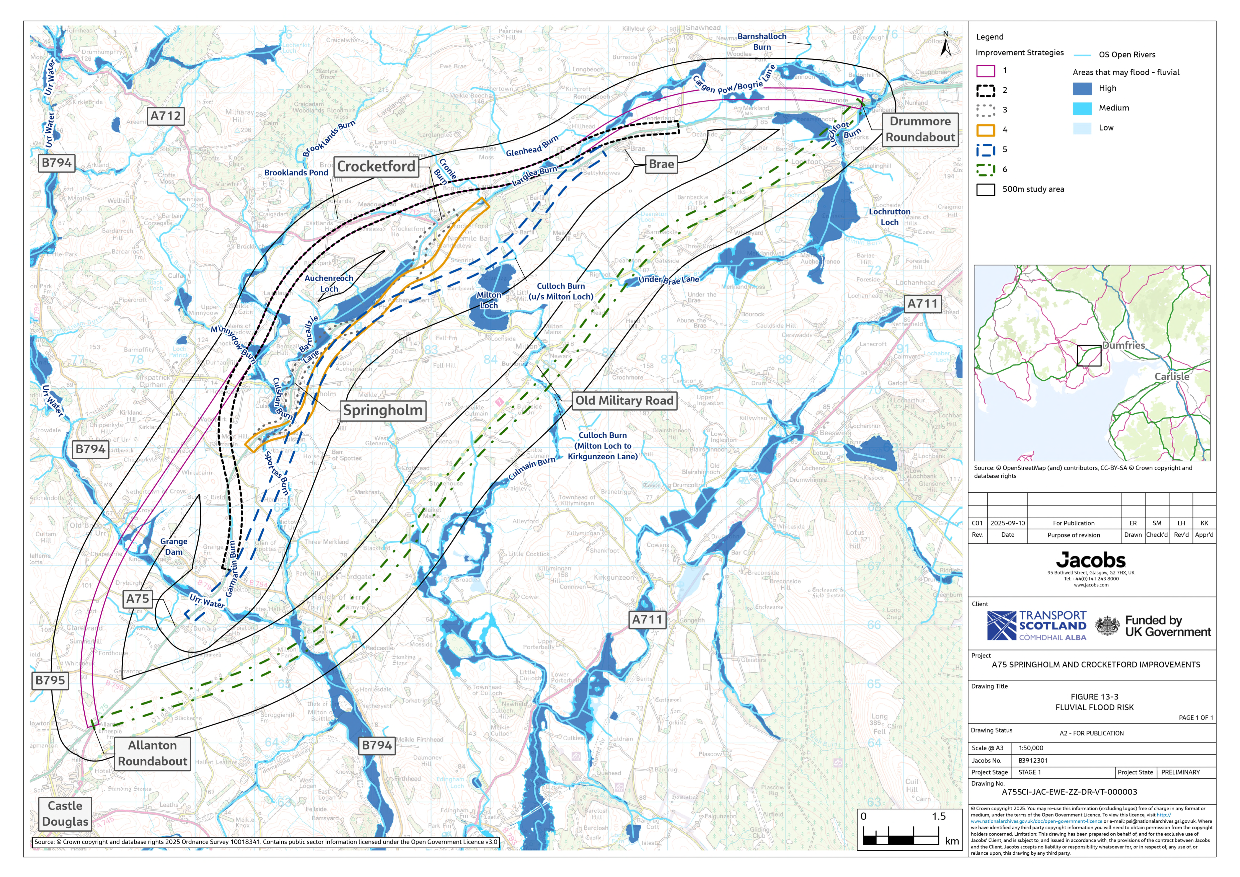
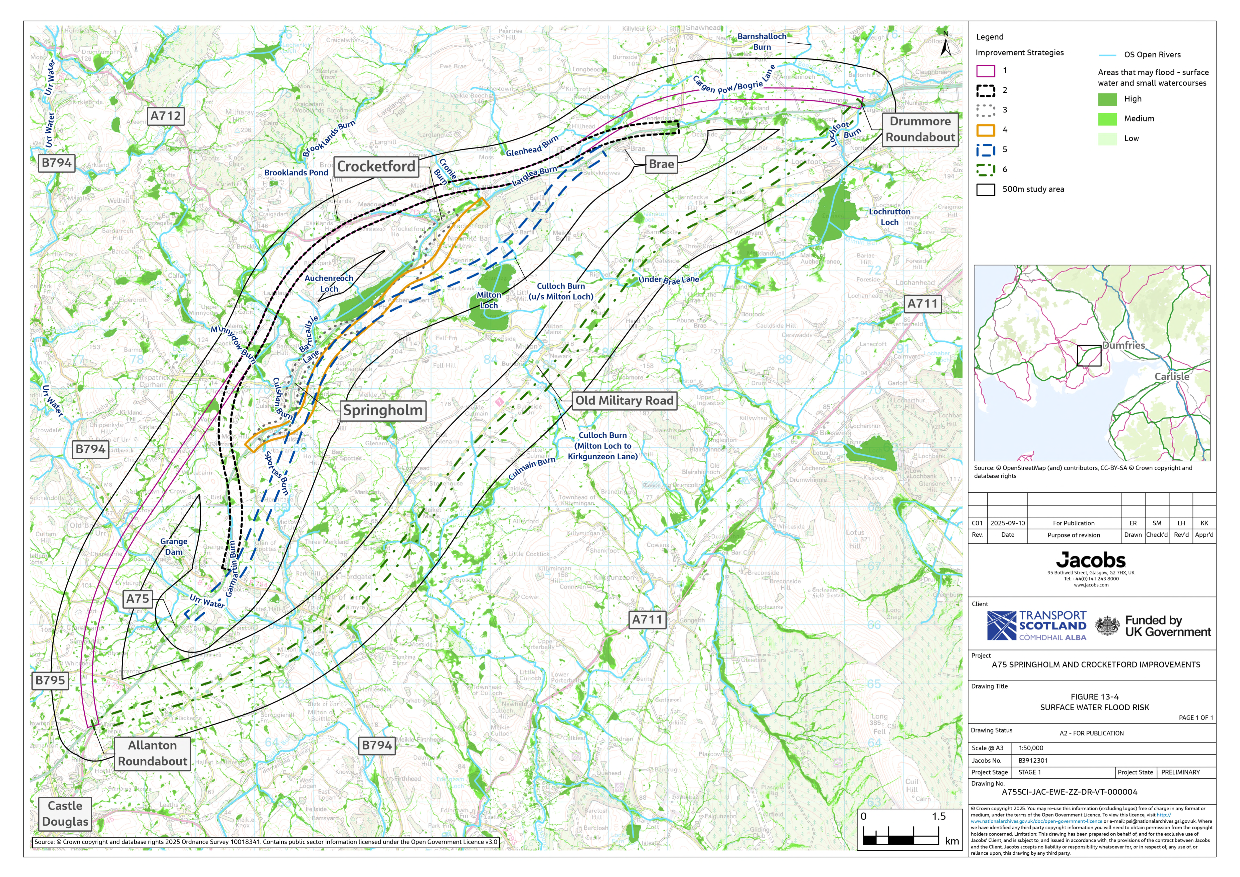
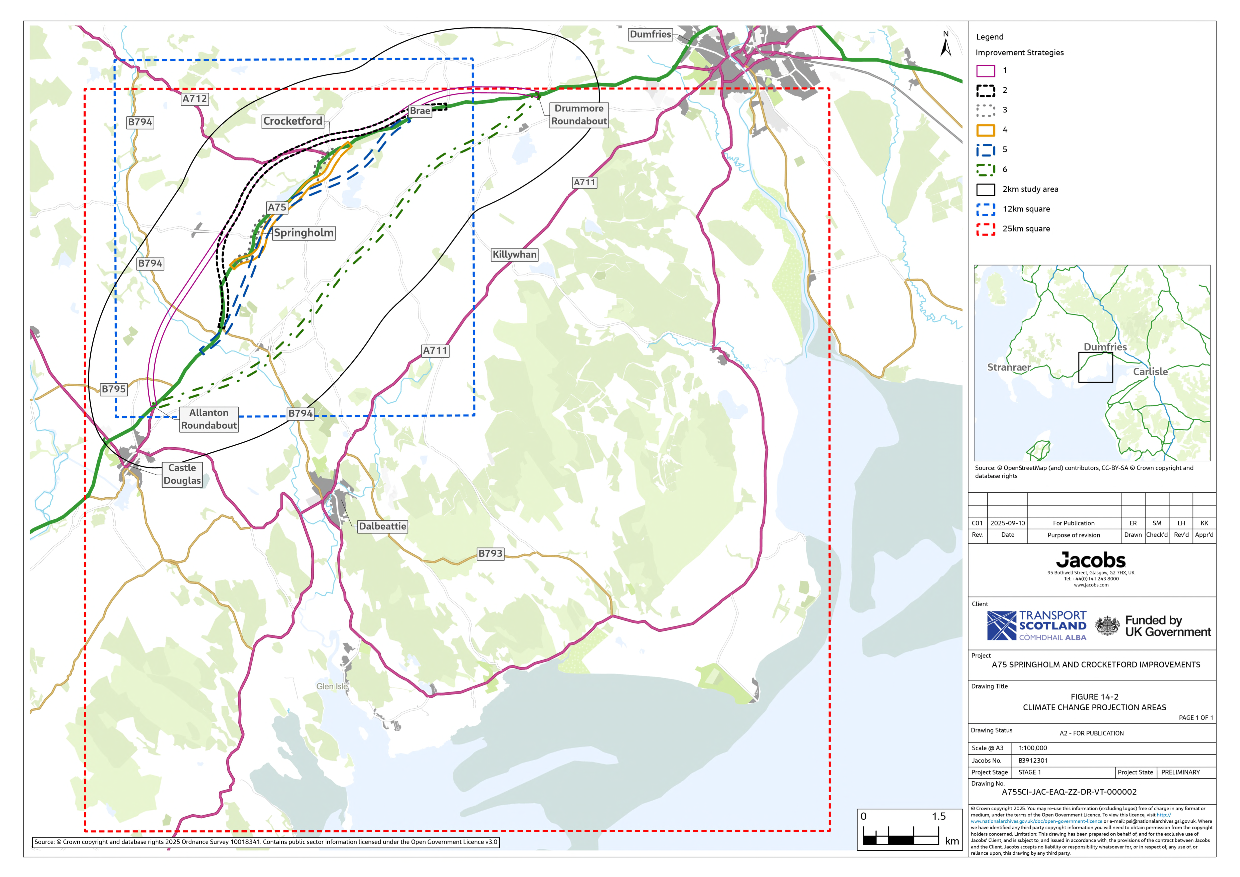
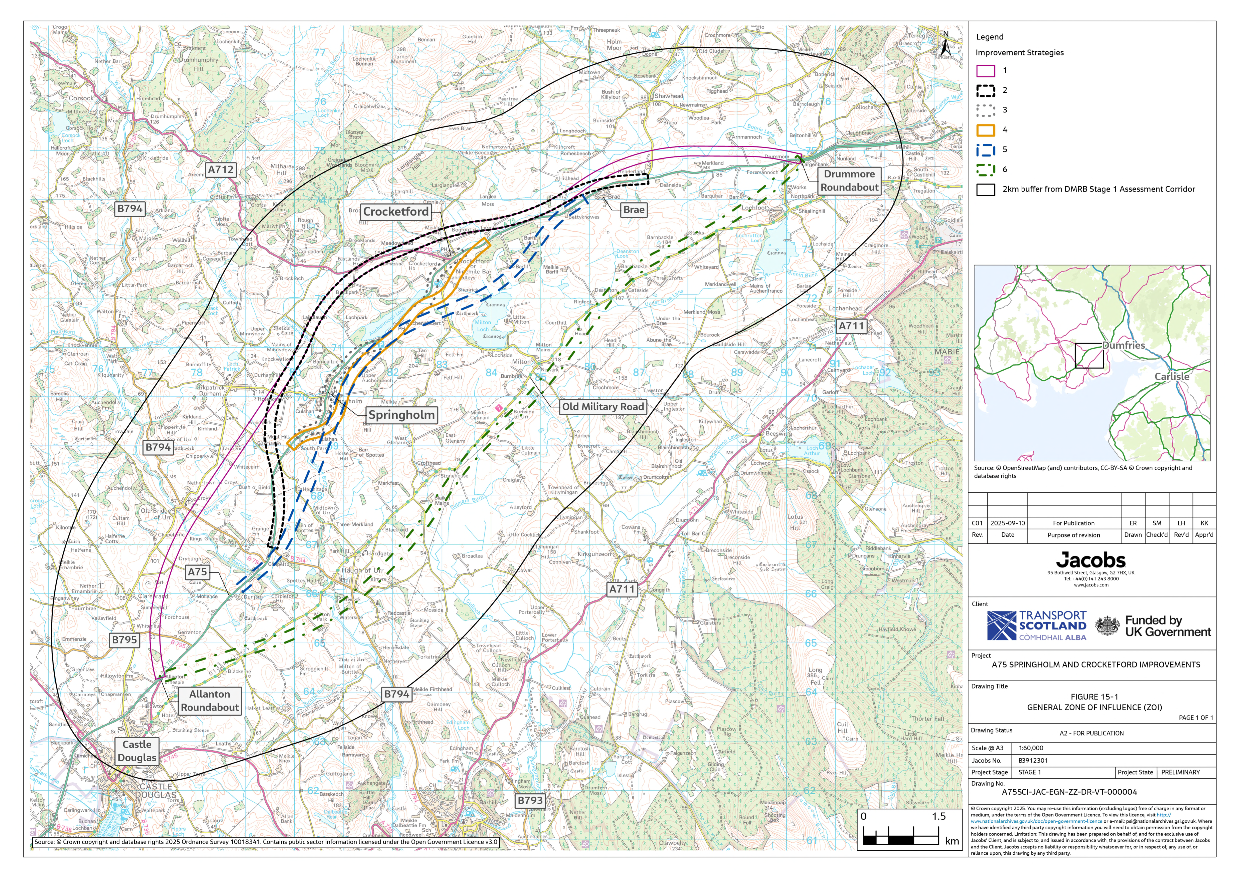
The following appendix figures visually display environmental data collected as part of the Environmental Appraisal Report (EAR). These Figures should be viewed in conjunction with the EAR.

A figure showing the six improvement strategies and the DMRB Stage 1 Assessment Corridor
Figure 1-1: Assessment Corridor
A figure showing the six improvement strategies, the DMRB Stage 1 Assessment Corridor and a 2 km buffer offset from the DMRB Stage 1 Assessment Corridor
Figure 2-1: Proposed Scheme Location
A figure showing the location of the National Cycle Network 7 and Core Paths in relation to the six improvement strategies and the DMRB Stage 1 Assessment Corridor
Figure 2-2 (A): Environmental Constraints Overview – National Cycle Network and Core Paths
A figure showing the location of the Conservation Areas, Scheduled Monuments, Local Landscape Character Area, Biosphere Reserves and Listed Buildings in relation to the six improvement strategies and the DMRB Stage 1 Assessment Corridor.
Figure 2-2 (B): Environmental Constraints Overview – Landscape and Cultural Heritage Areas
A figure showing the location of the Native Woodland Survey of Scotland, Ancient Woodland Inventory, Local Wildlife Sites and Sites of Special Scientific Interest in relation to the six improvement strategies and the DMRB Stage 1 Assessment Corridor.
Figure 2-2 (C): Environmental Constraints Overview – Woodlands and Protected Sites
A figure showing the location of the Locally Important Aquifers and the areas of Peatland in relation to the six improvement strategies and the DMRB Stage 1 Assessment Corridor.
Figure 2-2 (D): Environmental Constraints Overview – Peatland and Aquifers
A figure showing the flooding, surface water and waterbodies in relation to the six improvement strategies and the DMRB Stage 1 Assessment Corridor.
Figure 2-2 (E): Environmental Constraints Overview – Flooding, Surface Water and Waterbodies
A figure showing the six improvement strategies and the study area for the air quality assessment, based on a 2km buffer of the DMRB Stage 1 Assessment Corridor. The study area has been established in the absence of traffic data and based on professional judgement. The study area includes land within the areas administered by Dumfries and Galloway Council as shown in Figure 5-1.
Figure 5-1: Air Quality Study Area
A figure showing designated cultural heritage assets within the 1km study area. Theses assets include listed buildings and conservation areas, officially recognised and legally protected for their special heritage interest and value.
Figure 6-1: Designated Cultural Heritage Assets
A figure showing non-designated cultural heritage assets within the 500m study area. Non-designated cultural heritage assets are known local archaeological sites and finds, historic buildings and historic landscapes and recorded on the local authority Historic Environment Record (HER).
Figure 6-2: Non-designated Cultural Heritage Assets
A figure showing landscape and visual constraints located within the 2km study area. These constraints include Listed Buildings, Conservation Areas, Scheduled Monuments, Biosphere Reserves, Sites of Special Scientific Interest and areas listed on the Ancient Woodland Inventory or surveyed as part of the Native Woodland Survey of Scotland.
Figure 7-1: Landscape and Visual Constraints
A figure showing Landscape Character Types and Local Landscape Areas located within the 2km study area.
Figure 7-2: Landscape Character
A figure showing visual receptor locations within the 2km study area. These visual receptor locations are Schools, Greenspaces, National Cycle Networks and Core Paths.
Figure 7-3: Visual Receptors
A figure showing the areas around the six improvement strategies which are designated as Special Areas of Conservation, Special Protection Areas, RAMSAR, Sites of Special Scientific Interest and Local Wildlife Sites and the 2 km study area.
Figure 8-1: Designated Sites
A figure showing the areas of habitat around the six improvement strategies which are either listed on the Ancient Woodland Inventory or were surveyed as part of the Native Woodland Survey of Scotland
Figure 8-2: Woodland Areas
A figure showing the peatland classifications for the 250 m study area around the six improvement strategies
Figure 9-1 (A): Superficial Geology & Peatland
A figure showing the peatland classifications for the 250 m study area around the six improvement strategies
Figure 9-1 (B): Superficial Geology & Peatland
A figure showing the bedrock geology for the 250 m study area around the six improvement strategies
Figure 9-2: Bedrock Geology
A figure showing the potentially contaminated sites and their associated risk level for the 250 m study area around the six improvement strategies
Figure 9-3: Potentially Contaminated Land Uses
A figure showing the bedrock aquifer for the 500 m study area around the six improvement strategies
Figure 9-4 (A): Groundwater Baseline Features (Bedrock Aquifers)
A figure showing the locally important aquifer, surface water bodies and watercourses within the 500 m study area around the six improvement strategies
Figure 9-4 (B): Groundwater Baseline Features (Superficial Aquifers)
A figure showing the Sites of Special Scientific Interest, surface water bodies, watercourses, scheduled monuments, springs, wells and listed buildings within the 1 km study area around the six improvement strategies
Figure 9-4 (C): Groundwater Baseline Features (Secondary Receptors)
A figure showing the boundaries of the Improvement Startegies (first study area) for Material Assets and Waste on a map.
Figure 10-1 (A): Material Assets and Waste Study Area
A figure showing the boundaries of the second study area for Material Assets and Waste on a map.
Figure 10-1 (B): Material Assets and Waste Study Area
A figure showing the Noise and Vibration 600m study area around the six improvement strategies.
Figure 11-1: Noise and Vibration Study Area
A figure showing the 500 m study area and 2 km study area for the population and human health assessment in relation to the six improvement strategies.
Figure 12-1: Population and Human Health Study Areas
A figure showing surface water features within 500m study area around the six improvement strategies.
Figure 13-1: Surface Water Baseline Features
A figure showing the current status of the Water Framework Directive waterbodies within the 500m study area around the six improvement strategies.
Figure 13-2: Water Framework Directive (WFD) Surface Water Quality Baseline Features
A figure showing the extent of fluvial flood risk within the 500m study area around the six improvement strategies.
Figure 13-3: Fluvial Flood Risk
A figure showing the extent of surface water flood risk within the 500m study area around the six improvement strategies.
Figure 13-4: Surface Water Flood Risk
A figure showing the potential vulnerability of the proposed scheme to climate change impacts based on the UK current and future climate projections for the 25km and 12km nearest grid squares covering the study area.
Figure 14-2: Climate Change Projection Areas
A figure showing the 2km Zone of Influence from the six improvement strategies. This is the search area that was used to indentify any plans or projects that could have potential cumulative effects.
Figure 15-1: General Zone of Influence (ZOI)