Appendix A: Figures

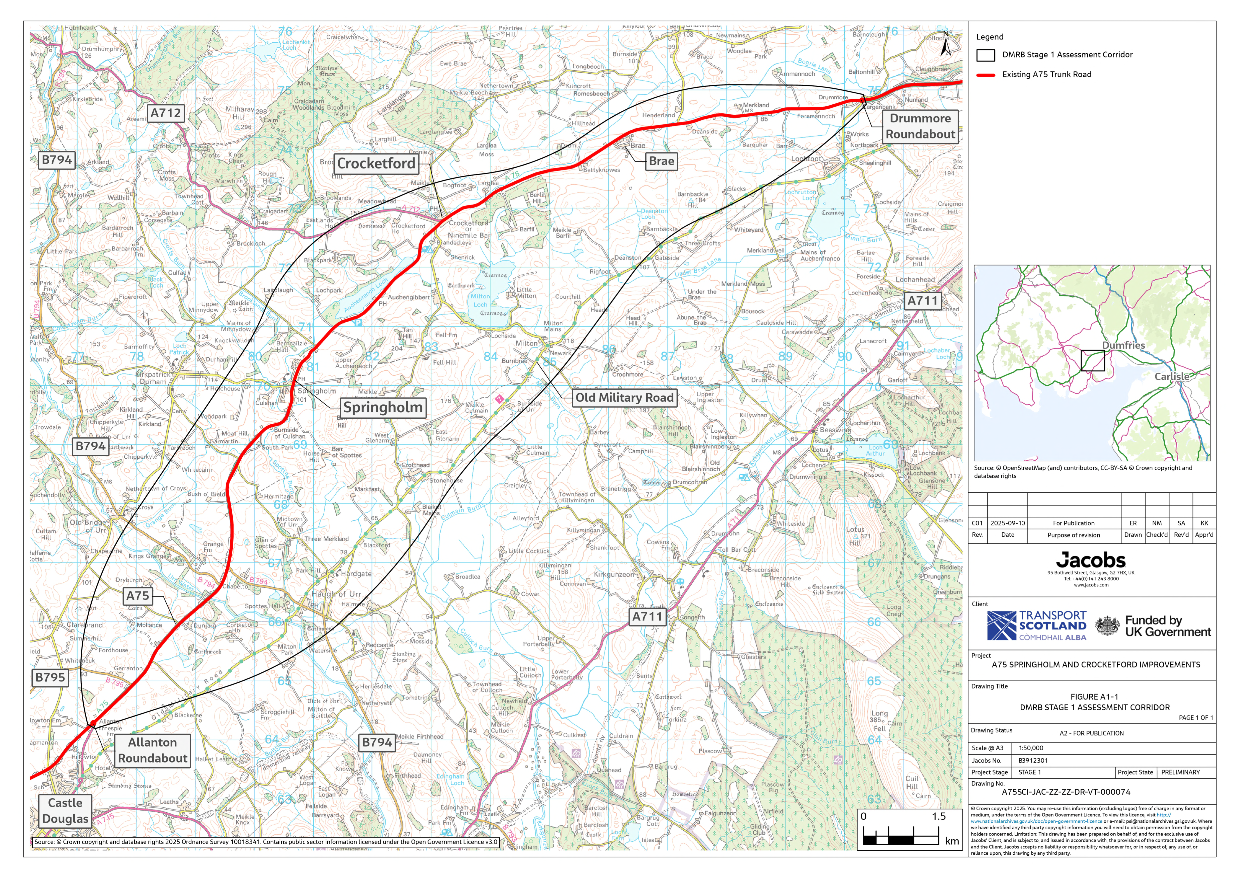
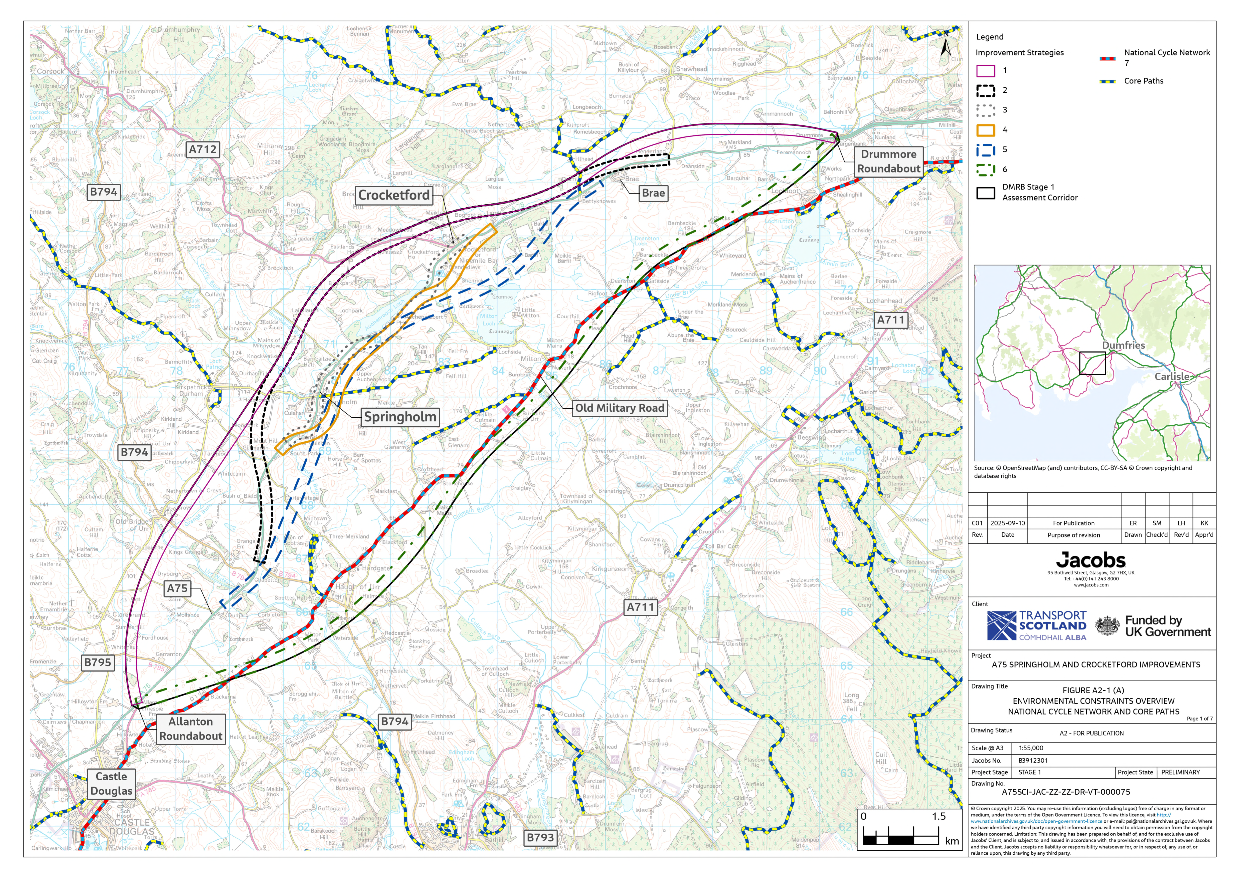
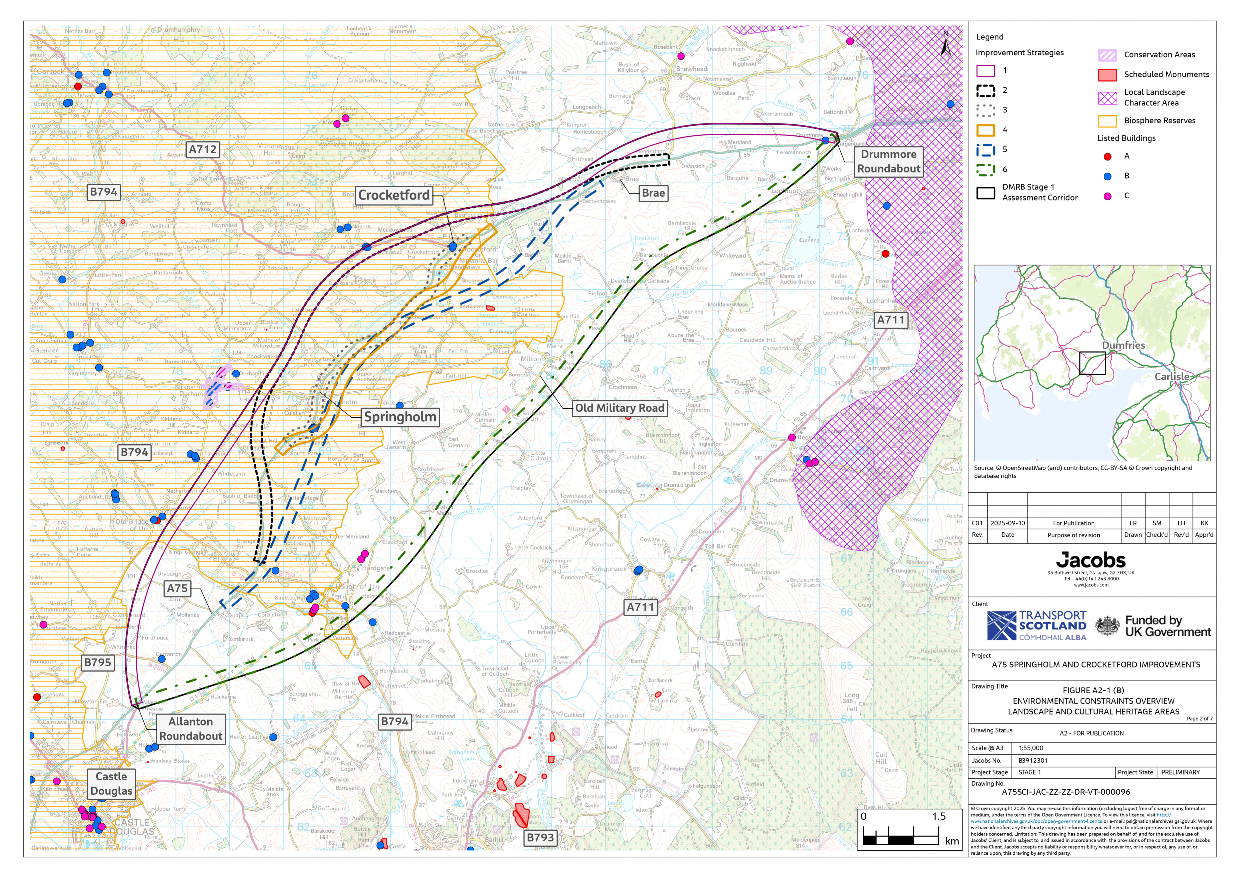
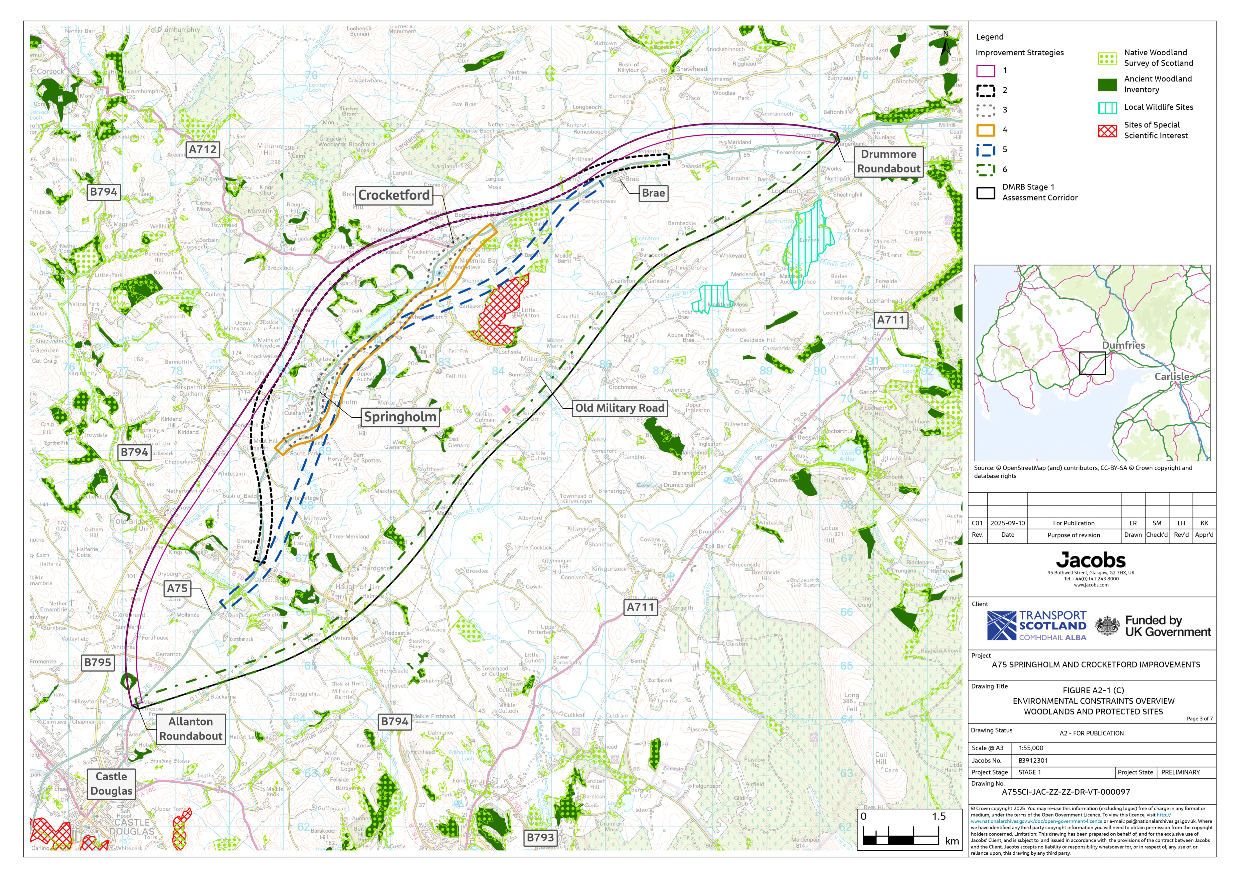
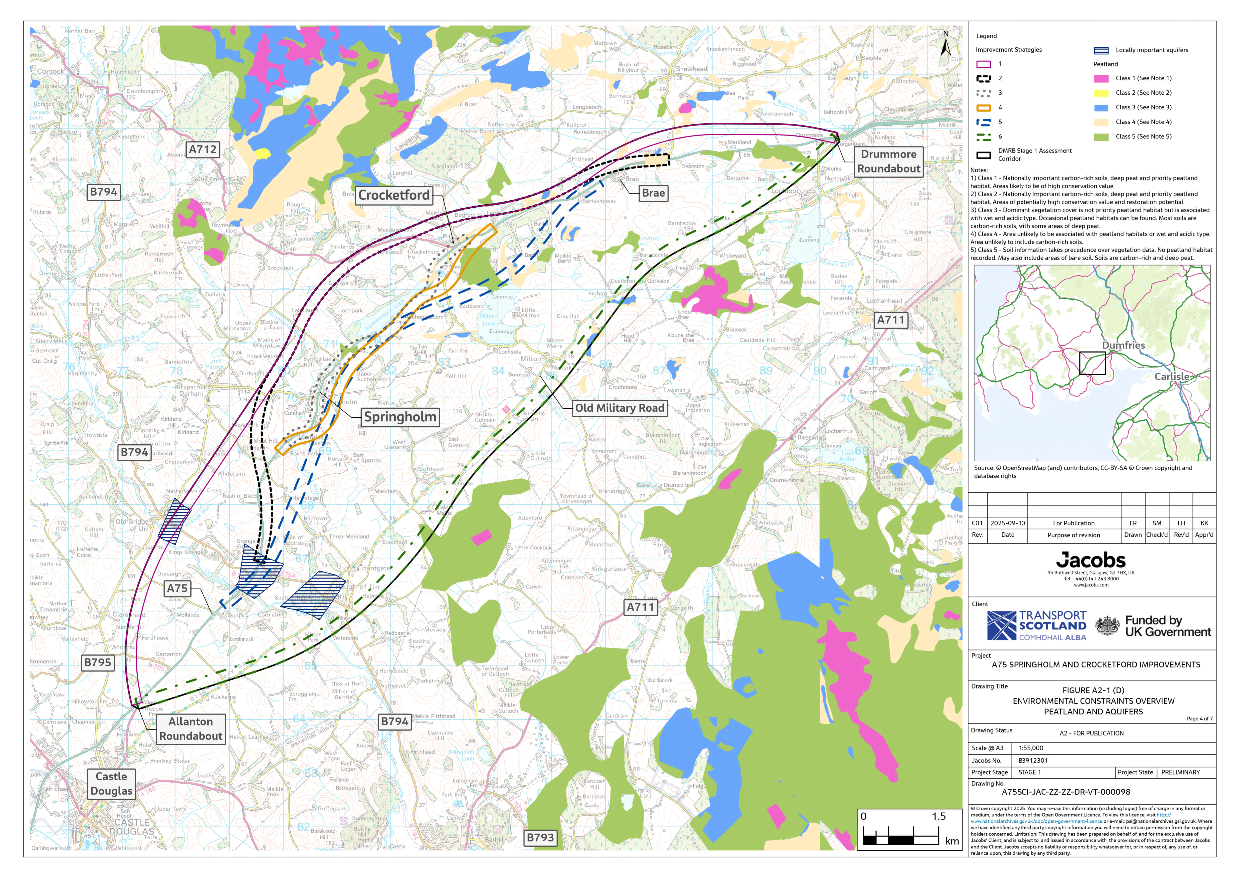
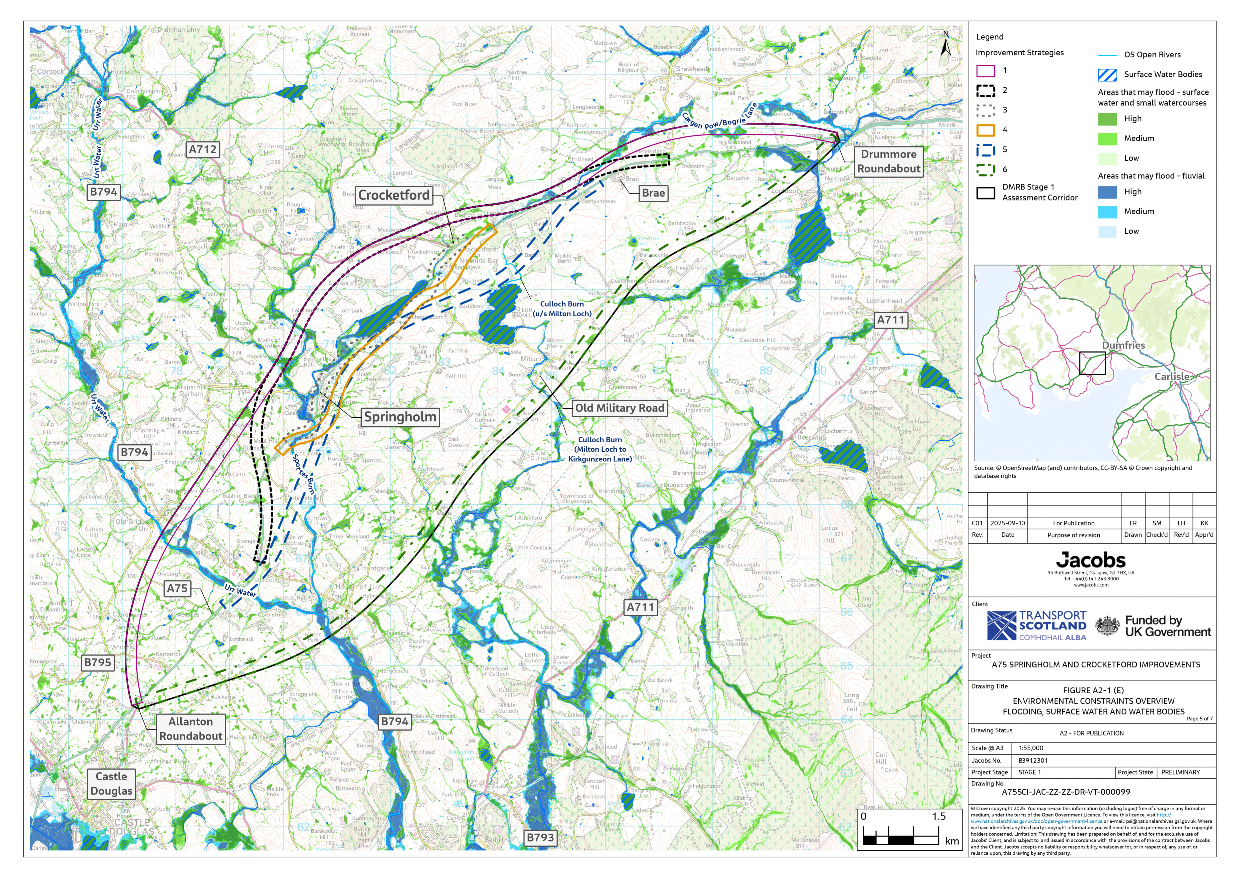
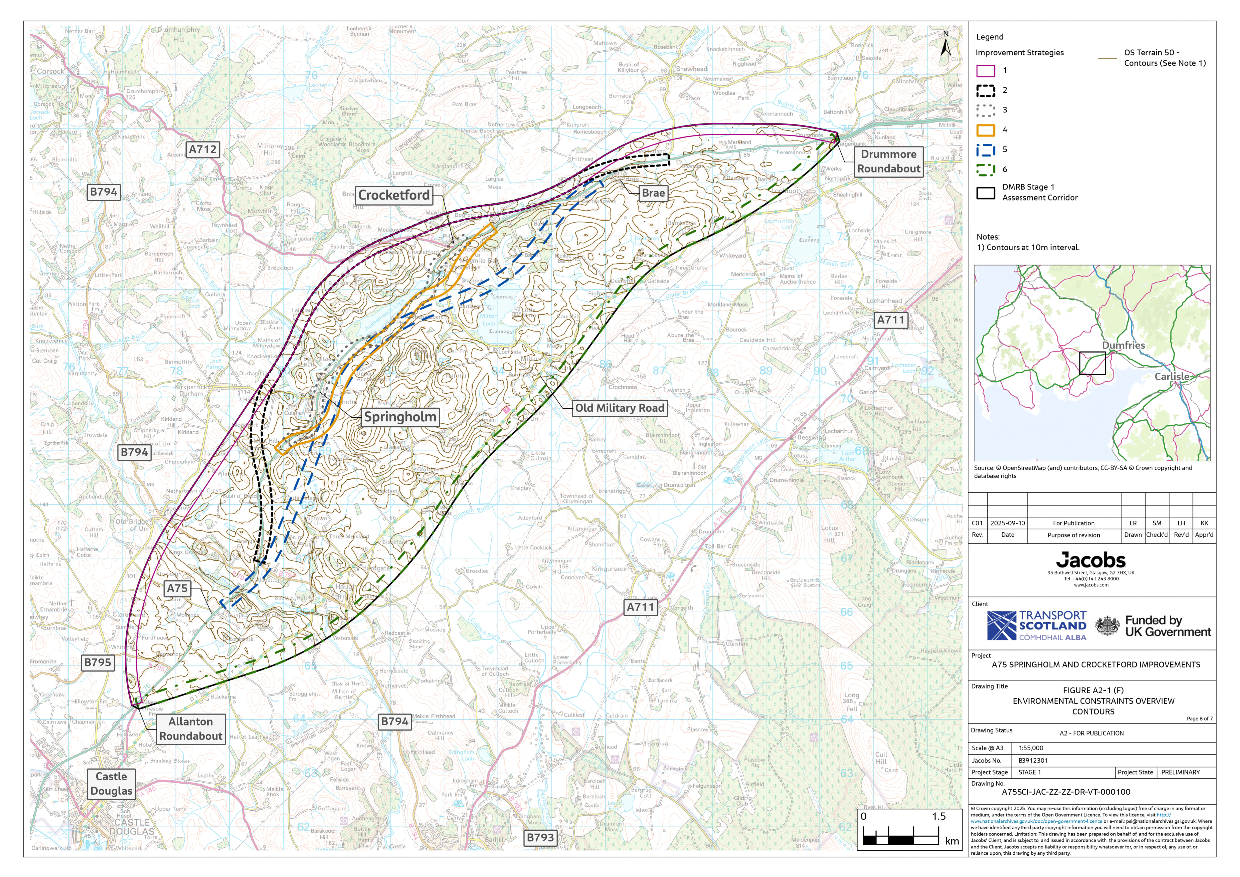
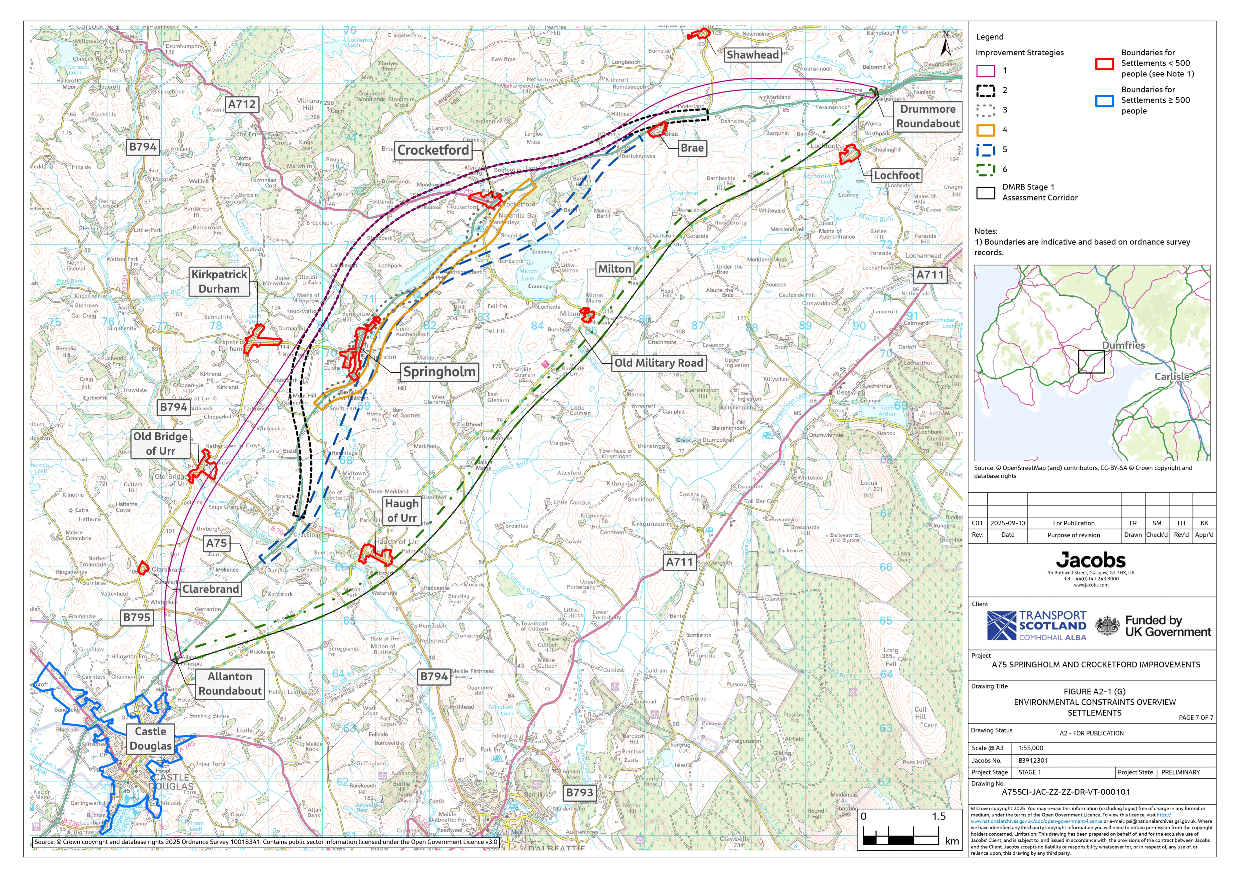
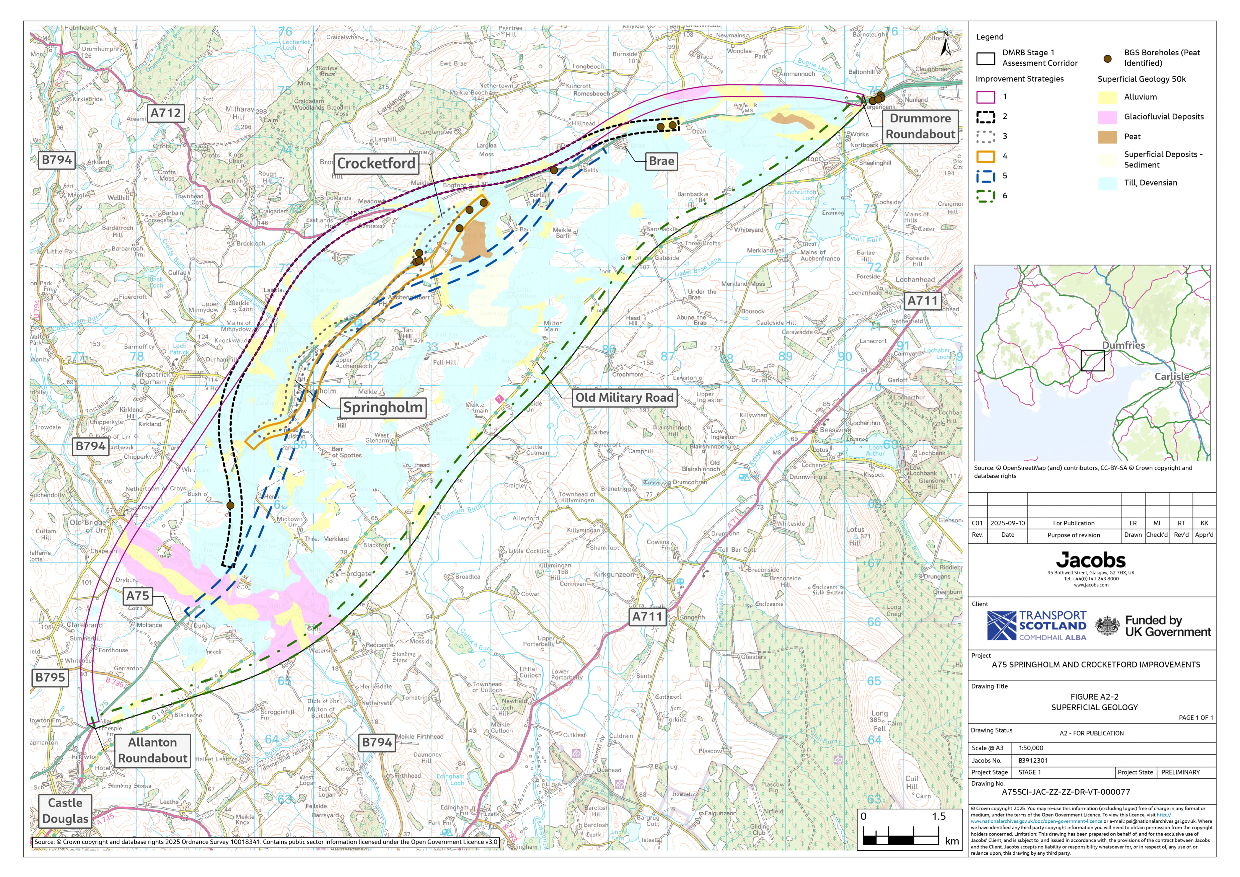
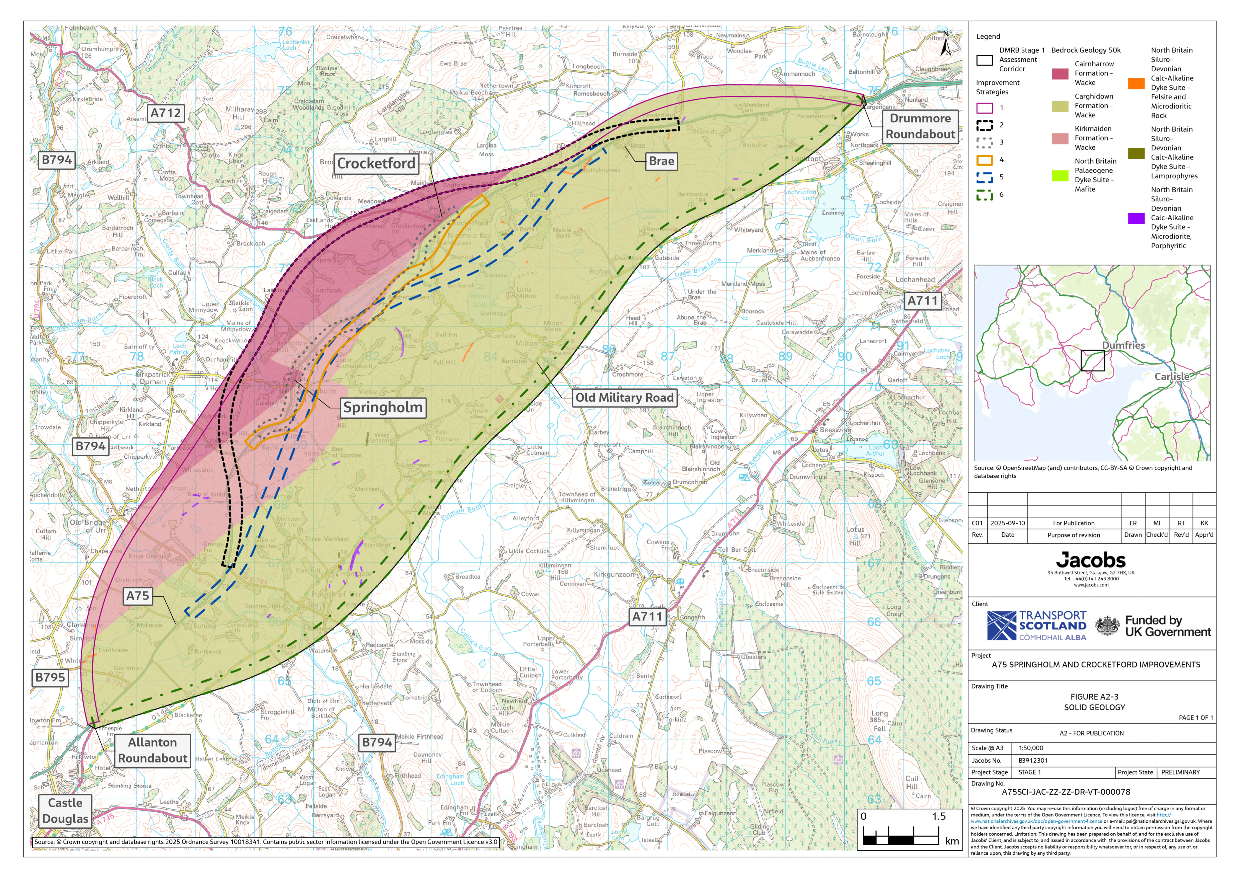
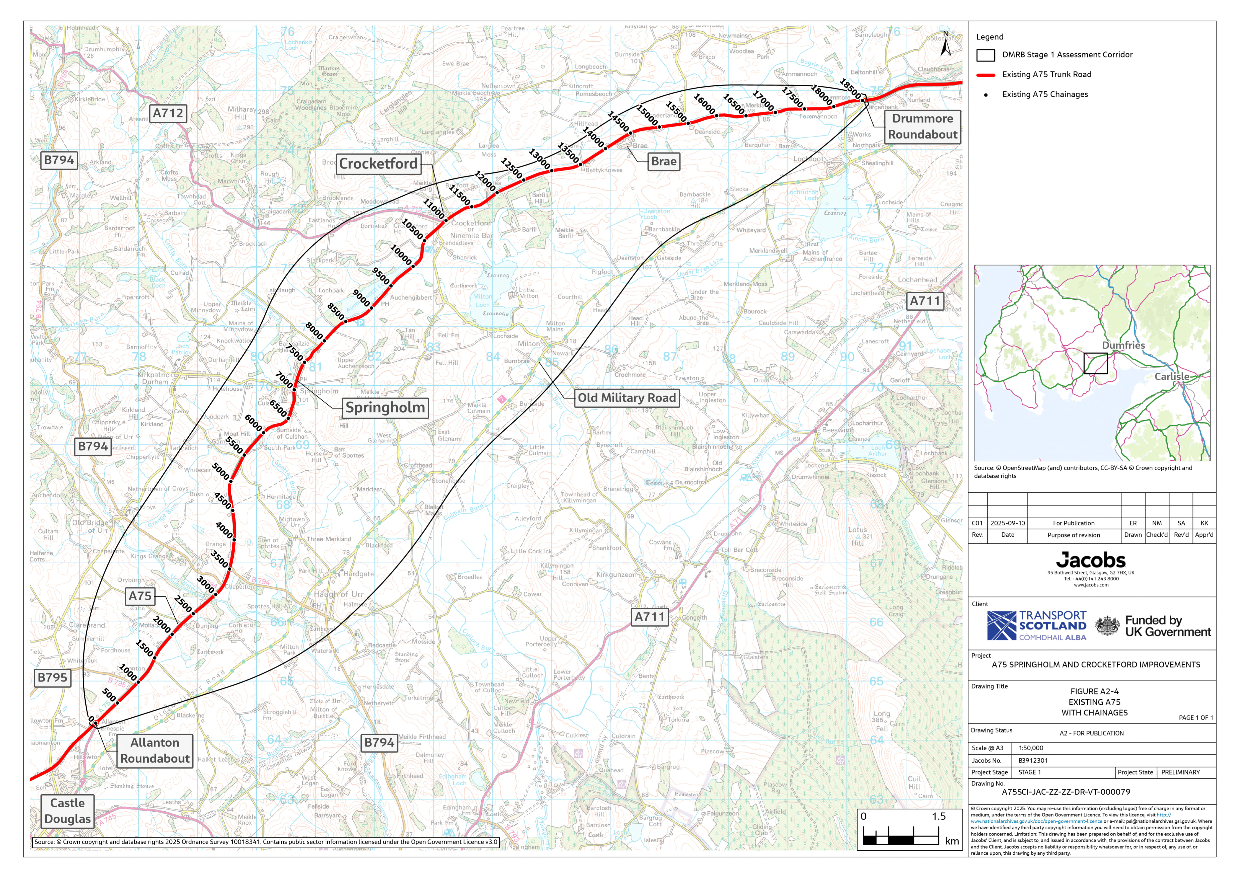
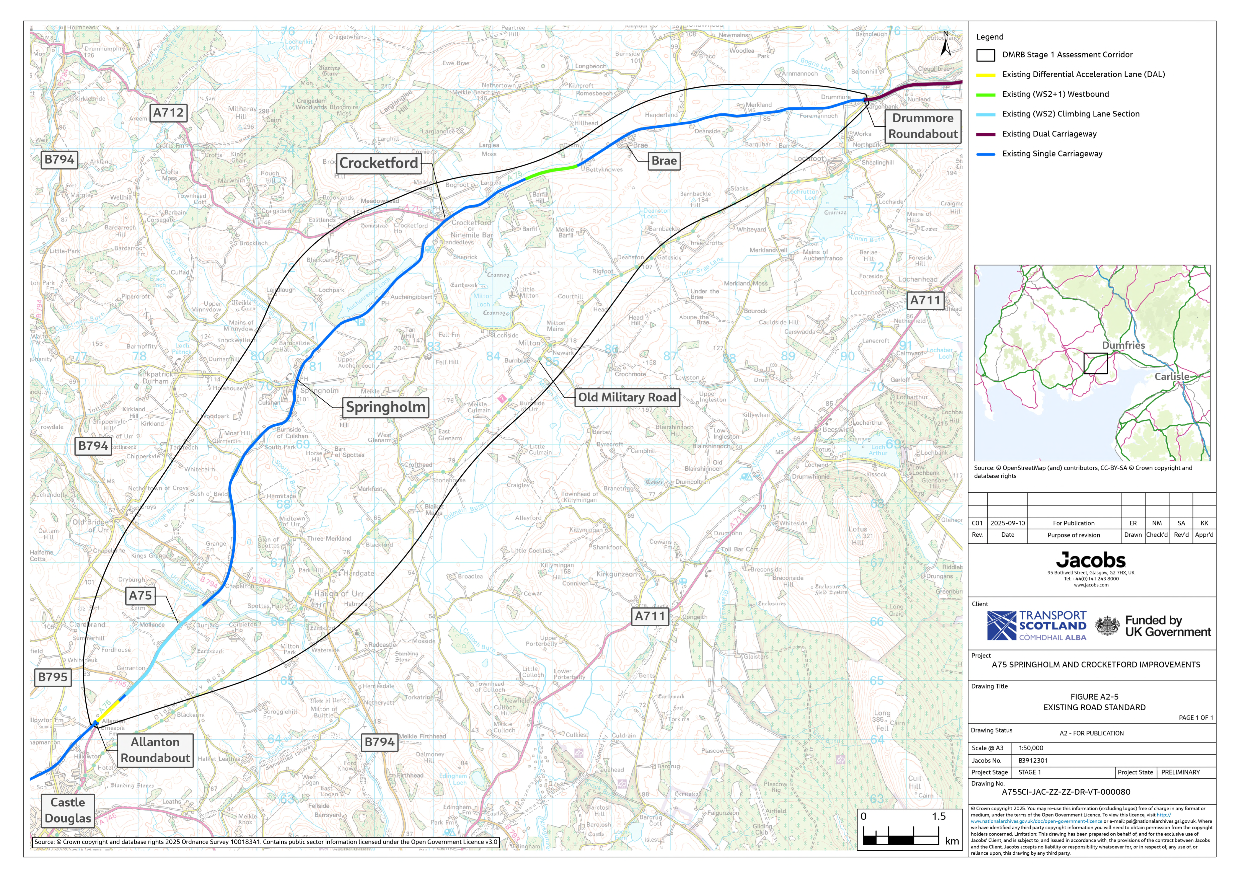
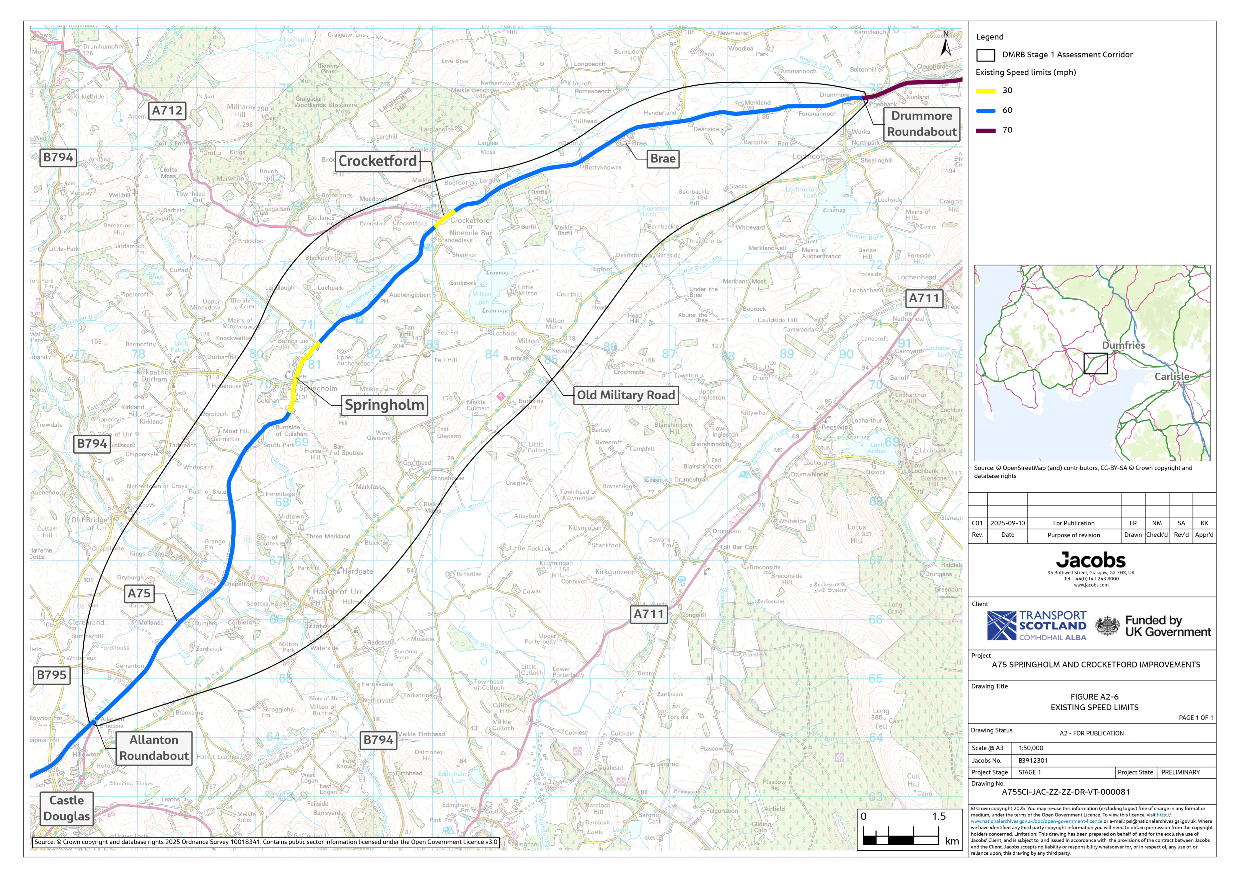
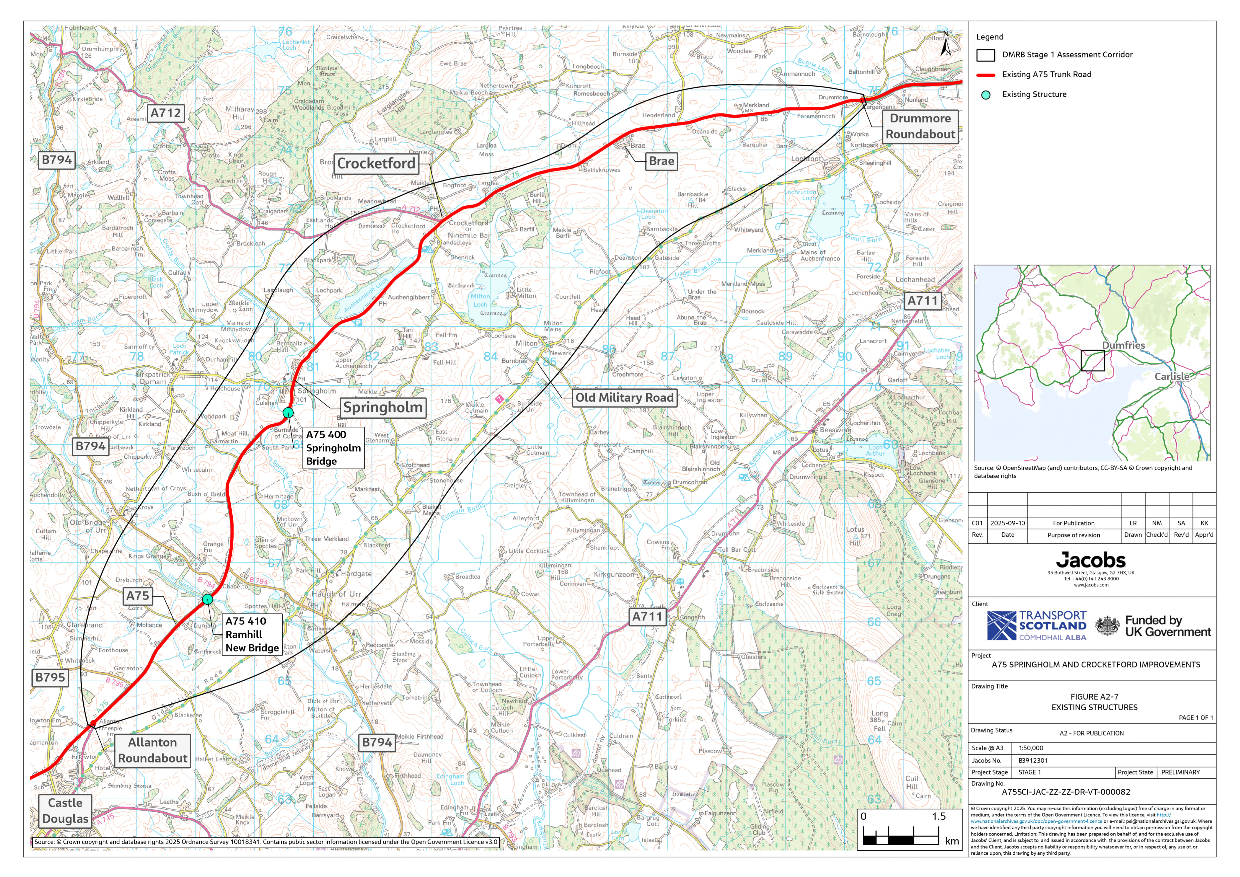
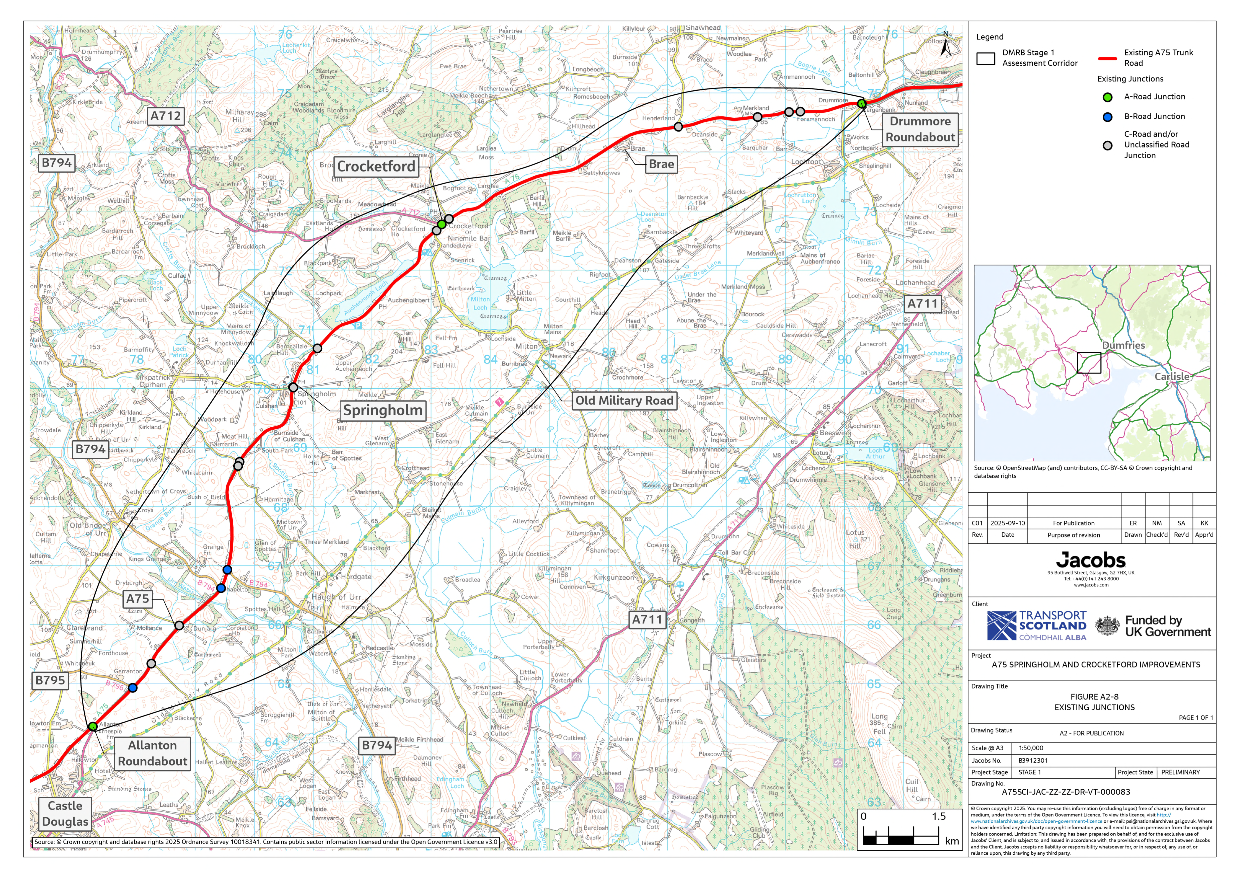
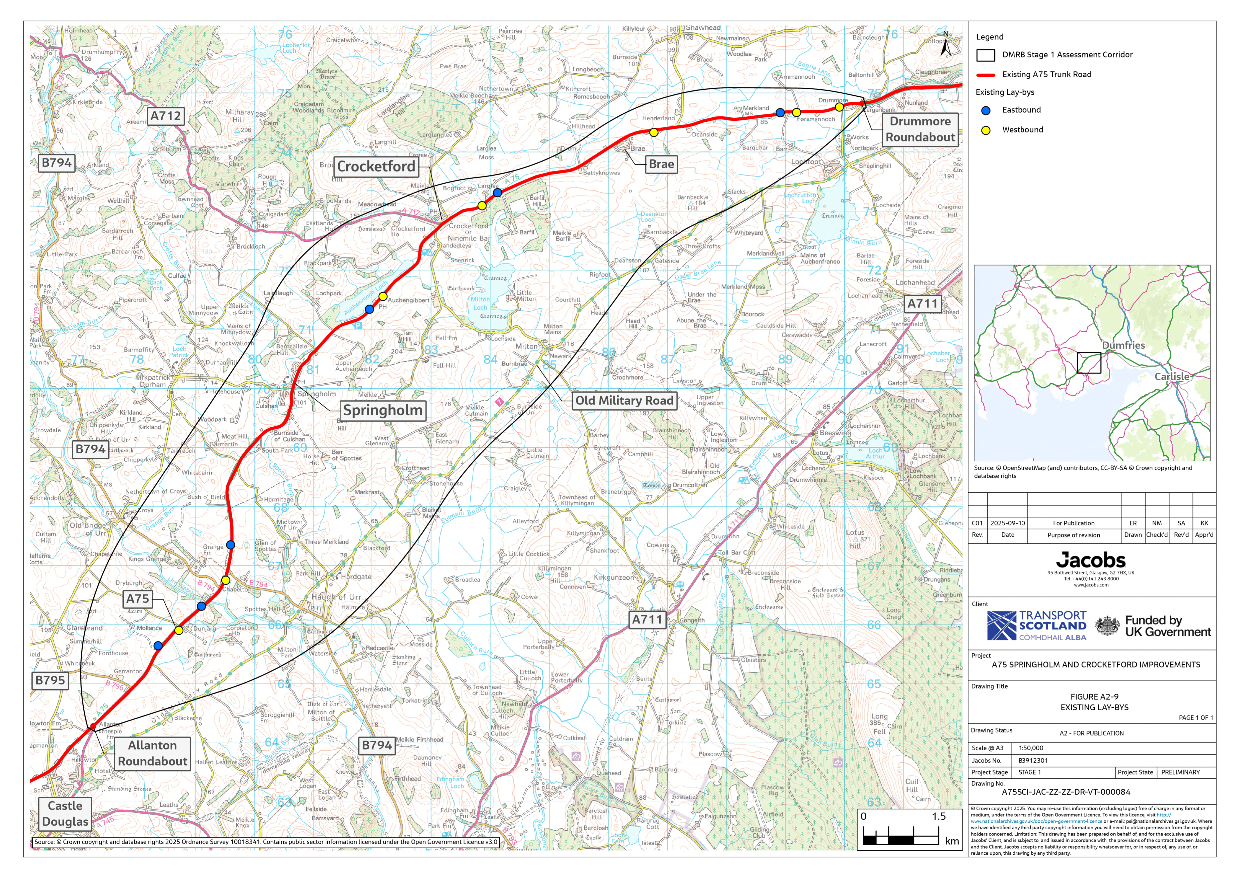
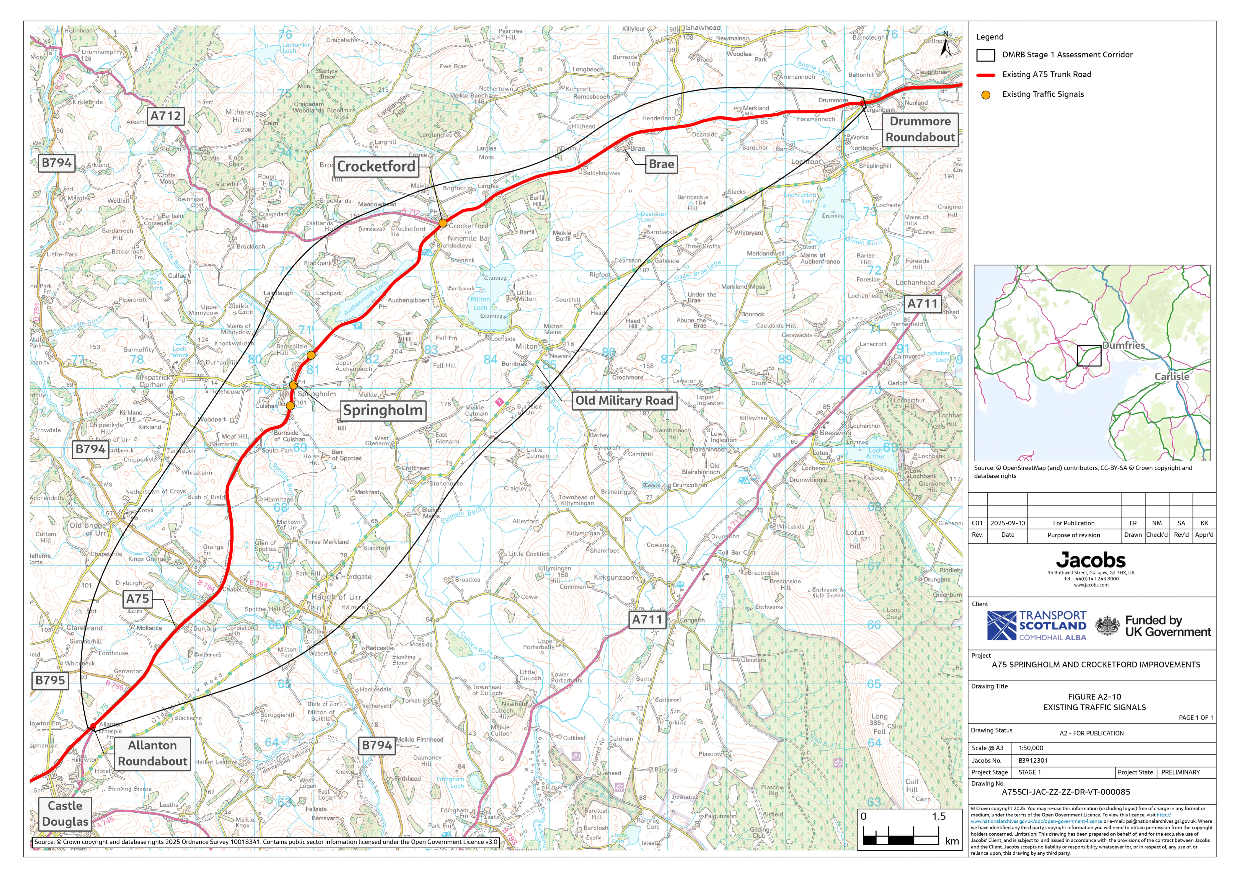
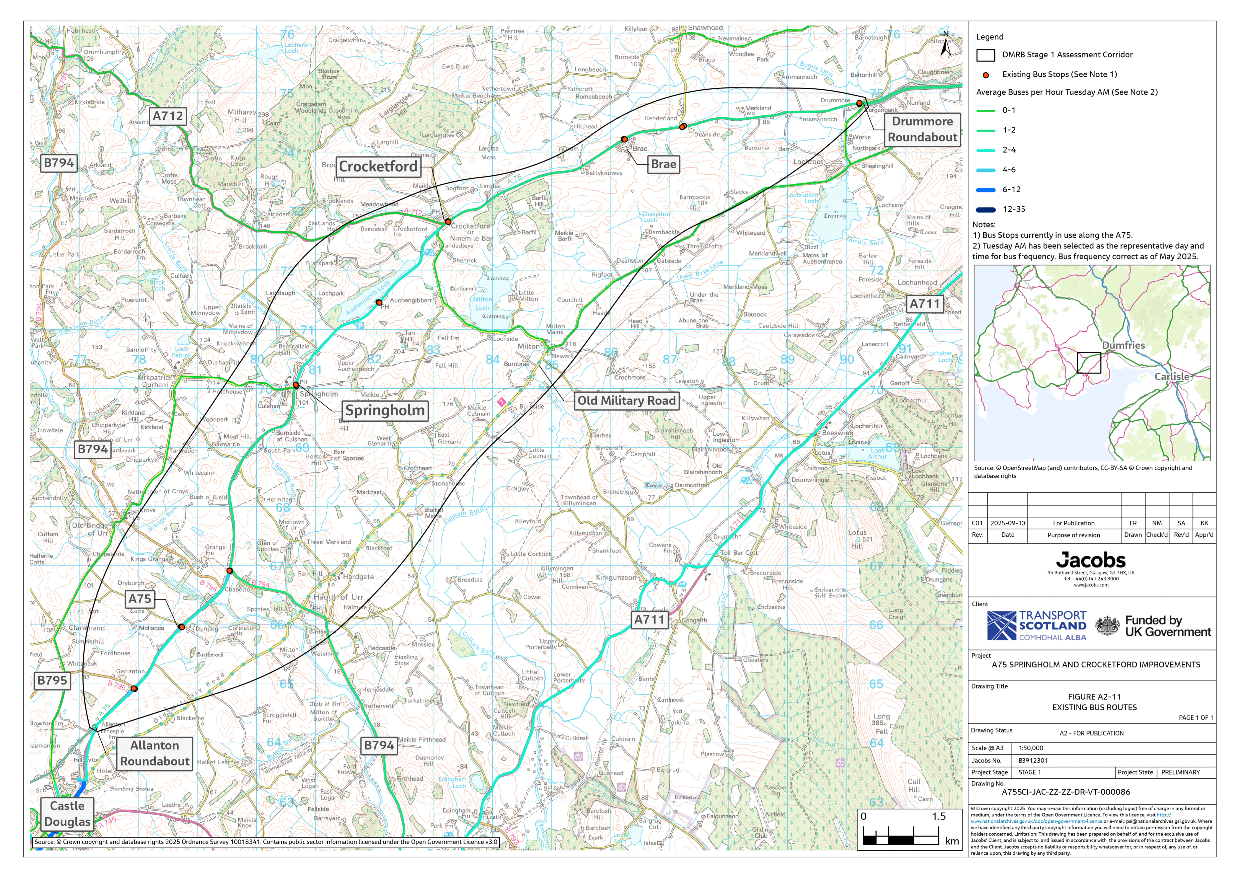
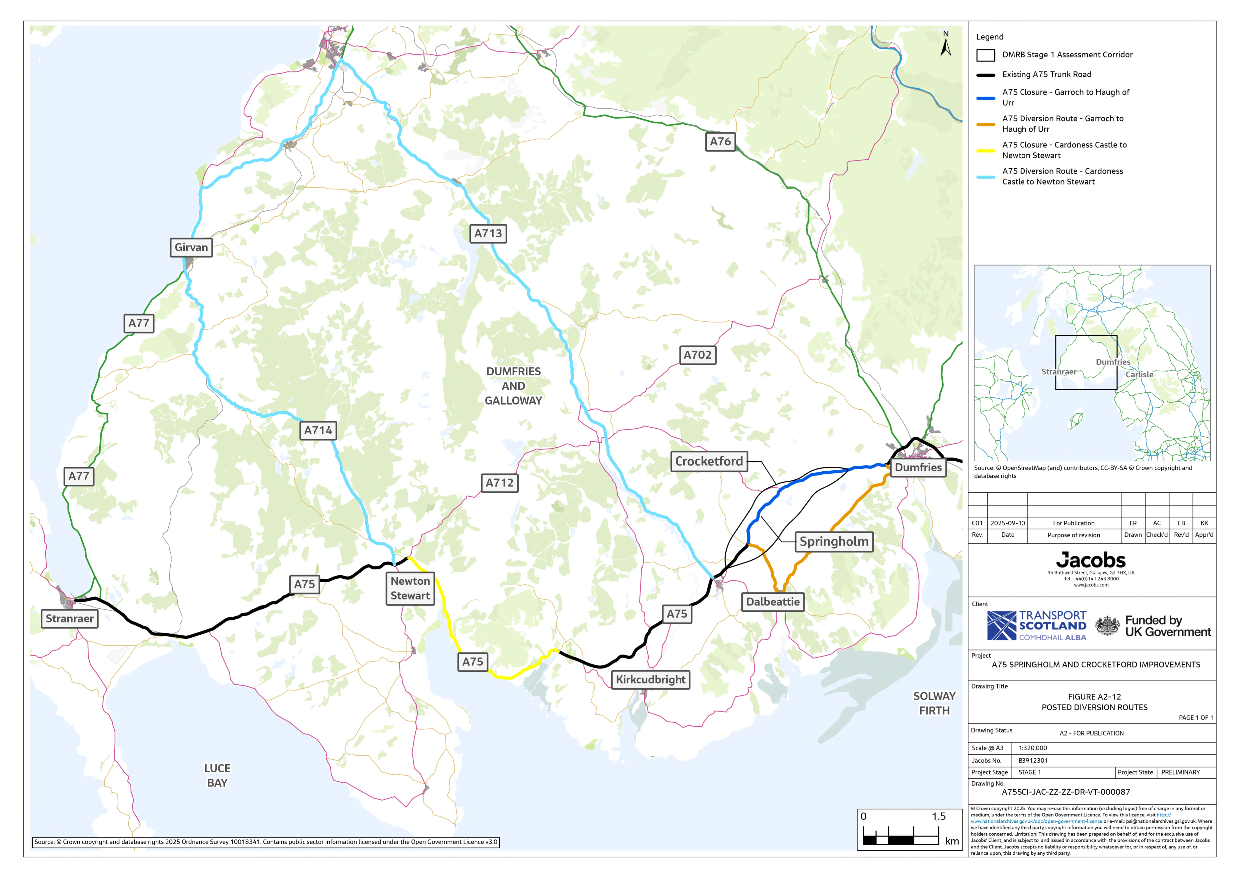
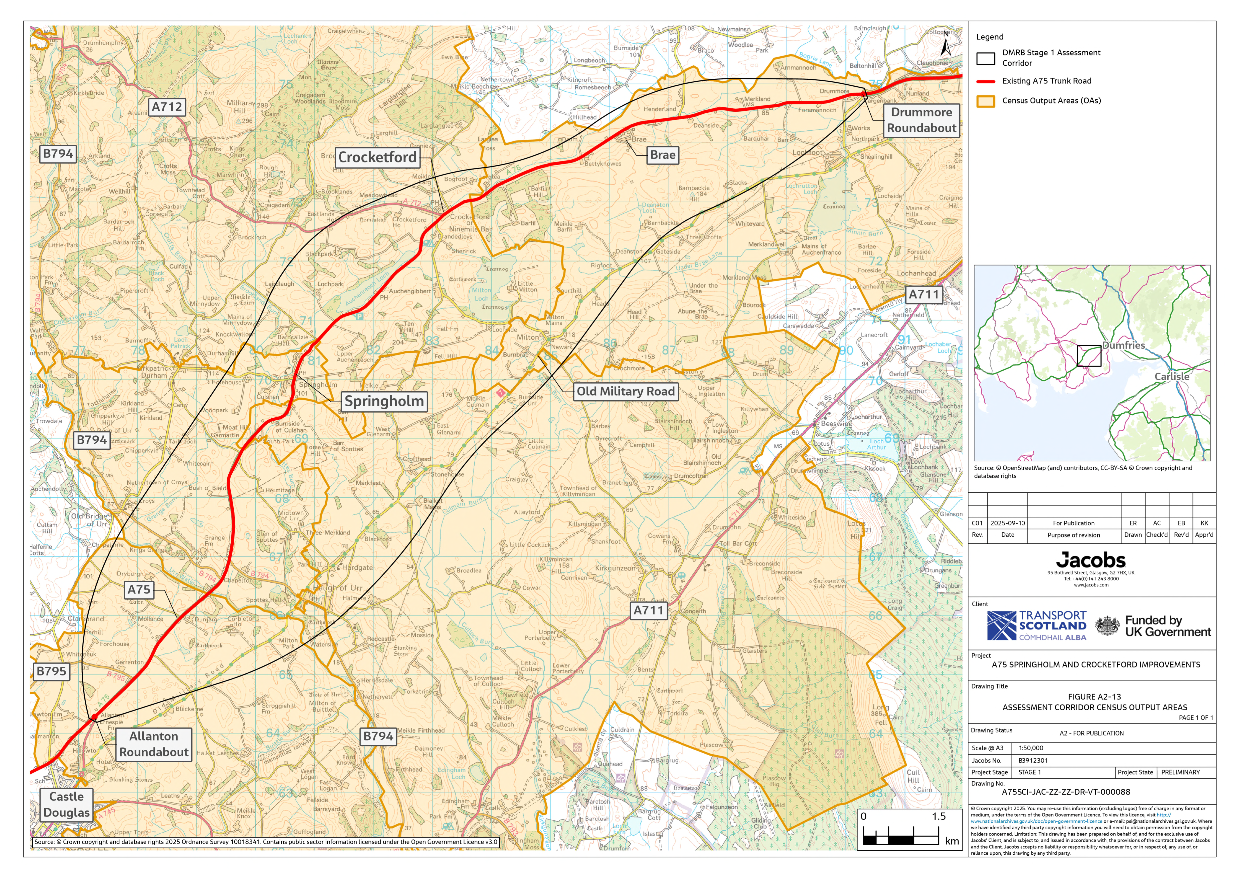
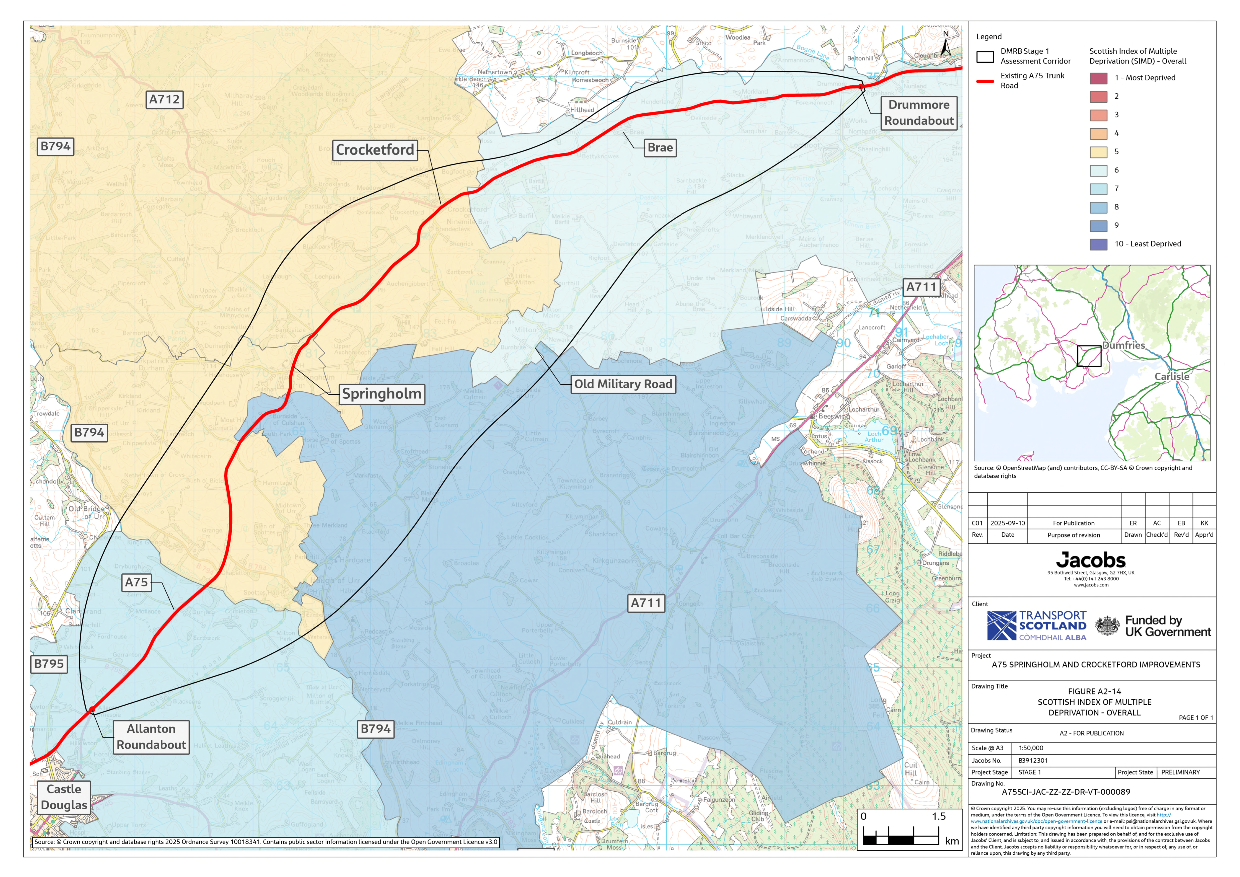
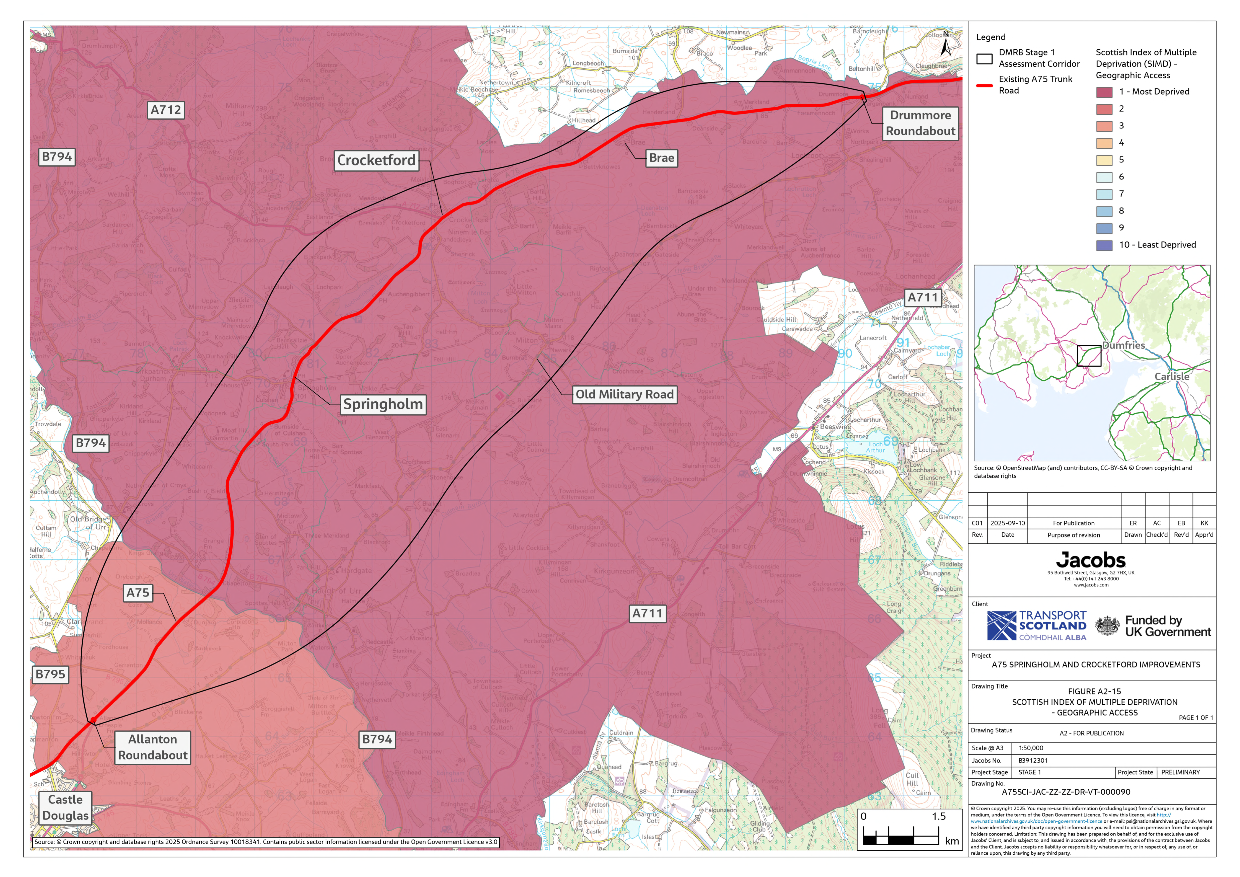
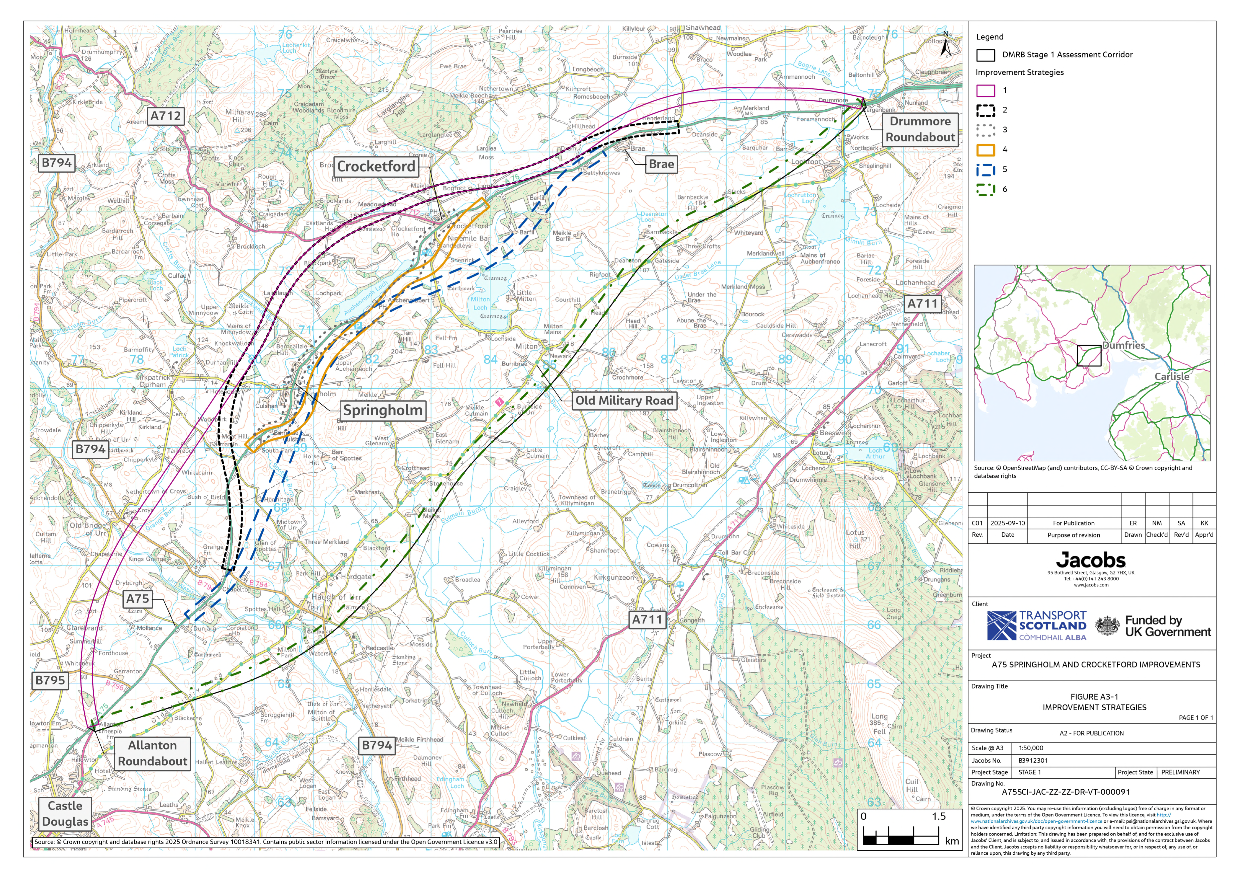
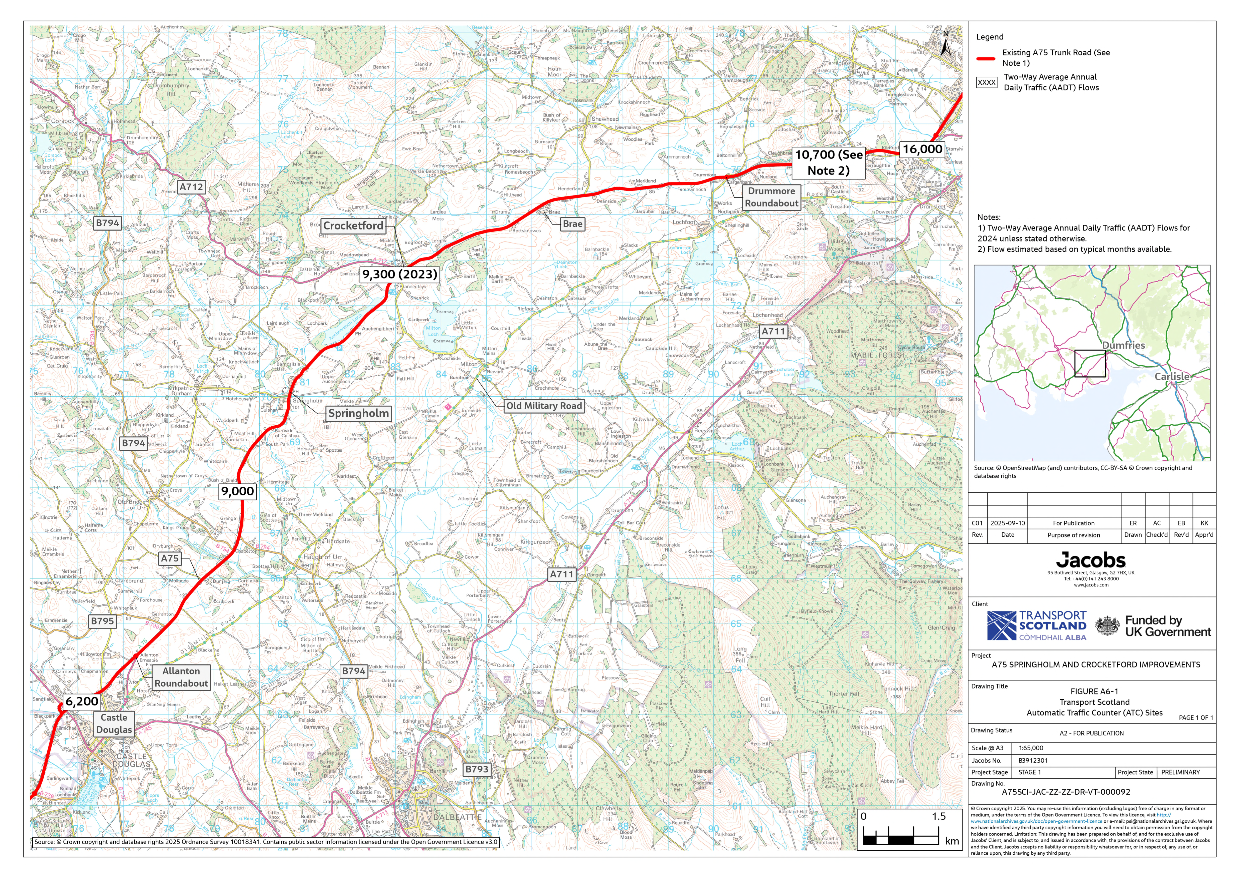
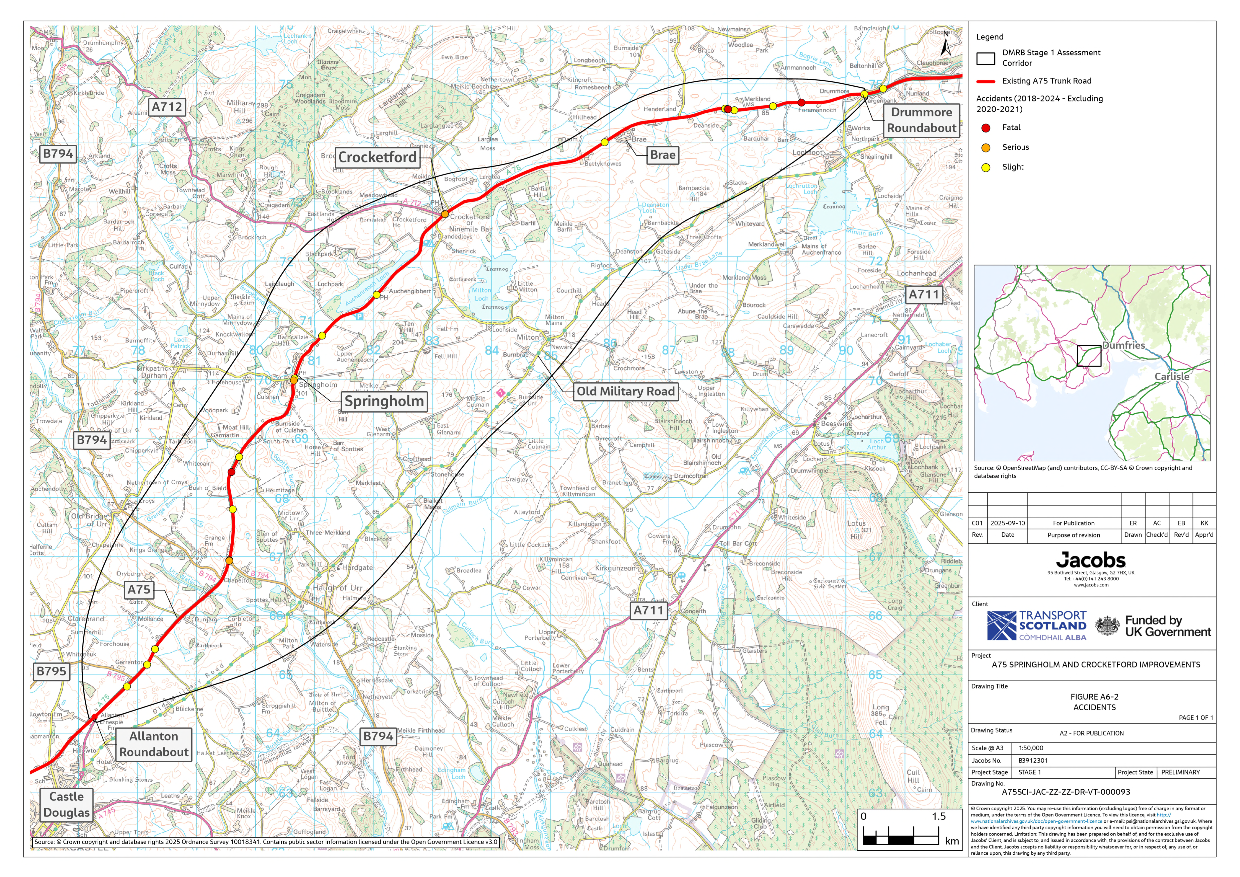
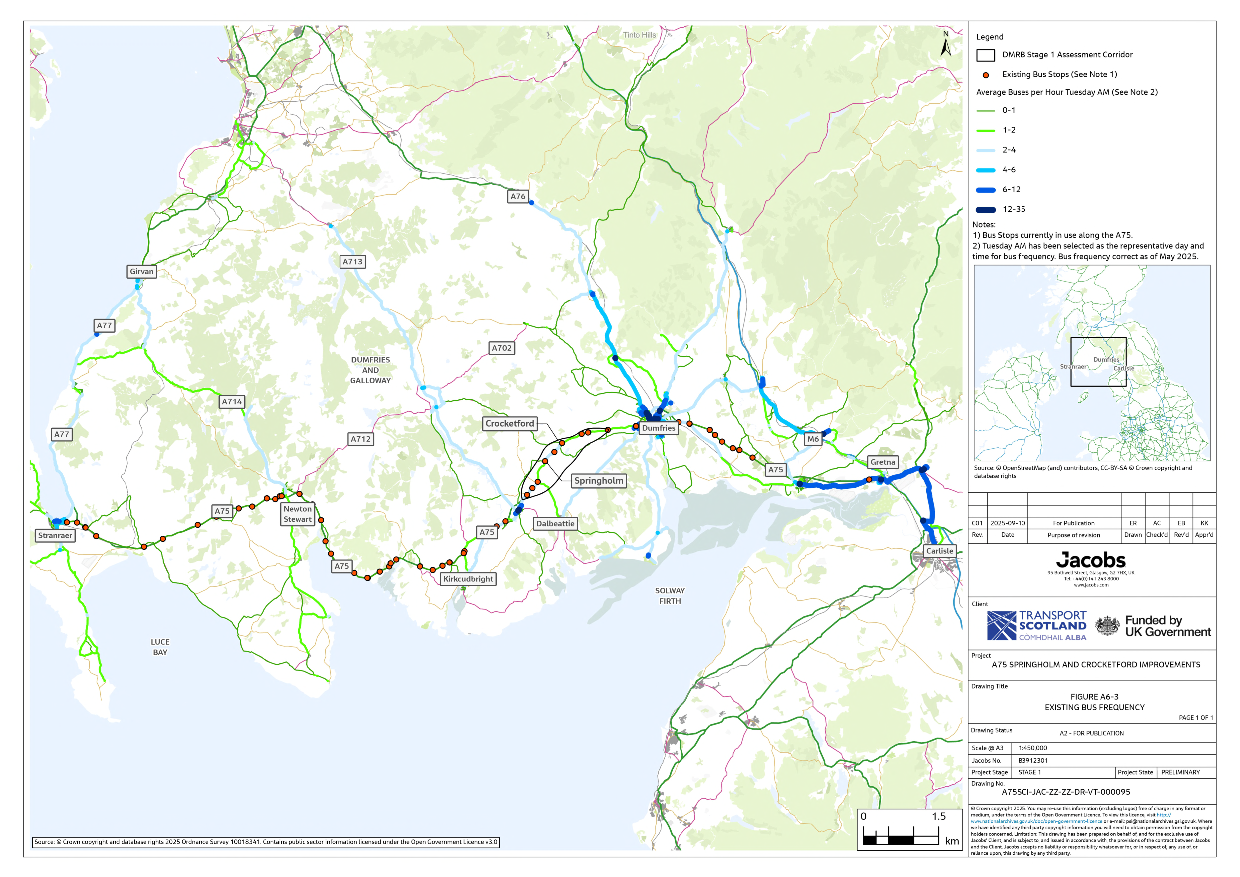
The following Appendix A figures visually display some of the data assessed and detailed within the A75 DMRB Stage 1 Report.

A figure showing the A75 Springholm and Crocketford Improvements assessment corridor which spans between the Drummore and Allanton Roundabouts. Castle Douglas is situated just west of the assessment corridor, and Dumfries to the east.
Figure A1-1: Assessment Corridor
A figure showing the National Cycling Network Route 7 and core paths within the assessment corridor. The improvement strategies are also shown to give context on the potential interactions with these.
Figure A2-1(A): Environmental Constraints Overview – National Cycle Network and Core Paths
A figure showing the landscape and cultural heritage areas within the assessment corridor. It shows conservation areas, scheduled monuments, the local landscape character area, biosphere reserves and listed buildings. The improvement strategies are also shown to give context on the potential interactions with these.
Figure A2-1(B): Environmental Constraints Overview – Landscape and Cultural Heritage Areas
A figure showing woodlands and protected sites within the assessment corridor. It shows areas of native woodland survey of Scotland, ancient woodland inventory, local wildlife sites and sites of special scientific interest. The improvement strategies are also shown to give context on the potential interactions with these.
Figure A2-1(C): Environmental Constraints Overview – Woodlands and Protected Sites
A figure showing areas of peatland and aquifers within the assessment corridor. It shows areas of locally important aquifers and peatland. The improvement strategies are also shown to give context on the potential interactions with these.
Figure A2-1(D): Environmental Constraints Overview – Peatland Aquifers
A map illustrating areas of flooding, surface water and water bodies within the assessment corridor. It shows locations of OS open rivers, surface water bodies and areas which may flood due to surface water and small watercourses and areas which may flood from fluvial sources. The improvement strategies are also shown to give context on the potential interactions with these.
Figure A2-1(E): Environmental Constraints Overview – Flooding, Surface Water and Waterbodies
A figure showing OS Terrain contours at 10m height intervals within the assessment corridor. The improvement strategies are also shown to give context on the potential interactions with these.
Figure A2-1(F): Environmental Constraints Overview – Contours
A figure showing settlements within the assessment corridor. It shows the settlements with less than 500 people including Springholm and Crocketford and the larger settlement of Castle Douglas which has more than 500 people. The improvement strategies are also shown to give context on the potential interactions with these.
Figure A2-1(G): Environmental Constraints Overview – Settlements
A figure showing the superficial geology within the assessment corridor. It shows areas of alluvium, glaciofluvial deposits, peat, superficial sediment deposits and Devensian till. In addition BGS boreholes where peat has been identified have also been included. The improvement strategies are also shown to give context on the potential interactions with these.
Figure A2-2: Superficial Geology
A figure showing the solid geology within the assessment corridor. It shows areas of wacke formations, mafite, felsite and microdioritic rock, lamprophyres and microdiorite porphyritic. The improvement strategies are also shown to give context on the potential interactions with these.
Figure A2-3: Solid Geology
A figure showing chainages along the existing A75 within the assessment corridor. These are used as markers to assist with locations within the DMRB Stage 1 Report. Chainage zero starts at Allanton roundabout and chainage 18500 finishes at Drummore roundabout.
Figure A2-4: Existing A75 with Chainages
A map illustrating the road standard of the A75 trunk road within the assessment corridor. Within the assessment corridor, the A75 is primarily single carriageway with three overtaking opportunities.
Figure A2-5: Existing Road Standard
A figure showing speed limits on the A75 Trunk Road within the assessment corridor and across the wider geographical context. Within the assessment corridor, the A75 is primarily national speed limit (60mph) dropping to 30mph through Springholm and Crocketford.
Figure A2-6: Existing Speed Limits
A figure showing the locations of existing structures on the A75 within the assessment corridor. Two structures are identified Ramhill New Bridge crossing Urr Water and Springholm Bridge over Culshan Burn.
Figure A2-7: Existing Structures
A figure showing existing junctions on the A75 within the assessment corridor. It shows existing junctions with A-Roads, B-Roads and C-Roads and/or unclassified roads.
Figure A2-8: Existing Junctions
A figure showing layby provision along the A75 within the assessment corridor. A total of 13 laybys are shown which includes five lay-bys between the Allanton Roundabout and Springholm, two between Springholm and Crocketford, and six between Crocketford and Drummore Roundabout.
Figure A2-9: Existing Lay-bys
A figure showing existing traffic signals along the A75 within the assessment corridor. There are a total of four signals.
Figure A2-10: Existing Traffic Signals
A figure showing bus stops and the average frequency of bus services per hour on a Tuesday morning along the A75 within the assessment corridor from information collated in May 2025.
Figure A2-11: Existing Bus Routes
A figure showing the posted diversion routes resulting from closures along the A75. There are two diversions routes resulting from closures on the A75 between Garroch to Haugh of Urr and Cardoness Castle to Newton Stewart.
Figure A2-12: Posted Diversion Routes
A figure showing the assessment corridor census output areas.
Figure A2-13: Assessment Corridor Census Output Areas
A figure showing the Scottish Index of Multiple Deprivation (SIMD) decile rankings for data zones within the assessment corridor as of 2020. The assessment corridor exhibits SIMD rankings ranging from five to eight, indicating moderate to low levels of deprivation. Crocketford and Springholm are situated in data zones with a ranking of five, the most deprived of data zones within the assessment corridor specifically.
Figure A2-14: Scottish Index of Multiple Deprivation - Overall
A figure showing the Scottish Index of Multiple Deprivation (SIMD) decile rankings specifically for the geographic access to key services indicator. Four of the five data zones shown have a ranking of one for the Geographic Access domain, indicating very poor access to services. This is true for the data zones encompassing the settlements of Crocketford and Springholm, as well as Haugh of Urr, Milton and Kirkpatrick Durham and the surrounding rural areas. The exception is the data zone east of Castle Douglas, which has a ranking of two that this still suggests poor access to services.
Figure A2-15: Scottish Index of Multiple Deprivation – Geographic Access
A figure showing the six proposed improvement strategies proposed at DMRB Stage 1. These all lie within the assessment corridor.
Figure A3-1: Improvement Strategies
A figure showing the automatic traffic counter sites along the A75 within the assessment corridor and their respective two-way average annual daily traffic flows for 2024 with exception of flows between Drummore roundabout and Dumfries which have been estimated based on typical months available.
Figure A6-1: Transport Scotland Automatic Traffic Counter (ATC) Sites
A figure showing all accident locations between 2012 and 2024 within the assessment corridor. There are a number of accidents across the length of the road of all severities including slight, serious and fatal accidents.
Figure A6-2: Accidents
A figure showing bus stops and the average frequency of bus services per hour on a Tuesday morning along the A75 and throughout the region from information collated in May 2025. The map shows a greater frequency of buses in and around Dumfries but generally fewer services to the west of Dumfries, particularly on the A75.
Figure A6-3: Existing Bus Frequency