Existing Conditions
Introduction
This section of the report describes the existing conditions within the assessment corridor. Key environmental constraints within the assessment corridor are shown in Appendix A, Figure A2-1 (A-G).
Topography and Land Use Overview
Route Characteristics
(a) Topographical Features
The topography within the assessment corridor is comprised of undulating lowlands and hills with higher elevations to the north and south. The lowlands are interspersed with shallow valleys with a network of watercourses and water bodies. The landscape is characterised by an irregular patchwork of field/agricultural land defined by differing boundaries including trees, hedgerows, ditches and dry-stone walls. Interspersed between the field network are numerous small, scattered woodland areas of both conifer plantation and broadleaf species.
Travelling eastbound from Allanton Roundabout which is at approximately 80m Above Ordnance Datum (AOD), the elevation of the existing A75 gradually falls to approximately 20m AOD until reaching the Urr Water crossing. Along this section, the surrounding land consists of flatlands, with occasional forested areas.
Eastbound from the Urr Water crossing, the elevation of the existing A75 increases to approximately 90m AOD towards the settlement of Springholm. The adjacent topography is characterised by flatlands, with occasional forested areas. The existing A75 crosses or lies adjacent to Urr Water, Garmartin Burn, Spottes Burn and several unnamed minor water courses within this section.
Through Springholm, the existing A75 is surrounded by urban land and gradually rises to approximately 110m AOD. The existing A75 crosses the Culshan Burn/ Spottes Burn at the south of Springholm.
The existing A75 immediately north of Springholm is rural once again, with flat terrain, consisting mainly of flatlands and occasional forested areas. The existing A75 lies adjacent to the Bancailzie Lane watercourse. This area includes major water bodies at Auchenreoch Loch to the west and Milton Loch to the east. The land around the Auchenreoch Loch is between 100-110m AOD and the land around Milton Loch is between 120-130m AOD.
The existing A75 then passes through Crocketford, another urban area, where the land remains at approximately 100-120m AOD. The existing A75 lies adjacent to Crocketford Burn on the eastbound approach to Crocketford.
The section immediately north of Crocketford is rural once again, with flat terrain, consisting mainly of flatlands and occasional forested areas. Here, the existing A75 passes between the small farming hamlets of Brae and Henderland. The existing A75 lies adjacent to the Larglea Burn and Bogrie Lane watercourse in the west until it reaches the Drummore Roundabout.
(b) Existing Land Use
The land use in the vicinity of the improvement strategies varies widely, often in accordance with the surrounding topography. The existing A75 constitutes an important link for the Loch Ryan port facilities. The principal settlements along the route are connected by the existing A75 for use by local and long-distance commuters, tourists, agricultural and commercial freight transport and other commercial services. The main land uses surrounding the existing A75 are listed in the following broad categories:
- Settlements with varied residential and commercial components
- Sparsely populated agricultural sites
- Uninhabited or sparsely populated natural areas
The existing A75 currently passes through Springholm and Crocketford. Regular travel between Springholm, Crocketford and further afield is common for local residents to access work locations, commercial areas and schools. Other settlements in the area include Kirkpatrick Durham, Haugh of Urr and the town of Castle Douglas. Additionally, there are numerous smaller settlements and individual dwellings scattered in the area surrounding the existing A75 between Dumfries and Castle Douglas.
Agricultural land use is common in lowlands and comprises a majority of the land surrounding the existing A75. The landscape is characterised by an irregular patchwork of fields and agricultural land, defined by differing boundaries including trees, hedgerows, ditches and drystone walls. In addition, there are numerous small, scattered woodlands of both conifer plantation and broadleaf species interspersed between the field boundaries.
While the existing A75 is used as a transport connection to outside destinations, the carriageway itself forms a physical barrier between some agricultural properties. Farm vehicles often use the existing A75 to access various fields along the route, which can attribute to traffic congestion, delays and safety hazards.
Natural areas which are uninhabited or sparsely populated comprise a minority of the land use served by the existing A75. These areas include forested areas and river valleys.
Walking, Cycling and Horse-Riding (WCH) Provisions
The level of existing WCH provision varies throughout the assessment corridor with an increased number of facilities located within settlements including Springholm and Crocketford.
Within the assessment corridor, existing WCH facilities include:
- Core paths, which include rights of way by foot, horseback, cycle or a combination of those.
- Rights of way and National Cycle Network (NCN) routes not designated as core paths.
- Informal WCH routes.
The WCH facilities within settlements mainly comprise footways or shared use routes.
There are two undesignated local paths within the assessment corridor along the existing A75 outwith Springholm and Crocketford:
- A local path, signposted as a shared use route for cyclists and pedestrians which follows an alignment parallel to the existing A75, starting east of Barfil and ending east of Glenkiln Farms.
- Local paths on both the eastbound and westbound side of the existing A75 which link two bus lay-bys to Drummore Roundabout.
The NCN7 runs within the assessment corridor along the Old Military Road which is located between 0.5km to 3km to the south east of the existing A75.
A number of core paths are situated within the assessment corridor, these and NCN7 are shown in Appendix A, Figure A2-1(A).
Environmental Conditions
The existing environmental conditions are shown on the Key Constraints Plans in Appendix A, Figure A2-1. Including, but not limited to, the following:
- Ecological designated sites and habitats: such as Sites of Special Scientific Interest (SSSIs), Ancient/Semi-Natural Ancient Woodland Sites and Native Woodland.
- Historic Environment Landscape Designations: such as Conservation Areas, Scheduled Monuments and Listed Buildings.
- Water Bodies.
Settlements
The villages of Springholm and Crocketford are the only two remaining settlements that the existing A75 directly passes through, with Brae situated adjacent to the road. The existing A75 also passes to the south of the villages of Clarebrand, Old Bridge of Urr, Kirkpatrick Durham and Shawhead and to the north of the villages of Haugh of Urr, Hardgate and Milton. The town of Castle Douglas is located directly south of the Allanton Roundabout.
The settlements generally include features such as Listed Buildings, farm buildings, local residences and commercial properties.
Topography and the Water Environment
The topography is comprised of undulating lowlands and hills with higher elevations to the north and south of the assessment corridor. Shallow valleys and a network of watercourses are interspersed throughout the lowlands. The largest water bodies within the assessment corridor are Auchenreoch Loch and Milton Loch with the latter being a designated SSSI. The largest watercourse within the study area is Urr Water.
Geology
A review of the British Geological Survey (BGS) GeoIndex indicates that the superficial geology within the assessment corridor generally comprises Alluvium, Peat, Glaciofluvial and Glacial Till deposits. These materials are indicated around Springholm and Crocketford. Appendix A, Figure A2-2 shows the superficial geology within the assessment corridor and the BGS boreholes which have identified peat. The underlying bedrock comprises wacke, consistent with strong but potentially fractured sedimentary formations. It is mainly described as greywacke-type sandstone associated with the Carghidown, Cairnharrow and Kirkmaiden Formations. BGS mapping typically to the south of the existing A75, indicates areas where there is limited superficial deposits suggesting bedrock may be at or near surface. Appendix A, Figure A2-3 shows the solid geology (underlying bedrock) within the assessment corridor.
An initial high level desktop review has been informed by selected digitised historical borehole records. The field descriptions and geology codes from these exploratory holes have allowed for a preliminary classification of geological units, which broadly align with published geological mapping. A summary of the sequence of primary geological units identified is as follows:
- Topsoil (TP): Present in the upper horizon of nearly all locations, representing organic rich material of variable thickness.
- Alluvium (ALV): Typically, soft deposits associated with current or historic watercourses and drainage features.
- Glaciofluvial (GLF): Typically, coarse grained sediments with some finer-grained layers.
- Diamicton Till (TILLD): A glacially deposited, heterogenous mixture of clay, sand gravel, and silt, often very stiff and compact, forming the dominant superficial unit across many boreholes.
- Peat: Organic peat deposits, found in soft, fibrous or amorphous form; highly compressible and variable in thickness.
- Wacke: Bedrock Representing hard, greywacke-type sandstone associated with the Carghidown, Cairnharrow and Kirkmaiden Formations. These units are competent but may be fractured or weathered at the surface.
Although no made ground has been confirmed at this stage, historical land use near existing infrastructure would be considered in future phases of investigation.
Carriageway Features
Introduction
This section of the report provides an overview of existing carriageway features, including alignment and cross-section variations, speed limits, pavement condition and structural characteristics. Junctions, accesses, lay-bys and rest areas are also described.
Chainages (abbreviated as Ch.) noted in this report correspond to location references outlined in Appendix A, Figure A2-4.
Cross-Section
The existing A75 within the assessment corridor is a single two-lane (S2) carriageway with sections of WS2+1 carriageway, as shown in Appendix A, Figure A2-5. The section below summarises the cross section of the existing A75 and indicates any non-compliances from typical cross-sections outlined in the following standards:
- DMRB CD 109 – Highway link design , hereafter referred to as CD 109
- DMRB CD 116 – Geometric design of roundabouts , hereafter referred to as CD 116
- DMRB CD 127 – Cross-sections and headrooms , hereafter referred to as CD 127
From ch.30 to ch.500, there is a differential acceleration lane (DAL) cross-section in the eastbound direction. This cross-section includes an approximately 10.5m wide carriageway with two eastbound approximately 3.5m wide lanes from the Allanton Roundabout. A double white line separates the two lanes from an approximately 3.5m wide westbound lane to the roundabout. In addition, the carriageway includes two approximately 2m wide verges, one on either side of the carriageway. This cross-section is not in accordance with CD 116, which requires a 1m hardstrip on either side of the carriageway and 2.5m verges.
From ch.500 to ch.700, there is a changeover as the two lanes change from the eastbound to the westbound direction.
From ch.700 to ch.2670, the cross-section is a Wide Single 2 (WS2) climbing lane section with two lanes in the westbound direction. The climbing lane consists of an approximately 10.5m wide carriageway with two approximately 3.5m wide lanes in the westbound direction and an approximately 3.5m wide lane in the eastbound direction, separated by a double white line. In addition to this, the carriageway includes two approximately 2m verges, one each on either side of the carriageway. This cross-section is not in accordance with CD 127, which requires a 1m hardstrip on either side of the carriageway and 2.5m wide verges.
From ch.2670 to ch.12550, the existing A75 is a single carriageway. The carriageway is approximately 7.3m wide with one approximately 3.65m wide lane in each direction. Through settlements approximately 1.8-2.0m wide footways are included in place of verges. The single carriageway cross-section is not designed in accordance with CD 127 which requires a 1m wide hardstrip on either side of the carriageway.
From ch.12550 to ch.13410, the cross-section is a WS2+1 with the two lanes in the westbound direction. This cross-section is similar to that of the WS2 section between ch.700 and ch.2670, with the exception of having a coloured and hatched double white line approximately 1m wide separating the directions of travel rather than a double white line and a 1m hardstrip on either side of the carriageway.
From ch.13410 to ch.18500, the cross-section reverts to an approximately 7.3m wide single carriageway, with two approximately 3.65m wide lanes in each direction and an approximately 2.5m wide verge on each side of the carriageway. This section is not in accordance with CD 127 which requires a 1m wide hardstrip on either side of the carriageway.
Speed Limits and Design Speed
The national speed limit for single and WS2+1 carriageway applies to the full length of the existing A75 within the assessment corridor, except where the road passes through Springholm and Crocketford, where a speed limit of 30mph applies, as shown in Appendix A, Figure A2-6 and summarised in Table 2‑1.
|
Start Ch. (m) |
End Ch. (m) |
Speed Limit (mph) |
HGV Speed Limit (mph) |
Design Speed (kph) |
|
30 |
6590 |
60 |
40 |
100 |
|
6590 |
7940 |
30 |
30 |
70 |
|
7940 |
10700 |
60 |
40 |
100 |
|
10700 |
11200 |
30 |
30 |
70 |
|
11200 |
19000 |
60 |
40 |
100 |
Alignment Relaxations and Departures from DMRB Standards
A high-level assessment was undertaken to identify alignment relaxations and departures from DMRB Standards on the existing A75 within the assessment corridor. This was done by creating a model of the existing A75 alignment using a LiDAR surface. A number of relaxations and departures from standard were identified including horizontal radii, crest and sag curves and stopping sight distance. These findings were supported by relaxations and departures reported as part of the 1998 A75 Gretna to Stranraer Route Action Plan Study. Existing departures will be assessed further at DMRB Stage 2.
Pavement
The pavement composition of the existing A75 within the assessment corridor was assessed by reviewing Transport Scotland’s Asset Management Performance System (AMPS) data which includes details of existing pavement material, thickness, and structural properties. Between the Allanton and Drummore roundabouts, the existing A75 consists primarily of flexible pavement with a bituminous surface course. However, there is a 150m section where a cement binder is used near Allanton Roundabout. The condition of the existing pavement will be assessed at DMRB Stage 2.
Drainage
The existing A75 within the assessment corridor is drained via over the edge and/or combined carrier filter drains in the primarily rural sections of the route and kerb and gully systems within the built-up areas in and around Springholm and Crocketford. The extents of the road drainage network in the vicinity of the scheme or outfall locations are unknown at this time. It has been assumed that road runoff is not currently subject to attenuation or pollution treatments. It has also been assumed that untreated runoff is discharged to the nearest watercourse.
Structures
A review of existing structures within the assessment corridor was undertaken based on recent inspection reports and records. There are two existing underbridge structures along the existing A75. The location of these structures is shown in Appendix A, Figure A2-7.
In general, the two existing structures are in a poor to reasonable condition with some repairs required. The two bridges lie within a single carriageway section of the existing A75 and are not in compliance with current design standards. A description of the existing structures has been provided below including details of the expected maintenance requirements based on the most recent available inspection reports.
A75 410 Ramhill New Bridge is a three-span structure with a steel-concrete composite deck. The structure carries the existing A75 over Urr Water and is approximately 47m in length. The bridge comprises six steel universal beams acting compositely with a 215 mm thick reinforced concrete deck slab. The deck superstructure is supported on skeletal full height reinforced concrete abutments, comprising cross heads, supported on three vertical columns and spread foundations at the east and west ends. Two sets of reinforced concrete piers provide intermediate support to the deck. All the foundations are formed of spread reinforced concrete footings. Maintenance requirements include remedials to waterproofing, carriageway surfacing defects and safety barriers, expansion joint replacement and creating bearing shelf drainage.
A75 400 Springholm Bridge is a single span structure with a steel trough deck topped with concrete infill. The structure carries the existing A75 over Culshan Burn and is approximately 5m in length. There is granite block cladding over the abutments, spandrel walls and wing walls. Maintenance requirements include remedials to the paintwork, remedials to address steelwork corrosion, remedials to exposed reinforcement and remedials to carriageway surfacing defects.
Junctions and Accesses
There are approximately 16 junctions and 89 accesses along the existing A75 within the assessment corridor. They provide connections to local roads, villages, towns and community facilities and comprise of:
- Three A-road Junctions
- Three B-road Junctions
- 10 C-road / Unclassified Junctions
- 14 Residential / Commercial Direct Accesses (Outwith Springholm and Crocketford)
- 24 Access Tracks
- Approximately 51 Field Accesses
Junctions on the existing A75 within the assessment corridor are shown in Appendix A, Figure A2-8. The six major junctions with A and B-roads are noted in Table 2‑2.
| Adjoining Road(s) | Approx. Chainage (m) | Junction Type |
|---|---|---|
|
A75/A745 |
0 |
Roundabout |
|
B795 |
930 |
Priority Junction |
|
B794 |
3200 |
Priority Junction |
|
B794 |
3550 |
Priority Junction |
|
A712 |
10960 |
Priority Junction |
|
A75 / C-roads |
18550 |
Roundabout |
In addition to the junctions and accesses noted, within Springholm and Crocketford along the existing A75, there are a significant number of direct accesses some of which allow for multiple residential and commercial properties to access the existing A75.
Lay-bys and Rest Areas
There are 13 existing lay-bys along the existing A75 within the assessment corridor and these are shown in Appendix A, Figure A2-9. Each lay-by has been categorised as Type A or Type B in accordance with DMRB CD 169 – The design of lay-bys, maintenance hardstandings, rest areas, service areas and observation platforms , hereafter referred to as CD 169. For the purpose of this assessment, Type A lay-bys have a physical segregation island between the existing A75 and the lay-by whereas a Type B lay-by does not have a physical segregation island. A summary of the lay-by layouts found along the existing A75 within the assessment corridor are summarised in Table 2‑3.
Table 2‑3: Summary of existing lay-by types
| Lay-by Types | Eastbound | Westbound |
|---|---|---|
|
Type A |
6 |
4 |
|
Type B |
0 |
3 |
From a desktop review it has been assessed that the lay-bys on the existing A75 within the assessment corridor are not compliant with the standards outlined in CD 169 or Roads for All: Good Practice Guide for roads .
Existing bus lay-bys on the existing A75 within the assessment corridor are summarised in Existing Conditions, Existing Bus Facilities.
There are no formal rest areas along the existing A75 within the assessment corridor. However, there are locations where road users may stop in Springholm, Crocketford, and at The Inn on the Loch.
Roadside Features
Signage
Traffic signs on the existing A75 within the assessment corridor are mounted in the verge and include regulatory, warning and informatory signs. All signs on the existing A75 within the assessment corridor are in English only.
Intelligent Transport Systems (ITS)
There are a number of ITS in place along the existing A75 within the assessment corridor, these include two Vehicle Activated Signs (VAS) in Springholm, one on entry from the eastbound and one on entry from the westbound. A further four VAS are in place in Crocketford, one on entry from the eastbound, one on entry from the westbound and two in the vicinity of the traffic signals. In addition, there are two sets of speed activated traffic signals in Springholm.
From a desktop review, it was noted that there are no fixed speed cameras or other ITS located along the existing A75 within the assessment corridor, although there are traffic signs which indicate that speed cameras may be present.
Traffic Signals
The existing A75 within the assessment corridor consists of three traffic signals in Springholm and one set of traffic signals in Crocketford. Two of the signals in Springholm are speed activated and do not have a pedestrian crossing, and the other two signals provide a pedestrian crossing over the existing A75. These are shown in Appendix A, Figure A2-10.
Road Lighting
Road lighting is currently provided at the following locations on the existing A75 within the assessment corridor:
- On approach to and through Springholm and Crocketford, where the speed limit is 30mph.
- On approach to and around the Allanton and Drummore roundabouts.
Road Restraint Systems (RRS)
Road Restraint Systems (RRS) are provided at various points along the length of the existing A75 within the assessment corridor. 22 sections of RRS have been identified as including ramp style terminals. These terminals are non-compliant as outlined by DMRB CD 377 – Requirements for road restraint systems which states that for single carriageway roads with a speed limit of 50mph or more, terminals for safety barriers are required to have a performance class of P4 and be energy absorbing.
Weather Station
Across the trunk road network there are a number of road monitoring weather stations. These provide real time information on the state of the road surface. There is one weather station at Crocketford on the existing A75 within the assessment corridor.
Public Transport Facilities
Introduction
Locations of bus and rail facilities have been evaluated to determine their distribution along the existing A75 within the assessment corridor.
Existing Bus Facilities
A desktop review was carried out to identify the existing bus stops and services which run along the existing A75 within the assessment corridor. 11 of the 19 bus stops identified do not have associated signage or road markings designating them as bus stops. Details of the existing bus stops are summarised in Table 2‑4 based on information collated for bus operation in May 2025.
| Direction | Approximate Chainage (m) | Stop Description | Features | Services |
|---|---|---|---|---|
|
Westbound |
110 |
Not applicable |
Bus lay-by with signage |
Not applicable |
|
Eastbound |
950 |
Castle Douglas, Gerranton |
None |
Stagecoach 500, 501 McCall’s Coaches 502 Dumfries and Galloway 555 |
|
Westbound |
950 |
Castle Douglas, Gerranton |
None |
Stagecoach 500, 501 McCall’s Coaches 502 |
|
Eastbound |
2230 |
Castle Douglas, Dunjarg |
None |
Stagecoach 500, 501 McCall’s Coaches 502 Dumfries and Galloway 555 |
|
Westbound |
2230 |
Castle Douglas, Dunjarg |
None |
Stagecoach 500, 501 McCall’s Coaches 502 |
|
Eastbound |
3520 |
Haugh of Urr, Chapelton Cottages |
None |
Stagecoach 501 McCall’s Coaches 502 Dumfries and Galloway 555 |
|
Westbound |
3520 |
Haugh of Urr, Chapelton Cottages |
None |
Stagecoach 501 McCall’s Coaches 502 |
|
Westbound |
7120 |
Springholm, Village |
Bus lay-by |
Stagecoach 500 McCall’s Coaches 502, 503 Dumfries and Galloway 555 |
|
Eastbound |
7250 |
Springholm, Village |
On street bus stop markings and bus shelter |
Stagecoach 500 McCall’s Coaches 502, 503 Dumfries and Galloway 555 |
|
Eastbound |
9200 |
Crocketford, Lochview Motel |
None |
Stagecoach 500 McCall’s Coaches 502, 503 Dumfries and Galloway 555 |
|
Westbound |
9200 |
Crocketford, Lochview Motel |
None |
Stagecoach 500 McCall’s Coaches 502, 503 Dumfries and Galloway 555 |
|
Eastbound |
11020 |
Crocketford, Village |
Lay-by and sign |
Stagecoach 500 McCall’s Coaches 502, 503, 521 Dumfries and Galloway 555 |
|
Westbound |
11050 |
Crocketford, Village |
Bus lay-by and bus shelter |
Stagecoach 500 McCall’s Coaches 502, 521 Dumfries and Galloway 555 |
|
Eastbound |
14400 |
Crocketford, Brae |
None |
Stagecoach 500 McCall’s Coaches 502, 521 Dumfries and Galloway 555 |
|
Westbound |
14400 |
Crocketford, Brae |
None |
Stagecoach 500 McCall’s Coaches 502, 521 Dumfries and Galloway 555 |
|
Eastbound |
15400 |
Shawhead, Road End |
None |
Stagecoach 500 McCall’s Coaches 502, 521 Dumfries and Galloway 555 |
|
Westbound |
15400 |
Shawhead, Road End |
Bus lay-by and bus shelter |
Stagecoach 500 McCall’s Coaches 502, 521 Dumfries and Galloway 555 |
|
Eastbound |
18300 |
Lochfoot, Road End |
Bus lay-by and sign |
Stagecoach 500 McCall’s Coaches 502, 521 Dumfries and Galloway 555 |
|
Westbound |
18380 |
Lochfoot, Road End |
Bus lay-by |
Stagecoach 500 McCall’s Coaches 502, 521 Dumfries and Galloway 555 |
The timetables for the local bus services operating along the existing A75 within the assessment corridor are provided in 9.1.59.1.1.1.1.1.2. Appendix A, Figure A2-11 shows their routes.
In June 2025, Stagecoach announced that it would be ending most of its services in the Dumfries and Galloway region by the end of August 2025 including the 500 and 501 services which operate on the existing A75 within the assessment corridor. Changes to bus services will be considered and reported in the DMRB Stage 2 Assessment.
Existing Rail Facilities
A review of rail facilities has been undertaken and has identified no train stations or railway lines within the vicinity of the proposed scheme. The nearest train station is located in Dumfries.
Traffic and Safety Characteristics
Traffic Conditions
Annual Average Daily Traffic (AADT) flows along the existing A75 have been determined using Automatic Traffic Counter (ATC) data obtained from Transport Scotland’s National Traffic Data System (NTDS). The assessment corridor contains two permanent ATC sites. Additionally, there are three ATC sites situated outside the immediate extent of the assessment corridor with a site located to the east of Drummore Roundabout, a site locate to the of Garroch Roundabout and a site located to the south of Allanton Roundabout. There are varying degrees of data reliability at each site and therefore the most representative months and year has been selected for analysis.
Based on the most recent available data, the estimated daily traffic flow ranges from approximately 6,200 vehicles (south of Allanton Roundabout, near Castle Douglas) to 16,000 vehicles (east of Garroch Roundabout, near Dumfries). Traffic levels generally decrease from Garroch Roundabout towards Allanton Roundabout throughout the assessment corridor from east to west. The specific counter sites within the assessment corridor demonstrate traffic flows lie within this range at approximately 9,000 vehicles per day, as shown in Table 2‑5.
The volume of Heavy Goods Vehicles (HGVs) remains relatively consistent across the assessment corridor, comprising approximately 13% to 16% of daily traffic.
Further details on traffic and safety characteristics are included within the Traffic and Economic Assessment chapter of this report.
|
A75 Section |
AADT (rounded to nearest 100) |
|
A75 south of Allanton Roundabout (Castle Douglas) (2024) |
6,200 |
|
A75 south of Springholm (2024) |
9,000 |
|
A75 Crocketford (2023) |
9,300 |
|
A75 east of Drummore Roundabout (2024) |
10,700 |
|
A75 east of Garroch Roundabout (2024) |
16,000 |
Accident Analysis
Transport Scotland has provided accident data for the full A75 Trunk Road from Gretna to Stranraer covering the period from 2012 to 2024. Accident data for a minimum five year period is typically used in accident analysis, however data was requested over a longer period to allow for analysis of the pre- and post-COVID pandemic accident trends. This approach was adopted due to the atypical road conditions experienced during the COVID-19 pandemic travel restrictions. Consequently, data from 2020 and 2021 can be excluded from the analysis, as the travel restrictions and the significant reduction in traffic travelling on the road network means accidents and the associated severities recorded over this period may not be representative of the accident characteristics on the A75. Accident data is discussed in further detail in the Accident Data section of the Traffic and Economics chapter of this report.
For the full A75 Trunk Road, accident rates vary relative to the national average accident rates depending on the period examined. The period of 2022 to 2024, after the travel restrictions imposed during COVID-19 pandemic were lifted (post COVID-19) shows an accident rate of 0.084 personal injury accidents per million vehicle kilometres (PIA/MvKM) for the A75 Trunk Road, which is approximately 1.5 times the national rate of 0.055 PIA/MvKM for non-built-up roads. The accident rate comparison for the full A75 Trunk Road over various time periods is summarised in Table 2‑6. Note that the national accident rate data is only currently available to the end of 2023, however this does not materially impact the comparison ratio shown.
| Period | A75 Trunk Road Accident Rate (PIA/MvKM) | National Accident Rate – Non-Built-Up (PIA/MvKM) | Local/National Accident Rate Ratio |
|---|---|---|---|
|
2012-2024 |
0.085 |
0.080 |
1.1 |
|
2012-2024 (Excluding 2020-2021) |
0.088 |
0.085 |
1.0 |
|
2012-2019 (Pre-COVID) |
0.091 |
0.093 |
1.0 |
|
2018-2024 (Excluding 2020-2021) |
0.079 |
0.064 |
1.2 |
|
2022-2024 (Post-COVID) |
0.082 |
0.055 |
1.5 |
On the A75 in Springholm and Crocketford, considered as built-up areas for the accident analysis due to the 30mph speed limit, there are changes in accident rates evident over time, as summarised in Table 2‑7. For the period 2018-2024 (excluding COVID-impacted years of 2020 and 2021), the accident rate for the A75 in Crocketford was 0.119 PIA/MvKM and in Springholm the accident rate was 0.087 PIA/MvKM, with both exceeding the national average of 0.077 PIA/MvKM for built-up areas. Note that the national accident rate data is only currently available to the end of 2023, however this does not materially impact the comparison ratio shown. The period from 2022 to 2024, after the travel restrictions imposed during COVID-19 pandemic were lifted (post COVID-19) shows higher accident rates, with the accident rate on the A75 in Crocketford at 0.194 PIA/MvKM (approximately 3.0 times the national rate) and in Springholm at 0.146 PIA/MvKM (approximately 2.2 times the national rate), compared to the national rate of 0.065 PIA/MvKM for built-up areas. Although it should be noted that as these accident rates are calculated over a shorter timeframe of three years, they may not represent a longer-term trend.
| Period | Crocketford Accident Rate (PIA/MvKM) | Springholm Accident Rate (PIA/MvKM) | National Accident Rate - Built Up (PIA/MvKM) | Crocketford/ National Accident Rate Ratio | Springholm/ National Accident Rate Ratio |
|---|---|---|---|---|---|
|
2012-2024 |
0.096 |
0.086 |
0.134 |
0.7 |
0.6 |
|
2012-2024 (Excluding 2020-2021) |
0.111 |
0.099 |
0.147 |
0.8 |
0.7 |
|
2012-2019 (Pre-COVID) |
0.077 |
0.082 |
0.167 |
0.5 |
0.5 |
|
2018-2024 (Excluding 2020-2021) |
0.119 |
0.087 |
0.077 |
1.5 |
1.1 |
|
2022-2024 (Post-COVID) |
0.194 |
0.146 |
0.065 |
3.0 |
2.2 |
Diversion Routes
When incidents or planned maintenance occur on the existing A75, the recommended diversion routes are often via minor roads that pass through small villages and can result in significantly longer journey distances and increased travel times. Table 2‑8 provides a comparative analysis of the impact on distance travelled between the existing A75 Trunk Road and the recommended diversion routes for a closure within the assessment corridor, and a closure further west between Gatehouse of Fleet and Newton Stewart, as well as the number of incidents which has historically resulted in a road closure on these sections.
The recommended diversion route between Garroch Loaning (Dumfries) and Haugh of Urr Road End (south of Springholm), the main diversion route for the assessment corridor, is approximately 28km, adding approximately 9km of additional distance travelled compared to the existing A75. This section of the existing A75 experienced 11 incidents resulting in a full or partial road closure between 2018 and 2024, according to incident reporting data provided by Transport Scotland.
The longest recommended diversion route for the existing A75 is for a closure between Cardoness Castle Junction (Gatehouse of Fleet) and Calgow Junction (Newton Stewart). This diversion adds approximately 105km to the journey for both eastbound and westbound traffic compared to the existing A75. Between 2018 and 2024, this section of the existing A75 experienced 17 incidents that resulted in either a full or partial road closure. Over the full A75 Trunk Road (between the A74(M) slip and Innermessan A77), the road was fully or partially closed for sections on 119 occasions between 2018 and 2024.
Both diversion routes are illustrated in Appendix A, Figure A2-12.
|
Section of Closure |
Approx. Length of Closure (km) |
Direction |
Approx. Diversion Length (km) |
No. of Incidents Resulting in Closure (2018-2024) |
|
Garroch Loaning and Haugh of Urr Road End |
19.2 |
Eastbound and westbound |
28.0 |
11 |
|
Cardoness Castle Junction and Calgow Junction |
25.1 |
Eastbound and westbound |
131.0 |
17 |
Journey Times and Reliability
Journey times on the existing A75 within the assessment corridor have been analysed using INRIX data for both 2019 and 2024, over a 24 hour period. The analysis reveals minimal differences in journey times between these years, with changes in average journey times being less than one minute. This stability in journey times indicates relatively consistent travel conditions over the six-year period.
The average weekday journey time is approximately 15 minutes and 30 seconds in both directions, and the average journey time is approximately 45 seconds lower during weekends. The daily profiles show weekday journey times are typically higher from early morning, peaking around midday before gradually decreasing. The weekend journey times show a flatter profile with lower maximum journey times than the weekdays. Monthly analysis of 2024 data indicates consistent journey times throughout the year, even with the increase in AADT traffic flows during the summer months.
Further details on journey times and reliability are included within the Traffic and Economic Assessment chapter of this report.
Social and Economic Context
Assessment Corridor
The assessment corridor, which defines the study area for the following analysis, is illustrated in Appendix A, Figure A2-13, along with the relevant Scotland Census Output Areas (OAs). As far as possible, the statistics and results presented in this section are based on the defined OAs. These geographical zones are aggregations of postcode areas and represent the smallest geographical units for which Census results are published. Where this has not been possible other data is presented at either a Scotland Census Data Zone (DZ) or Local Authority (LA) level.
Further details on social and economic context are included within the Traffic and Economic Assessment chapter of this report.
Population
Analysis of the 2022 Scotland Census data shows that Crocketford and Springholm have populations of 310 and 542 respectively, as shown in Table 2‑9. The population of the two villages represents approximately 46% of the total population of 1,834 within the assessment corridor. The remaining population comprises residents from other villages such as Haugh of Urr, as well as those living in more rural areas or communities.
|
Settlement |
Population |
|
Crocketford |
310 |
|
Springholm |
542 |
|
Other within Assessment Corridor |
982 |
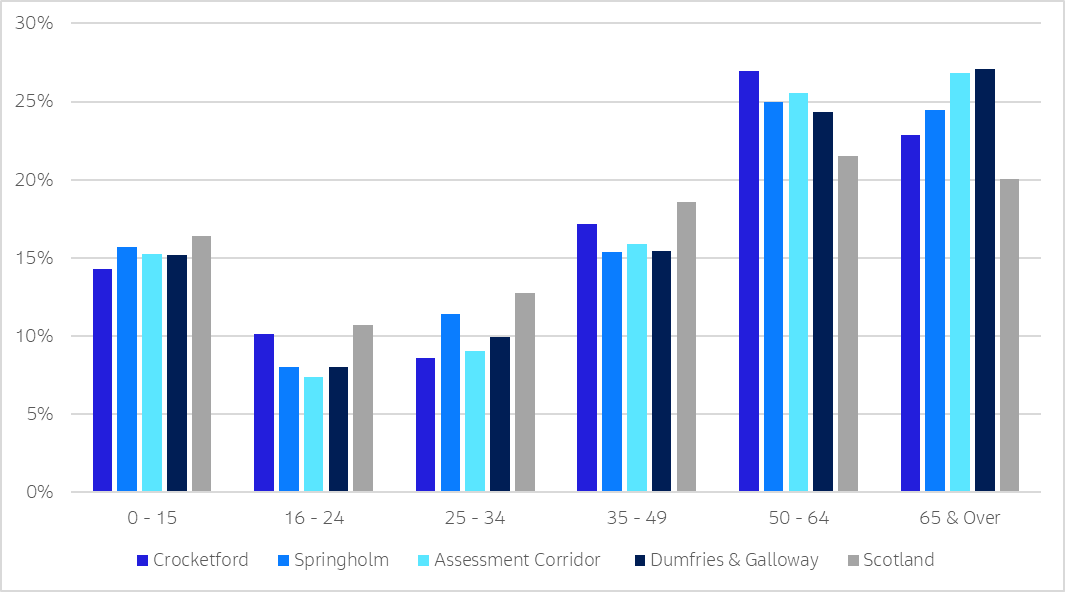
The 2022 Census data, shown in Figure 2‑1, confirms that the assessment corridor has an older population. Both the assessment corridor area and Dumfries and Galloway have 27% of their population aged 65 and over, notably higher than the proportion for Scotland at 20%. The contrast is more pronounced when considering the combined 50-64 and 65 & over age groups, which account for 53% of the assessment corridor population and 51% of Dumfries and Galloway, compared to just 42% for Scotland overall.
Conversely, the age group 16-64, representing most of the working age population, is proportionally smaller in the assessment corridor and Dumfries and Galloway. The assessment corridor has 58% of the population in this age range, comparable with Dumfries and Galloway (57%), but both lower than the Scotland average (65%).
Travel To Work Mode Share
The travel to work mode share data from the 2022 Scotland Census is shown in Figure 2‑2. Springholm has the highest proportion of car usage at 63%, significantly greater than the national average (49%). Car usage in Crocketford is 50% and is more in line with the national average. The assessment corridor car use is approximately 57%, which is equal to the Dumfries and Galloway car use mode share. Crocketford has a higher percentage of people working from home (46%) compared to the Scottish average of 32%, whereas this is only 29% in Springholm. For the assessment corridor the working from home proportion is 36%, which is also higher than the national average.
The data also highlights a significant difference in public transport and active travel usage between the villages in the assessment corridor compared with the wider regional and national averages. Crocketford and Springholm show minimal use of public transport (0 and1% respectively) compared to Dumfries and Galloway (2%) and across Scotland (6%). Both villages also have lower rates of active travel modes compared to the regional and national averages. The mode share of walking to work in the villages is 2% in Crocketford and 4% in Springholm, compared to 9% for Dumfries and Galloway and 7% for Scotland. For cycling, the mode share is less than 1% for both villages, slightly below both Dumfries and Galloway and Scotland (both 1%).
It is important to note that the 2022 Scotland Census data was collected after the majority of the COVID-19 pandemic travel restrictions were lifted, which likely had a substantial impact on travel patterns. The higher percentage of people working from home in some areas may reflect the changes in travel behaviour and workplace cultures that originally occurred during the pandemic. However, as return-to-workplace policies are implemented, there may be increases in travel to a physical workplace over time.
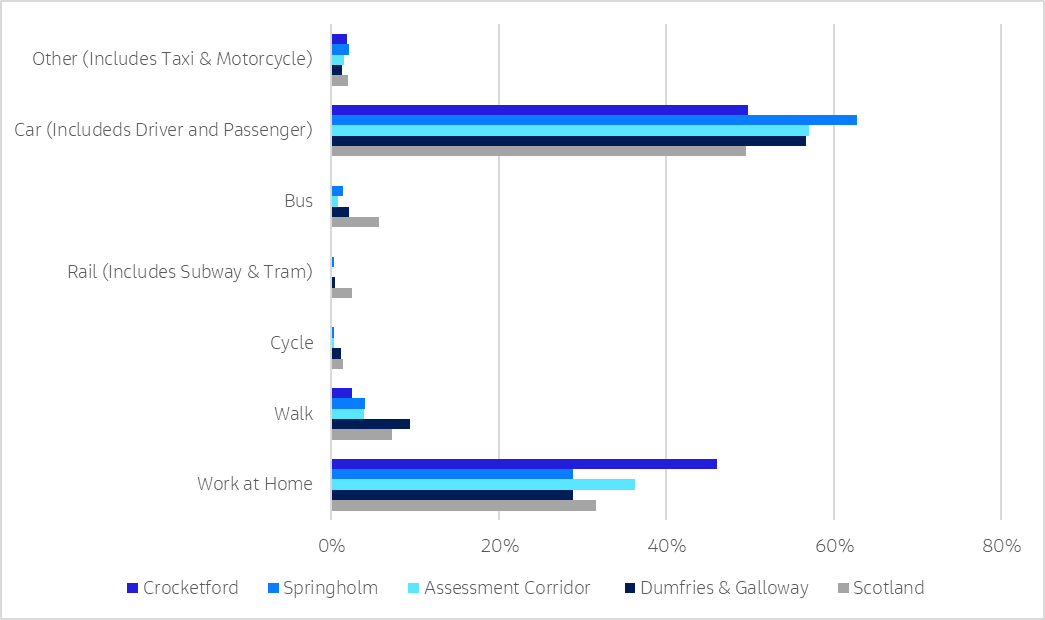
Comparing the 2022 Scotland Census data with pre-pandemic figures (2011), the work-from-home proportion for Crocketford increased from 35% to 46%, whilst Scotland's overall rate nearly tripled from 11% to 32%. Despite the significant rise in remote working, car usage decreased by a lower amount in Crocketford (from 57% to 50%) and Springholm (from 67% to 63%), compared to the more substantial decrease from 62% to 49% nationally.
Vehicle Availability
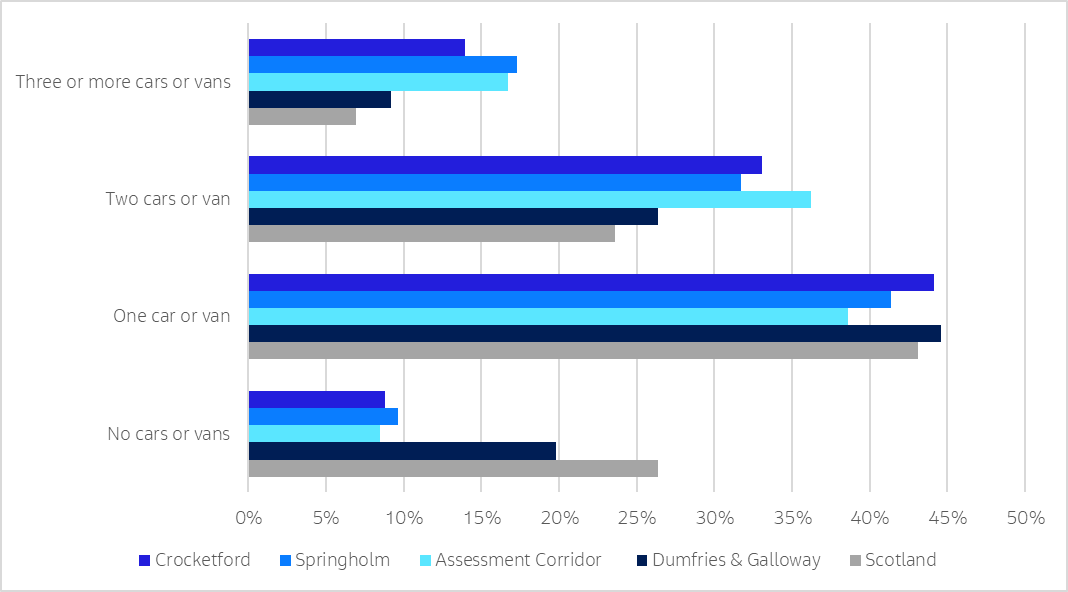
The 2022 Scotland Census data for Crocketford and Springholm indicates that households in the two villages have higher vehicle availability compared to Dumfries & Galloway and Scotland overall, as shown in Figure 2‑3. These rural communities show a higher proportion of multi-car or van households compared to both the regional and national averages. Specifically, 47% of households in Crocketford and 49% in Springholm have two or more cars or vans available, significantly higher than the equivalent figure for Dumfries and Galloway (35%) and Scotland overall (31%). Moreover, the percentage of households with access to three or more cars or vans in both Crocketford (14%) and Springholm (17%) is notably higher than the Dumfries and Galloway region (9%) and national (7%) averages.
Education
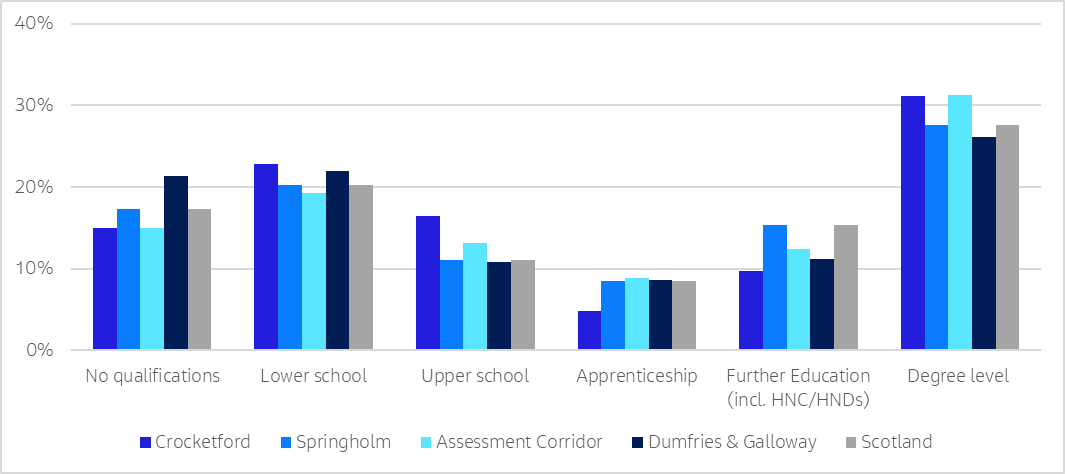
Figure 2‑4 illustrates the 2022 Scotland Census data for the highest level of qualification achieved. The data shows that Crocketford and the whole assessment corridor area have slightly higher percentages of degree-level education (31%) compared to the national average (28%), while Springholm matches the national average. The percentage of individuals with no qualifications ranges from 15% to 21% across all areas. Crocketford and the assessment corridor have the lowest proportion (15%) of people with no qualification, slightly less than the national average of 17% and Springholm (17%). The Dumfries and Galloway region has the higher proportion of people with no qualifications at 21%.
Scottish Index of Multiple Deprivation (SIMD)
The Scottish Index of Multiple Deprivation (SIMD) shows the socio-economic variation experienced across the study area as of 2020. The overall SIMD rank of an area is dependent on multiple domains, including income, employment, health, education, housing, geographic access and crime. Whilst it is a combination of these domains that defines the overall SIMD rank, each can be interrogated individually to determine specific domains of strength and weakness of an area. Appendix A, Figure A2-14 illustrates the overall SIMD decile ranking of data zones within the study area.
The assessment corridor encompasses five data zones, which fall within the 5 th to the 8 th decile of the SIMD across Scotland (where 1 is most deprived and 10 least deprived), indicating a moderate to good level of socio-economic status across much of the assessment corridor. Haugh of Urr is the least deprived with a ranking of 8, while Crocketford and the Springholm/Kirkpatrick Durham area are the more deprived with a ranking of 5. No data zone within the assessment corridor falls within the top 20% most deprived across Scotland.
Appendix A, Figure A2-15 presents the SIMD Geographic Access Indicator domain scores for data zones included within the assessment corridor. The geographic access domain within SIMD refers to the ability of residents to reach a number of key services, with sub-domains for public transport journeys and journeys by private car. It evaluates the ability for residents to reach key services such as health facilities, educational institutions, retail centres, fuel stations, and post offices.
The majority of data zones (four out of five) have a ranking of 1 for the Access to Services domain, indicating very poor access to services. This is true for the data zones encompassing the settlements of Crocketford and Springholm, Haugh of Urr, Milton and Kirkpatrick Durham as well as the surrounding rural areas. The sole exception is the zone east of Castle Douglas, which has a slightly better ranking of 2; however, this still indicates poor access to services, albeit marginally better than the other data zones within the assessment corridor.
Digital Connectivity
Table 2‑10 shows the average percentage of households that receive Superfast Broadband (SFBB) and Ultra-Fast Broadband (UFBB) reported by Ofcom across Springholm and Crocketford in the assessment corridor, compared to Dumfries and Galloway and Scotland overall. SFBB is defined as speeds of 30Mbps or greater, while UFBB refers to speeds of 300Mbps or greater. SFBB is available for 71% of households within the assessment corridor boundary, with Crocketford at 83% and Springholm at 99% specifically. UFBB availability is significantly limited and does not appear to be available in Crocketford and Springholm. While the assessment corridor shows 18% UFBB coverage overall, this average is influenced by three of the 12 Output Areas (Oas) which have between 40% and 70% UFBB coverage, while the remaining OAs have only up to 20% coverage.
|
Area |
SFBB (30mbps) availability (% premises) |
UFBB (300Mbps) availability (% premises) |
|
Crocketford |
83% |
0% |
|
Springholm |
99% |
0% |
|
Assessment corridor |
71% |
18% |
|
Dumfries and Galloway |
85% |
7% |
|
Scotland |
94% |
60% |
Economy & Labour Market
Figure 2‑5 illustrates the percentage distribution of industry sectors for the assessment corridor, Dumfries and Galloway, and across Scotland. This data is derived from the Business Register and Employment Survey (BRES) and is based on employment location. Due to the geographic representation of BRES data, for the purpose of this analysis, the most relevant 2011 Scotland Census data zones have been selected to represent the assessment corridor (as BRES has not updated outputs to reflect the 2022 Scotland Census data zones), allowing for a more localised comparison with regional and national figures.
The data indicates that education is the dominant sector within the assessment corridor, accounting for 44% of employment. This figure is markedly higher than both the Dumfries and Galloway region and Scotland, where Education represents only approximately 8% of employment in each case. The high proportion of education employment is largely due to one data zone, representing the region east of Crocketford and the settlements of Lochfoot and Milton.
The second largest sector within the assessment corridor is Human Health & Social Work, comprising 14% of employment. This is slightly below the figure of 17% for Dumfries and Galloway and the national figure of 16%. Agriculture, Forestry & Fishing is more prominent in the assessment corridor (8%) compared to the national average (3%), but less than the regional figure for Dumfries and Galloway (14%).
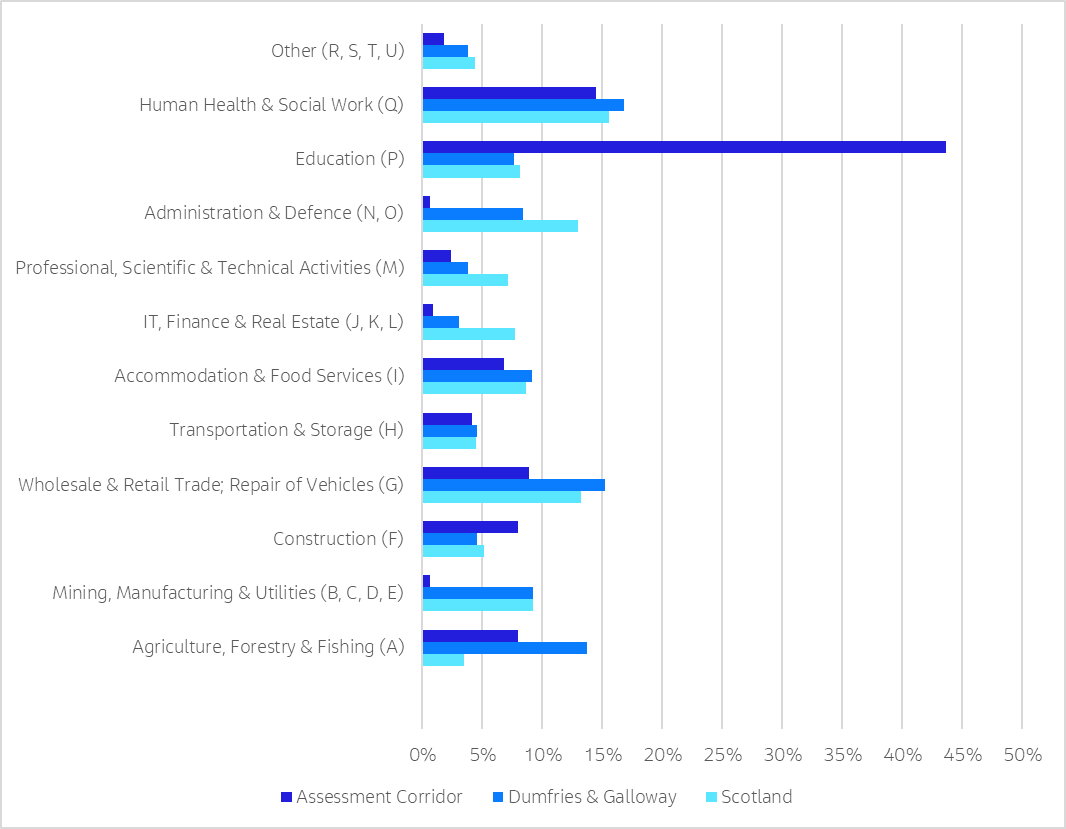
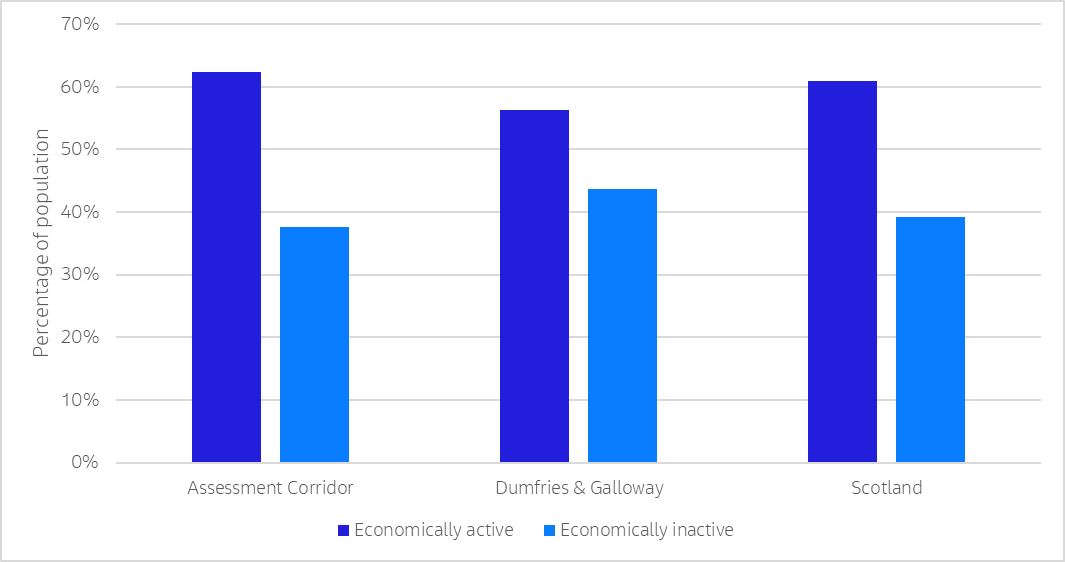
Figure 2‑6 presents 2022 Scotland Census data comparing the economic activity of individuals within the assessment corridor to the Dumfries and Galloway region and Scotland averages. Economic activity refers to individuals aged 16 and over who were working or seeking work in the week preceding the Census. The data classifies individuals into two main categories: economically active including full-time and part-time employees, self-employed individuals, and those unemployed but seeking work; and economically inactive comprising retirees, students, homemakers, individuals with long-term illnesses or disabilities, and others not participating in the labour market.
The assessment corridor area has an economic activity rate of 62%, which is largely in line with the national average (61%), and is higher than Dumfries and Galloway (56%).
Public Utilities
Public utility information has been obtained in accordance with the C2 Preliminary Inquiries stage of the New Roads and Street Works Act 1991, Measures Necessary where Apparatus is Affected by Major Works (Diversionary Works), A Code of Practice.
Challenges of the Corridor Environment
Flooding
In terms of fluvial (river) flood risk, part of the assessment corridor is within the Springholm Potentially Vulnerable Area (PVA) , as identified in 2018 under the National Flood Risk Assessment (NFRA) which is in the Urr Water catchment. The majority of flood risk in this area is from fluvial flooding. Principal rivers with modelled fluvial flood risk have been identified using SEPA Flood Maps . These Flood Maps identify the watercourses and the flood extents associated with them.
The Springholm PVA also lists pluvial (surface water) flooding as a potential flood source within the assessment corridor. The ‘Surface Water and Small Watercourses Flooding’ presented on SEPA Flood Maps identifies areas of pluvial flood risk as well as flooding from small watercourses, field drains and areas of standing water (such as ponds and lochs).
There have been historic instances of fluvial and pluvial flooding reported within the assessment corridor. Historical fluvial flood events have been reported near Springholm and Crocketford in 2002 and 2003 and pluvial flooding has been observed when heavy rainfall is combined with high water levels in Auchenreoch Loch impacting parts of the existing A75.
Newspaper reports from the Daily Record include the following articles on flood events in the past 10 years:
- 7 January 2016 Storm Frank brings flooding and New Year Chaos to the Stewartry
- 27 January 2016 Heavy rainfall causes roads chaos across Dumfries and Galloway
- 15 August 2019 Stewartry Roads disappear under floodwater after wind and rain batters Dumfries and Galloway
Flooding will be assessed further at DMRB Stage 2. Appropriate national and local policy documents will be considered including:
- National Planning Framework 4
- Policy 22 Flood risk and water management – The intent is to strengthen resilience to flood risk by promoting avoidance as a first principle and reducing the vulnerability of existing and future development to flooding.
- River Basin Management Plan for Scotland 2021-2027
- Dumfries and Galloway Council Local Development Plan 2
- NE11: Supporting the Water Environment
- NE12: Supporting the Water Environment
- IN7: Flooding and Development
- IN8: Surface Water Drainage and Sustainable Drainage Systems (SuDS)
- IN9: Waste Water Drainage
- Flood Risk Management Plan, Solway Local District Plan
Winter Resilience
Roadside features related to winter resilience such as snow poles and snow gates have not been identified along the existing A75 within the assessment corridor. An initial review has suggested that outside of extreme weather events, the existing A75 does not experience significant issues related to winter weather.
Landslides
An initial review has found that there are no significant issues with landslides along the existing A75 within the assessment corridor.