Appendix 6: Energy and Carbon Report Contents 1 Introduction 2 Methodology 3 Initial Carbon Footprint Assessment 4 Embodied Energy and Carbon at Stage 3 Design 5 Carbon Emissions Associated with Earthworks 6 Options to Reduce Embodied Energy and Carbon 7 Carbon Emissions Associated with Transport of Materials 8 The Shadow Price of Carbon 9 Conclusions Annex A Energy and Carbon Values Annex B Embodied Energy and Carbon Calculations Footnotes
Appendix 6: Energy and Carbon Report
This section is also available in pdf format (532k)
Contents
1 Introduction
1.1 Purpose
1.2 Background
1.3 Operational Carbon
1.3.1 Impact of Potential Cable Replacement Works
1.3.2 Scheme Features to Reduce CO2 emissions
1.4 CEEQUAL
1.5 Scheme Description
2 Methodology
2.1 Introduction
2.2 Highways Agency Carbon Accounting Tool
2.2.1 Emissions Calculation Approach
2.2.2 Key Data Sources
2.3 Inventory of Carbon and Energy
2.3.1 Selection Criteria
2.3.2 Transport
2.3.3 Recycling Methodology
2.3.4 Advisory Notes
3 Initial Carbon Footprint Assessment
3.1 Purpose
3.2 Limitations
3.3 Methodology and Scope
3.4 Presentation of Results
3.4.1 Data Gathering and Key Assumptions
3.4.2 Results
3.4.3 Sourcing Scenarios
4 Embodied Energy and Carbon at Stage 3 Design
4.1 Introduction
4.2 Road Connections
4.2.1 Roads Network
4.2.2 Land-Based Structures
4.3 Main Crossing
4.3.1 Substructure
4.3.2 Superstructure
4.4 Combination of Options for Main Crossing Superstructure
4.5 Embodied Energy and Carbon Summary
5 Carbon Emissions Associated with Earthworks
5.1 Maximising the Cut and Fill Balance
5.2 Export of Unacceptable Earthwork Material
6 Options to Reduce Embodied Energy and Carbon
6.1 Use of Recycled Aggregate
6.2 Using Recycled Steel
7 Carbon Emissions Associated with Transport of
Materials
7.1 Introduction
7.2 Illustrative Sourcing Scenarios
8 The Shadow Price of Carbon
8.1 Introduction
8.2 Methodology
8.3 Illustrative Example
8.4 Monetising Carbon
9 Conclusions
9.1 Background and Purpose
9.2 Approach
9.3 Results of Embodied Energy and Carbon Assessment
9.4 Potential Options to Reduce Energy and Carbon
9.5 Operational Carbon
9.6 Next Stages
Annex A Energy and Carbon Values
Annex B Embodied Energy and Carbon Calculations
1 Introduction
The purpose of this report is to provide information summarising:
- how the issue of energy and carbon is addressed using sustainability management tools;
- energy and carbon accounting;
- the estimated energy and carbon footprint of the Stage 3 design; and
- how the energy and carbon footprint will be monitored going forward against the above baseline.
A key principle of the Sustainable Development Policy for the project (refer to Appendix 1) is to:
‘Seek to minimise the carbon footprint of the crossing and associated network connections by consideration of the impact of its design, procurement, construction, maintenance, operation and decommissioning’
A Sustainability Appraisal Framework has been established to underpin this policy and has been used at key stages (e.g. Stage 2 Options, Stage 3 Design). The Sustainability Appraisal Framework includes two objectives (together with associated targets and indicators) that focus on carbon, these are:
Table 1: Energy and carbon related sustainability objectives, targets, and indicators
| Sustainability Objectives |
Target |
Indicators |
|---|---|---|
12. To minimise embodied energy and carbon associated with the construction of the scheme |
1. Seek to minimise the embodied energy and carbon associated with key materials and their transport to site |
Estimated embodied energy and carbon |
|
|
Actual embodied energy and carbon in materials, transportation and waste |
|
2. Minimise energy use and all carbon emissions during construction |
Predicted energy requirement and CO2 emissions |
|
|
Actual energy used and CO2 emissions |
13. To minimise carbon emissions once the bridge is opened to traffic |
1. Seek to reduce CO2 emissions from vehicles crossing the Forth at Queensferry compared with existing FRB |
Predicted CO2 emissions |
|
2. Minimise the energy requirements of the new bridge (once it is open to traffic) to the minimum necessary for safe operation |
Predicted energy requirements |
|
|
Actual energy requirements |
|
3. Maximise % of required energy for the bridge (once opened to traffic) acquired from renewable sources |
Predicted energy sources |
|
|
Actual energy sources |
This report provides information which can be used to measure progress against objective 12, embodied energy and carbon associated with construction of the scheme.
The regional air quality assessment reported in Chapter 15 of the ES uses a standard approach to address the difference between the air quality that would be likely with the proposed scheme (the ‘Do-Something’ scenario) and without the proposed scheme (the ‘Do-Minimum’ scenario) for both the anticipated year of opening (2017) and the design year 15 years after opening (2032). The future Do-Minimum scenario assumes that the Forth Road Bridge is still in operation.
The regional assessment in the ES presents total CO2 emissions for the road network covered in the TMfS:05a (Traffic Model for Scotland) for 2005, 2017 Do-Minimum and 2017 Do-Something scenarios as well as total distance travelled in each scenario and emissions per kilometre travelled. Using standard methodology, there is a calculated increase of 14,952 tonnes per year of CO2 emissions between the Do-Minimum and Do-Something scenarios in 2017, which is consistent with the predicted increase in vehicle kilometres travelled along the traffic links selected for the regional air quality assessment.
This assessment of CO2 emissions is based on traffic flows from the strategic traffic model, TMfS:05A. This approach uses established Department for Transport formulae (DMRB emission factors) to calculate CO2 emissions based on model output speeds and volumes. This approach forecasts modest increases in CO2 emissions, associated with the introduction of the proposed scheme.
The use of the strategic traffic model has the advantage of wide network coverage, so all of the network effects of the proposed scheme will be encompassed by the assessment. The methodology used to calculate emissions is consistent with many other road projects assessed in Scotland in recent years and it is recognised as the current best practice. However, the CO2 calculations are based on average speeds and this approach is not capable of assessing the local impact of stop-start traffic conditions. In addition, it does not address the negative impact of the major maintenance and recabling work that would be likely to be required in the absence of a replacement crossing.
Transport Scotland recognised that a refinement to the standard methodology was required to address this matter. A new Passenger car and Heavy-duty Emission Model (PHEM) based emissions calculation module has been developed. This can be used with microsimulation models such as S-Paramics (referred to generically as Paramics). The emissions evaluation using Paramics with PHEM relationships is a technique being developed on behalf of Transport Scotland, but not yet fully approved for use in scheme appraisal. The information obtained from this evaluation tool has been used to supplement the strategic calculations which are based on the Department for Transport formulae. The PHEM based results are intended to provide a more informed view of the likely locally generated impact of the proposed scheme.
The PHEM model output is a series of emission factors, based on vehicle type, vehicle speed, vehicle loading and vehicle acceleration. This method calculates the rate of emission for each vehicle at each simulated timestep. The use of PHEM emissions relationships with the Paramics model offers the ability to take into account emissions from stop-start motoring, which is not fully reflected within the global evaluation within the air quality model which is based on traffic information from the Transport Model for Scotland (TMfS). The local PHEM based assessment therefore examines the localised effect of stop start motoring conditions on the congested approaches to the Forth Road Bridge and the localised benefits to be derived from relieving these conditions. It is recognised that this local assessment does not quantify wider impacts outwith the Paramics model area.
Traffic conditions in peak periods within the vicinity of the Forth Road Bridge are frequently congested. The established and standard methodology for calculating CO2 emissions, (based on the Department for Transport formulae), relies on average traffic speed as the basis for calculation. In comparison to the Do-Minimum, the proposed scheme will result in smoother traffic flows and improved journey time reliability. The average speed calculated on the network, using the Department for Transport method, in the vicinity of the scheme in the Do-Minimum scenario, reflects a range of emissions conditions from traffic which is variously accelerating, braking, idling and cruising, rather than travelling steadily at that average speed. One of the features of the Managed Crossing Scheme is that traffic will be controlled to improve flow conditions and hence, reduce emission rates, compared with the current conditions.
Tests were undertaken using the Paramics / PHEM module to compare Do-Something traffic emissions with Do-Minimum emissions in the AM and PM modelled periods for 2017 forecasts. The scheme design in conjunction with ITS operation will result in improved fuel efficiency and lower emissions per kilometre. However, the Do-Something scheme involves additional travel distance for cross Forth traffic and additional traffic demand which result in increased CO2 emissions.
In this Do-Something scenario, the additional CO2 emissions for the AM period are forecast to be 3.7 tonnes in the AM period and 14.7 tonnes in the PM period. These forecasts relate to AM and PM periods during average week day traffic. The proposed scheme involves some additional travel distance to cross the Forth and attracts more traffic to this part of the network. As a result of these two factors, the travel distance in terms of vehicle kilometres is expected to increase in the Do-Something scheme, compared with the Do-Minimum comparator.
Results of the test are presented in Tables 2 and 3.
Table 2: Total CO2 Emissions within the Paramics Network in 2017 (tonnes)
| Pollutant |
Emissions 2017 Do-Minimum |
Emissions 2017 Do-Something |
Difference 2017DM/2017 Do-Something |
% Change (local area) 2017 Do-Something versus 2017 Do-Minimum |
|---|---|---|---|---|
| CO2 (Tonnes) AM |
253.1 |
256.8 |
3.7 |
1.5% |
| CO2 (Tonnes) PM |
268.4 |
283.1 |
14.7 |
5.5% |
Table 3: Total vehicle Kilometres within the Paramics Network in 2017
|
Vehicle Kilometres 2017 Do-Minimum |
Vehicle Kilometres 2017 Do-Something |
Difference 2017DM/2017 Do-Something |
% Change (local area) 2017 Do-Something versus 2017 Do-Minimum |
|---|---|---|---|---|
| AM |
932,669 |
995,484 |
62,815 |
6.7% |
| PM |
1,129,048 |
1,191,004 |
61,956 |
5.5% |
If the fuel efficiency of the network operation were to remain constant, the rate of CO2 per kilometre would also be expected to remain constant. Total vehicle kilometres is the measure of total distance travelled by all vehicles in the model network. If the Do-Something model were to operate with the same level of fuel efficiency as the Do-Minimum, then we would expect the proportionate change in emissions to be similar to the increase in vehicle kilometres.
When we compare the increases in CO2 in Table 2 with the increases in vehicle kilometres in Table 3, we can see that the percentage increase in CO2 in the PM peak is similar to the percentage increase in travel in the PM peak. However, in the AM peak the percentage increase in CO2 is significantly lower than the increase in travel distance and hence, less than might otherwise be expected. The test indicates that during the congested morning peak period, the forecast increase in CO2 emissions from the additional traffic and distance travelled is reduced by the improved scheme design and operation of ITS, which reduces congestion.
There is less congestion relief forecast in the evening peak and therefore a smaller reduction in the predicted increase in CO2 emissions during this period.
1.3.1 Impact of Potential Cable Replacement Works
The proposed scheme will reduce or avoid the need for cable replacement and other maintenance works that are likely to be necessary to retain the Forth Road Bridge in use in the absence of a replacement crossing. These works on the Forth Road Bridge, extending over an anticipated eight year period, would have a significant impact on traffic congestion and routing and hence emissions that the air quality assessment reported. Avoiding the need for cable replacement, and the lengthy period of congested conditions associated with that work, would mean that total CO2 emissions during the congested peak periods for the proposed scheme are likely to be reduced.
Paramics / PHEM tests were undertaken to test the impact of main cable replacement works on the Forth Road Bridge which are anticipated to require contraflow restrictions on the existing bridge for 268 weeks over 8 years between 2012 and 2019 inclusive. The traffic conditions which will prevail for much of the time if the cable replacement is undertaken will be very different from the normal Do-Minimum conditions. Stop-start traffic will occur for longer periods in more locations under this scenario. Even allowing for a significantly reduced level of demand, the reduced capacity available on the Forth Road Bridge means that the average delay to vehicles will increase by around 40 minutes per journey, compared with normal un-restricted travel.
In order to provide a comparison of the local impacts of the cable replacement works on CO2 emissions, similar equivalent tests were undertaken by applying the same demand to the unrestricted base network. The demand applied to both networks equates to 70% of base (2008) levels of demand. Interpeak emissions have not yet been assessed. The peak period tests also do not take account of the effects of the likely increased vehicle kms and increased congestion on competing crossings and approach routes caused by diverting traffic.
The assessed annual emissions are summarised in Table 4 below and are presented as negative numbers as they represent an impact which could be avoided by building the proposed scheme.
Table 4: Indicative Cable Replacement Impact
Modelled Period |
Modelled CO2(e) difference (Tonnes) |
Annualisation Factor* |
CO2(e) difference per annum (Tonnes) |
|---|---|---|---|
AM (4 hours) |
-20.5 |
167.5 |
-3,434 |
PM(4 hours) |
-12.9 |
167.5 |
-2,161 |
Total |
-33.4 |
-5,595 |
* Annualisation Factor assumes 5 weekdays and 33.5 weeks per year.
The results in Table 4 indicate that the MCR works are likely to result in an increase in CO2 emissions owing to an increase in congestion during the works. If the proposed scheme were implemented then this increase in emissions from the MCR works would potentially be avoided. Therefore an indication of the annual net impact of the proposed scheme on CO2 emissions can be calculated by taking the standard assessment forecast increase in emissions owing to the proposed scheme and then subtracting the predicted local area increase in emissions that would be expected during the period of the cable replacement works.
The graph below (Figure 1) indicates the cumulative effect of the forecast changes in CO2 emissions using this approach. As can be seen in this illustration, up to 2016, there is a net decrease in CO2 emissions, this continues until 2019 at a lower rate as the increase in CO2 from the proposed scheme cancels much of the reduction. After 2019 the cable replacement would be complete and hence the CO2 emissions from the proposed scheme would now be higher than the Do-Minimum. However, there is a cumulative net saving in CO2 emissions until 2025. Therefore the predicted increase in CO2 emissions is delayed until 2025 by the implementation of the proposed scheme. It should be noted that the MCR impacts are derived from identical traffic demand in both the MCR modelling and the comparator Do-Minimum modelling. Therefore, only the impact of network changes are taken into account. The Managed Crossing Scheme impact, indicated in Chapter 15 (Air Quality) of the ES and presented in the graph, includes both the effect of network changes and the effect of additional traffic demand in the Do-Something scenario.
Figure 1: Indicative cumulative change in CO2(e)
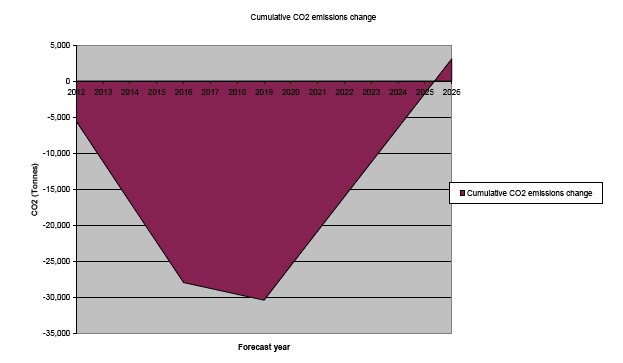
The data in Figure 1 illustrate that emissions during the congested peak periods for the proposed scheme are likely to be less than the Do-Minimum (including cable replacement) over the period 2012 to 2025. This assessment excludes the additional benefits that may result from avoiding delays and increased emissions within the interpeak periods due to cable replacement works. Further work will investigate these impacts.
1.3.2 Scheme Features to Reduce CO2 emissions
In terms of impacts from vehicles using the crossing, the FRC scheme includes a number of features aimed at reducing CO2 emissions. These include:
- use of Intelligent Transport Systems to improve network efficiency and decrease congestion;
- infrastructure to facilitate modal shift, particularly through the provision of a dedicated public transport corridor on the FRB and associated public transport public transport lanes and public transport links; and
- encouraging and facilitating active modes of transport (e.g. cycling) by minimising impacts on paths and cycle routes and improving these where feasible.
The Civil Engineering Environmental Quality and Awards Scheme (CEEQUAL) is an assessment and awards scheme for improving sustainability in civil engineering projects being promoted by the Institution of Civil Engineers and others. Its objective is to encourage the attainment of environmental excellence in civil engineering projects, and thus deliver improved environmental and social performance in project specification, design and construction.
The Forth Replacement Crossing is pursuing accreditation with CEEQUAL. The issue of energy and carbon forms component of the overall assessment.
The FRC is a major infrastructure project comprising a new cable-stayed bridge across the Firth of Forth with associated new road connections and improved road infrastructure to the north and south. A description of the project is provided in Section 1.1.2 of the Sustainability Appraisal and Carbon Management Report. Additional detail can be found in the DMRB Stage 3 Scheme Assessment Report (Jacobs Arup 2009a) and Chapter 4 of the ES (Jacobs Arup 2009b).
2 Methodology
The Sustainable Development Policy sets out the key sustainability principles and objectives which form a core thread throughout all the activities of the project team and stages in the project life cycle. Reducing the environmental impacts of the scheme, including lowering the carbon footprint, is integral to this policy.
An energy and carbon assessment has been established for the scheme, and this will be used as a tool for several purposes:
- for comparing scheme options;
- for driving innovation within the scheme design;
- for use in reviewing tender proposals from potential contractors; and
- for monitoring and measuring efficiencies.
2.2 Highways Agency Carbon Accounting Tool
The Highways Agency (HA) Carbon Accounting Tool (HA 2008; HA 2009) has been developed with reference to existing carbon accounting methodologies and information from the Environment Agency, Department of Environment, Food and Rural Affairs (DEFRA) and the International Organization for Standardization, and has drawn upon recognised best practice. The overall scope of the Accounting Tool is to cover all operations and activities over which HA has control, defined in terms of financial or contractual commitments for which HA is ultimately responsible. This includes responsibility for the greenhouse gas emissions produced by its supply chain when they are undertaking business on behalf of the Agency.
As such, the model can be used to capture emissions from power consumption, fuel usage, resources consumed and discarded, and the embodied energy elements associated with extraction, manufacture, production, installation, and transportation of all elements utilised on behalf of the Agency. The HA Carbon Accounting Tool (HA 2008; HA 2009) can be used to create a carbon footprint for all aspects of the FRC construction project as well as for the ongoing maintenance operations required.
2.2.1 Emissions Calculation Approach
Emissions are calculated by applying documented emission factors that convert a measure of activity from an emissions source into a volume of greenhouse gases (GHG) emissions. Emissions are reported as CO2 (rather than CO2e or carbon equivalent as per DEFRA guidance, refer to section 7). An example calculation is included below:
Measure of activity X Emissions Factor = Emission Estimate
100 tonnes of steel X 1.77 tCO2/t = 177 tCO2
Where tCO2 = tonnes of CO2
Identified below are the key published data sources referred to within the HA Carbon Accounting Tool (HA 2008; HA 2009) to provide the majority of emission factors.
- Guidelines to DEFRA’s GHG Conversion Factors for Company Reporting – Annexes, (DEFRA 2007a).
- Inventory of Carbon and Energy (University of Bath 2007).
- Carbon Calculator for Construction Activities (Environment Agency 2007).
Assumptions and uncertainties are an inherent part of the carbon footprinting process as is the recognition that there are limitations in the data available. Future developments and clarifications will help to refine the assessment as the project progresses.
2.3 Inventory of Carbon and Energy
The Inventory of Carbon and Energy (ICE) Version 1.6a is the University of Bath’s embodied energy and embodied carbon database, and is a freely available summary of the larger ICE-Database (University of Bath 2008). It provides an inventory of embodied energy and carbon coefficients for building materials. The data has been collected from secondary sources in the public domain (journal articles, books, conference papers, etc). The report is structured into 34 main material groups (i.e. aggregates, metals etc) with a material profile created for each main material.
The Inventory of Carbon and Energy report provide the following explanatory note, defining the term ‘embodied energy’:
"The embodied energy (carbon) of a building material can be taken as the total primary energy consumed (carbon released) over its life cycle. This would normally include (at least) extraction, manufacturing and transportation. Ideally the boundaries would be set from the extraction of raw materials (including fuels) until the end of the products lifetime (including energy from manufacture, transport, energy to manufacture capital equipment, heating and lighting of factory, maintenance, disposal…etc), known as ‘Cradle-to-Gate’, which includes all energy (in primary form) until the product leaves the factory gate. The final boundary condition is ‘Cradle-to-Site’, which includes all of the energy consumed until the product has reached the point of use (i.e. building site)."
Boundary conditions for each material are specified within the material profiles. Cradle-to-Gate is the boundary condition most commonly specified in the report. Users are encouraged to consider the impacts of transportation for their specific case. In a few cases Cradle-to-Grave has been specified due to the original data resources.
The Inventory of Carbon and Energy contains both embodied energy and carbon data1, but the embodied energy coefficients carry a higher accuracy. One of the main reasons for this is that the majority of the collected data was for embodied energy, not embodied carbon. Many of the embodied carbon coefficients within ICE were estimated by the authors based on the typical fuel mix in the relevant UK industries. There are, however, uncertainties associated with this method of determining embodied carbon as a result of different fuel mixes and technologies (i.e. electricity generation). For example, two factories could manufacture the same product, resulting in the same embodied energy per kilogram of product produced, but the total carbon emitted by both could vary widely dependent upon the mix of fuels consumed by the factory.
Even with the most reliable data, embodied energy and carbon analysis carries a natural level of uncertainty. The ICE database has proved to be robust when compared with other similar inventories.
The embodied energy and carbon coefficients selected for the ICE database were representative of typical construction materials employed in the British market. In the case of metals, the values for primary and recycled materials were first estimated, and then a recycling rate (and recycled content) was assumed for the metals typically used in the marketplace. This enabled an approximate value for embodied energy in industrial components to be determined.
Boundary conditions within the Inventory of Carbon and Energy are selected as cradle-to-gate. Transport from factory gate to construction site is not therefore included. Emissions associated with transport must be calculated separately. Section 7 considers emissions associated with transport of materials to site. The Sustainable Resource Framework also addresses material sourcing and sets targets to source materials locally where possible.
The Inventory of Carbon and Energy recycling methodology is known as the recycled content approach. However, the metal industries endorse a methodology known as the substitution method. Each method is fundamentally different. The recycled content approach is a method that credits recycling, whereas the substitution method credits recyclability.
The Inventory of Carbon and Energy considers the recycled content approach most suitable for the construction industry. The substitution method may run the risk of under accounting for the full impacts of primary metal production.
- Functional units: It is inappropriate to compare materials solely on a kilogram basis. A comparative study should consider the quantity of materials required to provide a set function. It is only then that two materials can be compared for a set purpose.
- Lifetime: Ideally the functional unit should consider the lifetime and durability of the product.
- Waste: The quantity of waste generated from the production of materials must be considered. This should include analysis of what happens to the wasted materials, whether they are re-used, recycled or disposed of to landfill.
- Maintenance: The maintenance requirements and the impact this has on energy and material consumption needs to be considered.
3 Initial Carbon Footprint Assessment
During DMRB Stage 2, a carbon footprinting exercise was carried out to provide a high-level comparison of the carbon emissions associated with two scheme alternatives for the proposed Forth Replacement Crossing as defined in the Scheme Definition Report (Jacobs Arup 2009g).
A brief overview of the characteristics of the two schemes is provided in Table 5 below:
Table 5: Characteristics of the two scheme alternatives
| Replacement Bridge Scheme (FS2) |
Managed Crossing Scheme (MG2) |
|---|---|
|
|
The components of the scheme alternatives that were included in the carbon assessment were limited to those that could be reasonably estimated at that stage of the project. Included in this early assessment were estimates of the types and amounts of construction materials to be used in the new road network, main crossing and refurbishment of the Forth Road Bridge (for MG2 only). However, it was not possible at Stage 2 to include:
- accurate estimates of the likely energy required for other aspects of the construction such as the use of plant and equipment or the removal of waste from site; and
- emissions associated with the operation of the Forth Replacement Crossing i.e. vehicle usage and bridge maintenance.
The carbon footprint assessment was based on the information contained in the Highways Agency (HA) Carbon Accounting Tool for Major Projects (HA 2009). The HA model is described in Section 2.2 above.
The carbon footprint assessment for the two scheme alternatives was initially limited to the construction materials to be used in the schemes.
At Stage 3, the scope of the assessment was widened to include other aspects such as energy use, transportation of materials, waste generation. This assessment is presented from Section 4 onwards.
3.4.1 Data Gathering and Key Assumptions
(a) Road Network
(i) Option FS2
Pavement = 487,000 m2 of new construction and 148,000 m2 of overlay/inlay
Earthworks cut = 1,159,000 m3 and fill = 2,700,000 m3
(ii) Option MG2
Pavement = 254,000 m2 of new construction and 254,000 m2 of overlay/inlay
Earthworks cut = 628,000 m3 and fill = 340,000 m3.
(b) Main Crossing
(i) Option FS2
Three-corridor main crossing (orthotropic cable-stayed bridge with twin concrete box girder approach viaducts) with separate provision for public transport.
(ii) Option MG2
Two-corridor main crossing (orthotropic cable-stayed bridge with twin concrete box girder approach viaducts) with no separate provision for public transport.
(c) Future Refurbishment of existing Forth Road Bridge
Option MG2 only:
- Ready mix concrete: high strength = 588 tonnes
- Steel: general = 1,595 tonnes
- Asphalt = 388 tonnes
A summary of the results of the initial carbon footprinting exercise is provided in Table 6 and Figure 2 below:
Table 6: Summary carbon footprinting results comparing two scheme alternatives
| Component
|
Embodied Carbon (tCO2) |
|||
|---|---|---|---|---|
| FS2 |
MG2 |
|||
| tonnes CO2 |
Proportion of Scheme Carbon Footprint |
Tonnes CO2 |
Proportion of Scheme Carbon Footprint |
|
| Road Network (main materials i.e. asphalt & aggregate to be used in construction of new pavement and overlay/inlay of existing pavement) |
8,575 |
3% |
5,029 |
3% |
| Earthworks associated with Road Network |
62,873 |
25% |
11,750 |
8% |
| Main Crossing (Orthotropic Cable-Stayed Bridge & Twin Concrete Box Girder Approach Viaducts) |
180,947 |
72% |
130,312 |
87% |
| Refurbishment of Existing FRB (main materials i.e. steel concrete & asphalt) to be used in refurbishment |
0 |
0% |
3,028 |
2% |
| TOTAL |
252,395 |
|
150,119 |
|
Figure 2: Summary carbon footprinting results comparing two scheme alternatives
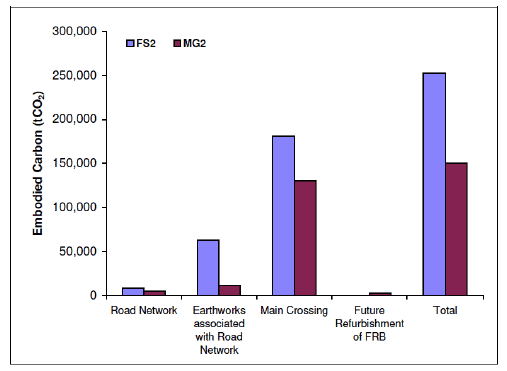
Based on this analysis, it was calculated that Option FS2 would result in approximately 68% (102,000 tonnes) more embodied carbon than Option MG2:
- for both options the Main Crossing represents the greatest proportion of the embodied carbon. The embodied carbon associated with the Main Crossing for FS2 is approximately 39% (52,000 tonnes) more than for MG2;
- FS2 would entail more earthworks than for MG2 and this is reflected in the difference (approximately 51,000 tonnes) in embodied carbon for this component; and
- the future refurbishment of the FRB (Option MG2) represents a very small proportion of embodied carbon (approximately 2%).
Table 7 provides an illustration of how the different materials that would be used in the two FRC scheme alternatives contribute to their respective carbon footprint:
Table 7: Breakdown of carbon footprint by material type
| Component |
Proportion of Carbon Footprint |
|
|---|---|---|
| FS2 – Replacement Bridge Scheme |
MG2 – Managed Crossing Scheme |
|
| Steel |
48% |
65% |
| Soil requiring import/export (earthworks) |
30% |
8% |
| Concrete |
16% |
22% |
| Asphalt |
3% |
1% |
| Quarried aggregate |
2% |
1% |
| Polymer membrane |
1% |
1% |
From the above it can be seen that steel and concrete contribute the majority of the embodied carbon associated with construction materials to be used in either scheme, and that the earthworks, especially those associated with FS2, are also a major contributor. As such it is considered that the greatest potential "savings" in terms of the carbon emissions associated with the construction materials to be used in the project, irrespective of which scheme alternative is selected, will be made by concentrating on these key areas i.e. seeking out alternative materials or crossing designs that would use these key materials more efficiently.
In addition, some simple calculations have been carried out using the available data in order to illustrate how different sourcing scenarios would affect the carbon footprint of the crossing. For example, it has been calculated that:
- sourcing all the steel locally rather than from further afield, could represent a carbon "saving" of over 6,000 CO2 on the transportation of that steel to site (approximately 2.6% of the overall footprint for FS2); and
- using 100% recycled aggregate rather than using 100% freshly quarried aggregate could represent a savings of nearly 2,000 tonnes CO2 (approximately 0.75% of the overall footprint of FS2).
4 Embodied Energy and Carbon at Stage 3 Design
Building on the high-level carbon footprinting exercise carried out at the initial design stage, a more detailed analysis was carried out as the design developed. This assessed the embodied energy and carbon associated with key materials and components to be used in the scheme. The analysis is based on energy and carbon coefficients extracted from the Inventory of Carbon and Energy database (University of Bath 2008) and the HA Carbon Accounting Tool (HA 2008; HA 2009). Annex A provides an inventory of energy and carbon coefficients used in the assessment.
The energy and carbon assessment divides the scheme into its main component parts, as shown in Figure 3. Material quantities were provided by each of the relevant design teams. This assessment is based on Stage 3 Design.
Figure 3: Main Component of the FRC scheme
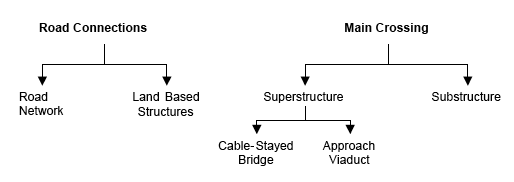
Table 8 presents a summary of embodied energy and carbon associated with materials to be used in the road network. These calculations are based on estimated material quantities and the application of appropriate energy and carbon values to give total embodied energy and carbon (details of energy and carbon factors are provided in Annex A).
Material quantities are based on Stage 3 Design. This assessment includes the use of asphalt material, quarried aggregates and the import of suitable fill material. Filter materials in drains (consisting of plastic pipes of varying diameters and filter stone) have not been included as material quantities are not available at this stage.
The energy and carbon assessment for the road network has been broken down into a number of components: the pavement; overlay; sub-base; capping, and fill material. The pavement and overlay consist of asphalt material, while the sub-base and capping is made up of aggregate material. Imported fill material consists of general aggregate material.
The total embodied energy associated with these materials is 342,794 GJ and the total embodied carbon is 8,701 tCO2. As shown in Table 8 the pavement accounts for approximately 67% of total embodied energy. The import of fill material makes up around 20%, the overlay around 8%, while the sub-base and capping account for 2% and 3% of the total respectively. Similarly, as shown in Figure 4, in terms of embodied carbon the pavement accounts for 46% of the total, the import of fill material 40%, the overlay 6%, and the sub-base and capping make up 3% and 6% respectively.
Table 8: Summary of the estimated embodied energy and carbon for road network
Component |
Category |
Material |
Energy |
Carbon |
|---|---|---|---|---|
GJ |
tCO2 |
|||
Pavement |
Quarry Sourced Material |
General Asphalt |
230,752 |
3,994 |
Overlay |
General Asphalt |
27,381 |
474 |
|
Sub-base |
General Aggregate |
5,221 |
261 |
|
Capping |
General Aggregate |
10,441 |
2,993 |
|
Import of fill |
General Aggregate |
69,000 |
3,450 |
|
Total |
342,794 |
8,701 |
Figure 4: Percentage of embodied energy by component for road network
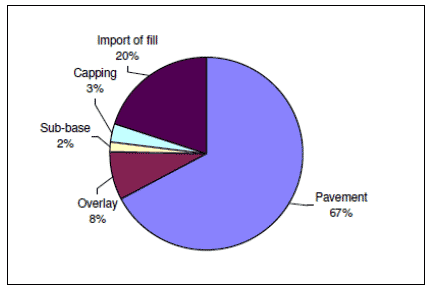
Figure 5: Percentage of embodied carbon by component for road network
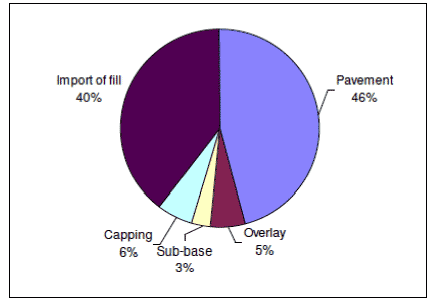
Table 9 below gives a summary of embodied energy and carbon associated with materials to be used in the land-based structures. As before, the energy and carbon assessment is based on estimated material quantities and the application of appropriate energy and carbon values to give total embodied energy and carbon.
The assessment includes key materials associated with construction (i.e. concrete, steel, imported fill). Material quantities are based on Stage 3 Design.
The total embodied energy associated with materials to be used in the land-based structures is 536,890 GJ, and the total embodied carbon is 47,768 tCO2. As shown in Figure 6, steel accounts for approximately 70% of the total embodied energy, while concrete and imported fill make up around 25% and 5% respectively. In terms of embodied carbon, as shown in Figure 7, steel accounts for 54% of the total, while concrete and imported fill make up around 43% and 3% respectively.
Table 9: Summary of the estimated embodied energy and carbon for land-based structures
Category |
Material |
Energy |
Carbon |
|---|---|---|---|
GJ |
tCO2 |
||
Concrete |
Concrete: high strength |
133,957 |
20,142 |
Precast concrete |
1,754 |
189 |
|
Metals |
Steel: bar & rod |
193,036 |
13,418 |
Steel: section |
179,883 |
12,606 |
|
Quarry Sourced Materials |
General aggregate: Imported Fill |
28,260 |
1,413 |
Total |
536,890 |
47,768 |
Figure 6: Percentage of embodied energy in land-based structures by material type
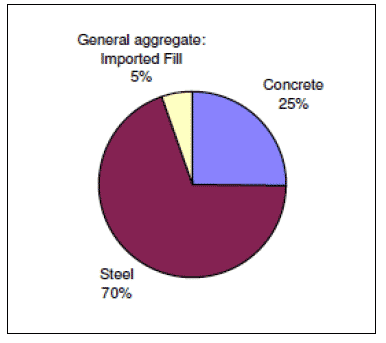
Figure 7: Percentage of embodied carbon in land-based structures by material type
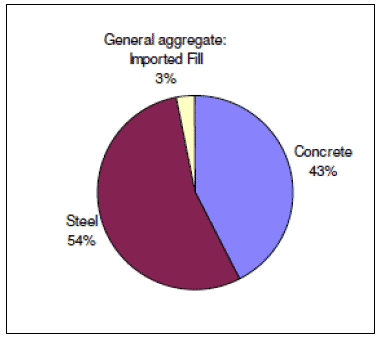
Table 10 below gives a summary of embodied energy and carbon associated with materials to be used in the substructure of the Main Crossing. The energy and carbon assessment is based on estimated material quantities and the application of appropriate energy and carbon values to give total embodied energy and carbon.
The assessment includes key materials associated with construction (i.e. cement, steel, aggregate, sand, stone, and concrete). Material quantities are based on Stage 3 Design.
The total embodied energy associated with materials to be used in the substructure is 742,986 GJ, and the total embodied carbon is 56,448 tCO2. As shown in Figure 8 steel accounts for approximately 81% of the total embodied energy. Cement and concrete contribute around 7% each, while aggregate material, stone and sand account for the remaining 5%. As shown in Figure 9 steel accounts for around 72% of total embodied carbon, while cement makes up 14% and concrete 10%. Stone, sand, and aggregate material account for the remaining 4%.
Table 10: Summary of the estimated embodied energy and carbon for the substructure
Category |
Material |
Energy |
Carbon |
|---|---|---|---|
GJ |
tCO2 |
||
Cements |
Cement: general - 50% blast furnace slag |
52,260 |
7,813 |
Metals |
Steel: general2 |
397,410 |
25,791 |
Sheet piling: heavy use |
208,986 |
15,160 |
|
Quarry Sourced Materials |
Quarried aggregate |
3,726 |
298 |
Recycled aggregate |
582 |
34 |
|
Sand |
2,264 |
113 |
|
Stone: general |
27,060 |
1,515 |
|
Concrete |
General Road and Pavement |
39,614 |
4,057 |
High Strength |
11,084 |
1,667 |
|
Total |
742,986 |
56,448 |
Figure 8: Percentage of embodied energy in substructure by material type
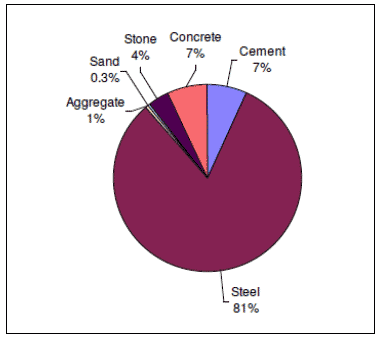
Figure 9: Percentage of embodied carbon in substructure by material type
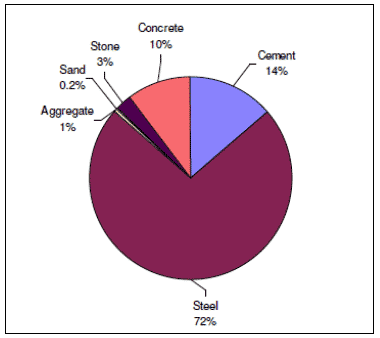
Table 11 shows the labelling scheme for each element of the Main Crossing substructure. Table 12 shows embodied energy and carbon associated with each element of the substructure. SNTBP accounts for approximately 43% of total embodied energy, while ASC (Piled) and STP account for 28% and 10% respectively.
Table 11: Labelling of elements associated with the substructure
SNTBP |
South and north tower bases |
ASLPr |
Approach span piers, S3 to S8 and N3 |
STP |
South tower piles |
ASMPr |
Approach span piers, S1, S2, N1 and N2 |
NTP |
North tower piles |
ACS (Piled) |
S1, S2, S3, S4, N1 pile caps and piles |
CTB |
Central tower base |
ACS (Pad) |
S5 to S8 and N2, pads |
Table 12: Estimated embodied energy and carbon associated with each component of substructure
Structure |
Embodied Energy GJ |
Percentage of Total |
Embodied Carbon (tCO2) |
Percentage of Total |
|---|---|---|---|---|
SNTBP |
320,019 |
43% |
23,701 |
42% |
STP |
76,074 |
10% |
5,962 |
11% |
NTP |
61,815 |
8% |
4,864 |
9% |
CTB |
33,585 |
5% |
3,807 |
7% |
ASC (Piled) |
208,318 |
28% |
14,408 |
25% |
ASC (Pad) |
16,557 |
2% |
1,363 |
2% |
ASMPr |
11,151 |
2% |
978 |
2% |
ASLPr |
15,467 |
2% |
1,364 |
2% |
Total |
742,986 |
100% |
56,448 |
100% |
(a) Cable-Stayed Bridge Options
Table 13 and Table 14 present a summary of embodied energy and carbon associated with materials to be used in each of the options for the cable-stayed bridge. These calculations are based on estimated material quantities and the application of appropriate energy and carbon values to calculate total embodied energy and carbon. Details of energy and carbon factors are provided in Annex A.
The assessment includes key materials associated with construction (i.e. steel, concrete, asphalt, etc). Material quantities are based on Stage 3 Design.
The total embodied energy associated with materials to be used in the cable-stayed bridge - orthotropic is 1,257,089 GJ, and the total embodied carbon is 98,491 tCO2. As shown in Figure 10, steel accounts for approximately 92% of the total embodied energy, while concrete accounts for about 6% of the total. As shown in Figure 11 steel accounts for approximately 89% of the total embodied carbon, while concrete accounts for about 11%.
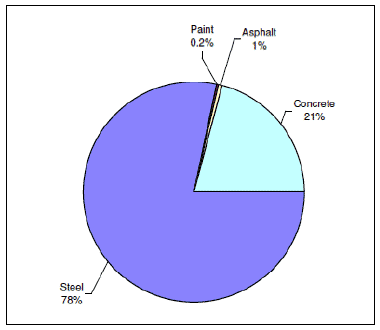
In comparison, the total embodied energy associated with materials to be used in the cable-stayed bridge - composite is 1,215,501 GJ, and the total embodied carbon is 100,044 tCO2. As shown in Figure 12 steel accounts for approximately 85% of the total embodied energy, while concrete accounts for about 12% of the total. As shown in Figure 13, steel accounts for approximately 78% of the total embodied carbon, while concrete accounts for about 21%.
Table 13: Estimated embodied energy and carbon for cable-stayed bridge - Orthotropic
Cable-Stayed Bridge - Single Deck Box Girder - Orthotropic |
|||
|---|---|---|---|
Category |
Material |
Energy |
Carbon |
GJ |
tCO2 |
||
Metals |
Steel: general (UK typical) |
839,641 |
60,908 |
Steel: general (primary) |
1,723 |
134 |
|
Steel: bar & rod (UK Typical) |
115,915 |
8,058 |
|
Steel: bar & rod (Primary) |
2,184 |
161 |
|
Steel: wire |
133,956 |
10,530 |
|
Stainless steel |
65,545 |
7,109 |
|
Misc |
Paint |
5,465 |
286 |
Quarry Sourced Materials |
Asphalt |
19,752 |
342 |
Concrete |
Concrete (high strength) |
72,908 |
10,962 |
Concrete (general road and pavement) |
0 |
0 |
|
Total |
1,257,089 |
98,491 |
|
Figure 10: Percentage of embodied energy in cable-stayed bridge by material type – orthotropic
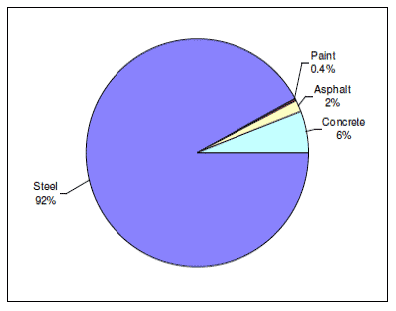
Figure 11: Percentage of embodied carbon in cable-stayed bridge by material type – orthotropic
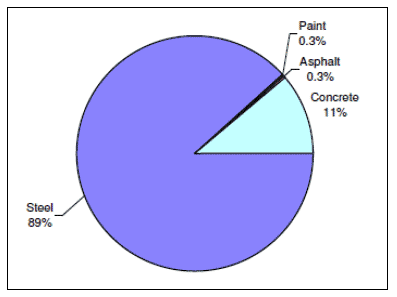
Table 14: Estimated embodied energy and carbon for cable-stayed bridge - composite
Cable-Stayed Bridge - Single Deck Box Girder - Composite |
|||
|---|---|---|---|
Category |
Material |
Energy |
Carbon |
GJ |
tCO2 |
||
Metals |
Steel: general (UK typical) |
571,607 |
41,465 |
Steel: general (primary) |
1,757 |
137 |
|
Steel: bar & rod (UK Typical) |
204,844 |
14,239 |
|
Steel: bar & rod (Primary) |
2,184 |
161 |
|
Steel: wire |
193,572 |
15,217 |
|
Stainless steel |
65,545 |
7,109 |
|
Misc |
Paint |
3,953 |
207 |
Quarry Sourced Materials |
Asphalt |
32,224 |
558 |
Concrete |
Concrete (high strength) |
138,327 |
20,799 |
Concrete (general road and pavement) |
1,488 |
152 |
|
Total |
1,215,501 |
100,044 |
|
Figure 12: Percentage of embodied energy in cable-stayed bridge by material type - composite
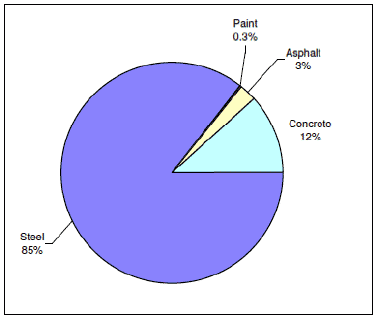
Figure 13: Percentage of embodied carbon in cable-stayed bridge by material type – composite
(b) Approach Viaduct Options
Table 15 and Table 16 present a summary of embodied energy and carbon associated with materials to be used in each of the options for the approach viaducts. As before, these calculations are based on estimated material quantities and the application of appropriate energy and carbon values to give total embodied energy and carbon.
The assessment includes key materials associated with construction (i.e. steel, concrete, asphalt, etc). Material quantities are based on Stage 3 Design.
The total embodied energy associated with materials to be used in the approach viaduct- composite is 249,815 GJ, and the total embodied carbon is 20,666 tCO2. As shown in Figure 14 steel accounts for approximately 83% of the total embodied energy, while concrete accounts for about 14% of the total. As shown in Figure 15 steel accounts for approximately 73% of the total embodied carbon, while concrete accounts for about 26%.
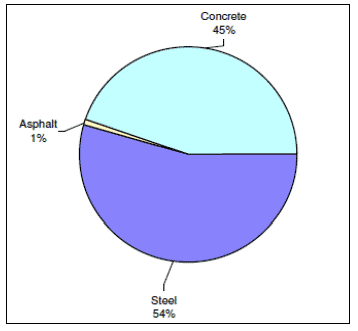
In comparison, the total embodied energy associated with materials to be used in the approach viaduct - concrete is 219,265 GJ, and the total embodied carbon is 20,588 tCO2. As shown in Figure 16 steel accounts for approximately 68% of the total embodied energy, while concrete accounts for about 28% of the total. As shown in Figure 17 steel accounts for approximately 54% of the total embodied carbon, while concrete accounts for about 45%.
Table 15: Estimated embodied energy and carbon for approach viaduct - composite
Approach Bridge - Twin Composite Box Girder |
|||
|---|---|---|---|
Category |
Material |
Energy |
Carbon |
GJ |
tCO2 |
||
Metals |
Steel: general (UK Typical |
134,479 |
9,755 |
Steel: general (UK Primary) |
1,271 |
99 |
|
Steel: bar & rod |
57,807 |
4,018 |
|
Steel: wire |
0 |
0 |
|
Stainless steel |
12,315 |
1,336 |
|
Misc |
Paint |
699 |
37 |
Quarry Sourced Materials |
Asphalt |
8,046 |
139 |
Concrete |
Concrete (high strength) |
34,979 |
5,259 |
Concrete (general road and pavement) |
218 |
22 |
|
Total |
249,815 |
20,666 |
|
Figure 14: Percentage of embodied energy in approach viaduct by material type - composite
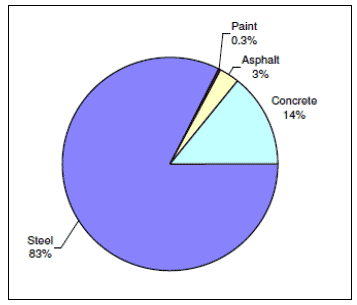
Figure 15: Percentage of embodied carbon in approach viaduct by material type – composite
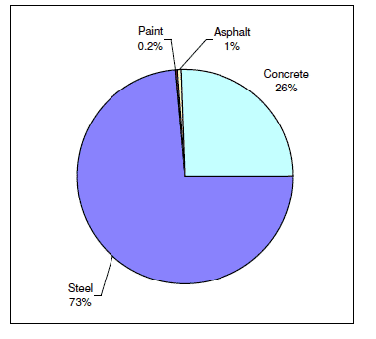
Table 16: Estimated embodied energy and carbon for approach viaduct - concrete
Approach Bridge - Twin Concrete Box Girder |
|||
|---|---|---|---|
Category |
Material |
Energy |
Carbon |
GJ |
tCO2 |
||
Metals |
Steel: general (UK Typical |
27,650 |
2,006 |
Steel: general (UK Primary) |
1,359 |
106 |
|
Steel: bar & rod |
85,482 |
5,942 |
|
Steel: wire |
23,030 |
1,810 |
|
Stainless steel |
12,315 |
1,336 |
|
Quarry Sourced Materials |
Asphalt |
8,046 |
139 |
Concrete |
Concrete (high strength) |
61,164 |
9,197 |
Concrete (general road and pavement) |
218 |
22 |
|
Total |
219,265 |
20,558 |
|
Figure 16: Percentage of embodied energy in approach viaduct by material type - concrete
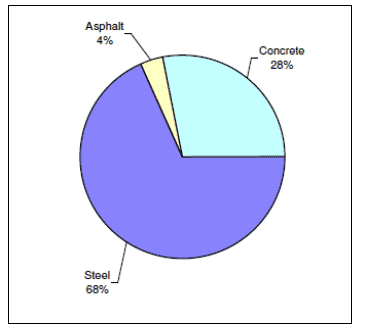
Figure 17: Percentage of embodied carbon in approach viaduct by material type - concrete
4.4 Combination of Options for Main Crossing Superstructure
Table 17 and Table 18 present a summary of embodied energy and carbon associated with potential options for the Main Crossing superstructure. In terms of embodied energy, option 1 is highest with a total embodied energy of 1,506,904 GJ. Option 4 would have the lowest embodied energy, 1,434,766 GJ. The difference between highest and lowest is 72,138 GJ, or approximately 5%.
In terms of embodied carbon, option 2 is highest with a total embodied carbon of 120,710 tCO2. Option 3 would have the lowest embodied carbon, 119,049 tCO2. The difference between highest and lowest is 1,661 tCO2, or approximately 1.4% which is considered to be minimal.
Table 17: Summary of estimated embodied energy associated with combination of options for the main crossing superstructure
Cable-Stayed Bridge |
|||
Orthotropic |
Composite |
||
Embodied Energy (GJ) |
|||
Approach Viaduct |
Composite |
Option 1) 1,506,904 |
Option 2) 1,465,316 |
Concrete |
Option 3) 1,476,353 |
Option 4) 1,434,766 |
|
Table 18: Summary of estimated embodied carbon associated with combination of options for the main crossing superstructure
Cable-Stayed Bridge |
|||
Orthotropic |
Composite |
||
Embodied Carbon (tCO2) |
|||
Approach Viaduct |
Composite |
Option 1) 119,157 |
Option 2) 120,710 |
Concrete |
Option 3) 119,049 |
Option 4) 120,602 |
|
4.5 Embodied Energy and Carbon Summary
Table 19 provides a summary of total embodied energy and carbon for each component of the scheme. In the case where Option 1 is chosen for the Main Crossing superstructure, the total embodied energy for the scheme would be 3,129,574 GJ and the total embodied carbon would be 232,074 tCO2.
The Main Crossing superstructure (cable-stayed bridge and approach viaduct) makes up the greatest proportion of total embodied energy and carbon. In the case where Option 1 above is chosen, the main crossing superstructure would account for approximately 48% of the overall embodied energy of the scheme. Under this scenario, the main crossing substructure would account for around 24% of total embodied energy, while land-based structures and the road network would make up 17% and 11% respectively.
Figure 18 provides a summary of total embodied energy for each component of the scheme, with Option 1 selected for the superstructure. Similarly, Figure 18 provides a summary of total embodied carbon for each component of the scheme.
Table 19: Summary of the estimated total embodied energy and carbon for each component of the scheme
| Component |
Energy |
Carbon |
|
|---|---|---|---|
| GJ |
tCO2 |
||
| Road Network |
342,794 |
8,701 |
|
| Land-Based Structures |
536,890 |
47,768 |
|
| Main Crossing Substructure |
742,986 |
56,448 |
|
| Main Crossing Superstructure |
Option 1 |
1,506,904 |
119,157 |
| Option 2 |
1,465,316 |
120,710 |
|
| Option 3 |
1,476,353 |
119,049 |
|
| Option 4 |
1,434,766 |
120,602 |
|
Figure 18: Summary of the estimated total embodied energy and for each component of the scheme (under option 1 for main crossing)
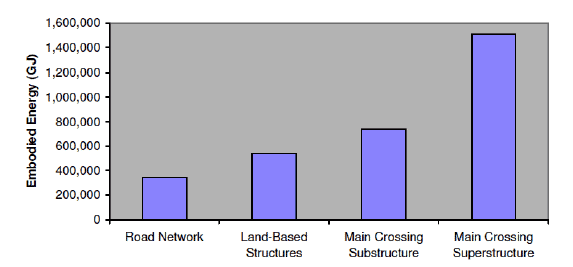
Figure 19: Summary of the estimated total embodied carbon and for each component of the scheme (under option 1 for main crossing superstructure)
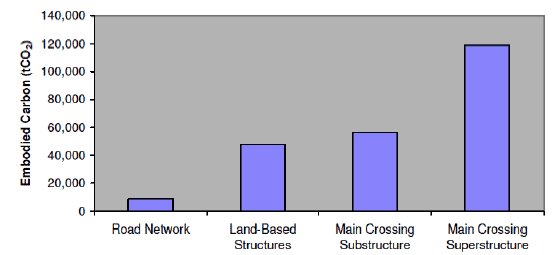
Table 20 and Table 21 below give a summary of embodied energy and carbon broken down by material type for each component of the scheme. In the case where Option 1 is chosen for the main crossing superstructure, steel accounts for approximately 75% of total embodied energy. Quarry sourced materials (aggregates, stone, asphalt, etc) make up around 14% of total embodied energy, while cement and concrete account for around 11% and paint accounts for less than 1% of the total.
In terms of carbon, again assuming Option 1 is chosen, steel accounts for approximately 73% of total embodied carbon. Quarry sourced materials make up around 5% of total embodied carbon, while cement and concrete account for around 22% and paint accounts for less than 1% of the total.
Table 20: Summary of the estimated embodied energy by material type for each component of the scheme
Category |
Material Type |
Embodied Energy (GJ) |
||||||
|---|---|---|---|---|---|---|---|---|
Road Network |
Structures |
Substructure |
Main Crossing |
|||||
Option 1 |
Option 2 |
Option 3 |
Option 4 |
|||||
Cement |
Cement: general - 50% blast furnace slag |
|
|
52,260 |
|
|
|
|
Metals |
Steel: general (UK typical) |
|
|
397,410 |
974,120 |
706,086 |
867,291 |
599,257 |
Steel: general (primary) |
|
|
|
2,993 |
3,027 |
3,082 |
3,116 |
|
Steel: bar & rod (UK Typical) |
|
193,036 |
|
173,722 |
262,651 |
201,397 |
290,326 |
|
Steel: bar & rod (Primary) |
|
|
|
2,184 |
2,184 |
2,184 |
2,184 |
|
Steel: section |
|
179,883 |
|
|
|
|
|
|
Steel: wire |
|
|
|
133,956 |
193,572 |
156,986 |
216,602 |
|
Steel: stainless |
|
|
|
77,860 |
77,860 |
77,860 |
77,860 |
|
Sheet piling: heavy use |
|
|
208,986 |
|
|
|
|
|
Misc |
Paint (Average) |
|
|
|
6,165 |
4,652 |
5,465 |
3,953 |
Quarry Sourced Materials |
Quarried aggregate |
|
|
3,726 |
|
|
|
|
Recycled aggregate |
|
|
582 |
|
|
|
|
|
General aggregate |
84,662 |
28,260 |
|
|
|
|
|
|
Asphalt |
258,132 |
|
|
27,798 |
40,271 |
27,798 |
40,271 |
|
Sand |
|
|
2,264 |
|
|
|
|
|
Stone: general |
|
|
27,060 |
|
|
|
|
|
Concrete |
General Road and Pavement |
|
|
39,614 |
218 |
1,706 |
218 |
1,706 |
High Strength |
|
133,957 |
11,084 |
107,888 |
173,307 |
134,072 |
199,491 |
|
Prefabricated Concrete |
|
1,754 |
|
|
|
|
|
|
Total |
342,794 |
536,890 |
742,986 |
1,506,904 |
1,465,316 |
1,476,353 |
1,434,766 |
|
Table 21: Summary of the estimated embodied carbon by material type for each component of the scheme
Category |
Material Type |
Embodied Carbon (tCO2) |
||||||
|---|---|---|---|---|---|---|---|---|
Road Network |
Structures |
Substructure |
Main Crossing |
|||||
Option 1 |
Option 2 |
Option 3 |
Option 4 |
|||||
Cement |
Cement: general - 50% blast furnace slag |
|
|
7,813 |
|
|
|
|
Metals |
Steel: general (UK typical) |
|
|
25,791 |
70,664 |
51,220 |
62,914 |
43,471 |
Steel: general (primary) |
|
|
|
233 |
236 |
240 |
243 |
|
Steel: bar & rod (UK Typical) |
|
13,418 |
|
12,076 |
18,257 |
14,000 |
20,181 |
|
Steel: bar & rod (Primary) |
|
|
|
161 |
161 |
161 |
161 |
|
Steel: section |
|
12,606 |
|
|
|
|
|
|
Steel: wire |
|
|
|
10,530 |
15,217 |
12,341 |
17,027 |
|
Steel: stainless |
|
|
|
8,445 |
8,445 |
8,445 |
8,445 |
|
Sheet piling: heavy use |
|
|
15,160 |
|
|
|
|
|
Misc |
Paint (Average) |
|
|
|
323 |
244 |
286 |
207 |
Quarry Sourced Materials |
Quarried aggregate |
|
|
298 |
|
|
|
|
Recycled aggregate |
|
|
34 |
|
|
|
|
|
General aggregate |
4,233 |
1,413 |
|
|
|
|
|
|
Asphalt |
4,468 |
|
|
481 |
697 |
481 |
697 |
|
Sand |
|
|
113 |
|
|
|
|
|
Stone: general |
|
|
1,515 |
|
|
|
|
|
Concrete |
General Road and Pavement |
|
|
4,057 |
22 |
175 |
22 |
175 |
High Strength |
|
20,142 |
1,667 |
16,222 |
26,058 |
20,159 |
29,995 |
|
Prefabricated Concrete |
|
189 |
|
|
|
|
|
|
Total |
8,701 |
47,768 |
56,448 |
119,157 |
120,710 |
119,049 |
120,602 |
|
5 Carbon Emissions Associated with Earthworks
5.1 Maximising the Cut and Fill Balance
An earthworks strategy has been developed for the proposed scheme that reviews the earthworks material available on site, potential sources of imported material, the earthworks balance, options available for improving the earthworks balance and the impact that the proposed construction programme will have on the earthworks balance. Attention has been paid to earthworks geometry, such as flat slopes to allow lower grade material to be used in fill or steepened slopes with reinforcement, soil nails or reinforced embankments, in an attempt to reduce cut and fill quantities and to minimise the need to import or export fill to and from the site.
The earthworks strategy has allowed the development of the Stage 3 design and will be further developed to aid the final design within the constraints of the EIA and ES, minimising both the volume of imported material required and the surplus destined for disposal.
The import of fill material has been taken account within the carbon footprint calculations presented in Section 4.2 above, where earthworks fill materials have been referred to as ‘general aggregate’. The emission factor for general aggregate was selected as the most appropriate in view of the nature of the earthworks materials likely to be handled.
Notwithstanding the efficiency gains that will be generated by the cut and fill balance, it is estimated that there will be a certain quantity of material that will be unusable and will therefore need to be disposed of and the implications of this to the carbon footprint is covered in Section 5.2 below.
5.2 Export of Unacceptable Earthwork Material
Table 22 provides estimated quantities of earthwork materials to be exported from site. These quantities are based on Stage 3 Design. In total, it is estimated that 115,000m3 of material would be removed from site (refer to Chapter 4 of the ES). Note that this does not include potential material exported for land-based structures.
Table 22: Estimated quantities of earthwork materials to be removed from site (Stage 3 Design)
|
M9 Junction 1a |
Queensferry Junction |
Ferrytoll Junction |
|---|---|---|---|
| Estimated Export (m3) |
20,000 |
55,000 |
40,000 |
N.B. These quantities do not include potential export of material for structures
Table 24 provides an estimate of the carbon emissions associated with the removal of this waste material from site. It is estimated that the waste is transported on average 35km from site (refer to Table 23).
The emissions factor for transport is taken from the HA Accounting Tool (HA 2008; HA 2009). The calculations indicate that the removal of waste earthwork materials from site results in the emission of an estimated 2,555 tCO2.
Table 23: Potential material disposal (landfill) sites and estimated distance
| Name |
Estimated Distance (km) |
|---|---|
| Binn Farm Landfill |
39.9 |
| Avondale Landfill |
21.1 |
| Avondale Hazardous Landfill |
21.1 |
| West Carron Landfill |
31.0 |
| Lochhead Landfill Site |
13.7 |
| Oatslie Sandpit Landfill |
31.7 |
| Levenseat Landfill |
37.5 |
| Greengairs Landfill |
56.6 |
| Greenoakhill Landfill |
56.5 |
| Average |
35.0 |
Table 24: Carbon emissions associated with the removal of waste earthworks material from site
| Category |
Material |
Mass (tonnes) |
Average waste removal distance (km) |
Road Transport (tCO2/t.km) |
Carbon (tCO2) |
|---|---|---|---|---|---|
| Waste removal |
Inert waste |
230,000* |
35.0 |
0.0003174 |
2,555 |
* Assumed 2.0 tonnes per m3
6 Options to Reduce Embodied Energy and Carbon
As well as maximising the earthworks cut and fill balance which can make a positive contribution to reducing the carbon footprint of the scheme, there may be further potential for reducing embodied energy and carbon associated with the road network by using recycled aggregate from other local sources, where this is appropriate, instead of quarried aggregate.
Table 25: Comparison of carbon values for recycled and quarried aggregate
Type of Material |
Embodied Carbon Value (tCO2/t) |
|---|---|
Recycled Aggregate |
0.00369 |
Quarried Aggregate |
0.00800 |
Table 25 above compares embodied carbon values for recycled and quarried aggregate. These values are taken directly from the Highways Agency Carbon Accounting Tool (HA 2008; HA 2009). Based on these values, it is estimated that the carbon intensity of recycled aggregate is 54% lower compared to quarried material.
Transport is likely to be significant for aggregates and the proximity of material sources and method of transport to site could have a greater overall influence on energy and carbon.
There is likely to be a large volume of material generated on site from rock cuts and from quarrying the existing roads that could be processed and re-used on site for capping, sub-base and a percentage of road-base. An earthworks strategy has been developed for the proposed scheme which reviews the earthworks material available on site, potential sources of imported material, the earthworks balance, and options available for improving the earthworks balance. The earthworks strategy will aid the final design and help to minimise both the volume of imported material required and the surplus destined for disposal.
As reported in Section 4.13.2 of the Sustainability Appraisal and Carbon Management Report, earthworks materials will be sourced locally where appropriate with the aim of reducing haulage distance for imported fill and for exported material.
Table 26 shows embodied energy and carbon values associated with steel materials from different sources. Values are given for steel from primary sources, secondary sources, and for the market average.
The embodied energy and carbon of steel from secondary sources is approximately 75% lower than that from primary sources (on a tonne for tonne basis). This shows that there may be significant savings to be made (in terms of a reduction in embodied energy and carbon) by using an increased proportion of recycled steel in the project where this is appropriate, as steel accounts for a major proportion of the overall embodied energy and carbon. However, other sustainability factors should also be considered, such as durability and the life span of products, maintenance requirements, performance, and ability to re-use materials after decommissioning.
Table 26: Comparing embodied energy and carbon values for steel
Material |
Embodied Energy (MJ/kg) |
Embodied Carbon Kg CO2/Kg |
||||
|---|---|---|---|---|---|---|
UK Typical |
Primary |
Secondary |
UK Typical |
Primary |
Secondary |
|
General Steel |
24.4 |
35.3 |
9.5 |
1.77 |
2.75 |
0.43 |
Bar and Rod |
24.6 |
36.4 |
8.8 |
1.71 |
2.68 |
0.42 |
7 Carbon Emissions Associated with Transport of Materials
This section examines emissions of carbon associated with the transport of materials to site. Emissions from transport will depend on: a) the quantity of material to be transported; b) where the material is sourced from (i.e. distance to site); and c) the predominant mode of transport used.
Table 27 provides carbon emissions values associated with different modes of transport. These values are taken from DEFRA’s published GHG conversion factors (DEFRA 2009b) and are expressed in terms of kg CO2e (carbon equivalent) emitted in order to transport one tonne of material a distance of one kilometre. Please note that all DEFRA guidance uses the unit CO2e (carbon equivalent), rather than just CO2 as used in the HA model above (refer to Section 2.2).
Table 27: Carbon emission values associated with transport of materials to site (DEFRA 2009b)
Mode of Transport |
Carbon Emissions (kg CO2e/tonne.km) |
|---|---|
Articulated HGV (UK average) |
0.0860 |
Rail Freight |
0.0319 |
Shipping (Large bulk carrier) |
0.0071 |
7.2 Illustrative Sourcing Scenarios
For the purposes of this illustrative exercise the following four sourcing scenarios for steel are considered:
Option 1) All steel sourced a distance of 400 km from site and transported by rail to site
Option 2) All steel sourced a distance of 400 km (approximate distance Edinburgh to Sheffield) from site and transported by road to site
Option 3) All steel sourced from Rotterdam, the Netherlands, (approximately 730km3) and transported by sea to site
Option 4) All steel sourced from China (approximately 17,000 km4) and transported by sea to site
The results are summarised below in Table 28. These calculations are for emissions associated with transport only. Emissions associated with embodied carbon (i.e. carbon produced during extraction, processing and manufacture) are not shown in Table 28 (as estimated in Section 4 above, total embodied carbon associated steel is approximately 170,000 tCO2).
Table 28: Carbon emissions associated with the different sourcing options
Material |
Total Mass of Steel Material (tonnes) |
Carbon Emissions associated with Transport (tCO2e) |
|||
|---|---|---|---|---|---|
Option 1 |
Option 2 |
Option 3 |
Option 4 |
||
Steel |
90,000 |
1,148 |
3,096 |
466 |
10,863 |
Of the three options, Option 3 would result in the lowest amount of CO2e being emitted, while Option 4 would result in the highest. Option 4 is over 23 times more carbon polluting than Option 3. Choosing option 3 over option 4 would result in a carbon ‘saving’ of 10,397 tCO2e.
Please note, material quantities are provisional only at this stage and are based on currently available estimates provided by the Design Team. Material quantities will also vary depending on the type of design selected for the Main Crossing. For this exercise, material quantities were based on the selection of the orthotropic option for the cable-stayed bridge and the composite option for the approach viaduct.
Carbon emissions associated with the transport of steel materials to site are relatively low compared to the embodied carbon content in steel (estimated to be between 1% to 5%). Steel has a high embodied energy and carbon content and accounts for a major proportion of the overall ‘footprint’ of the scheme.
8 The Shadow Price of Carbon
In 2007 DEFRA published revised guidance on how to value greenhouse gas emissions in government appraisals (DEFRA 2007b). This is for use in all policy and project appraisals across government with significant effects on carbon emissions. The guidance adopts the concept of the Shadow Price of Carbon (SPC) as the basis for incorporating carbon emissions in cost-benefit analysis and impact assessments.
The shadow price of carbon (SPC) is used to value the expected increase or decrease in emissions of greenhouse gas emissions resulting from a proposed policy. Put simply, the SPC reflects the damage costs of climate change caused by each additional tonne of greenhouse gas emitted – converted into carbon dioxide equivalent (CO2e) for ease of comparison. The value of the shadow price of carbon used in this report is based on DEFRA guidance of 2007. It should however be noted that since undertaking this exploratory work a recent update on carbon valuation has been produced by the Department of Energy and Climate Change (DECC) - Carbon Valuation in UK Policy Appraisal: A Revised Approach Climate Change Economics, Department of Energy and Climate Change July 2009 (DECC 2009). Future work on carbon valuation will reflect the changes introduced in this revised approach.
The SPC is different from the previously used social cost of carbon (SCC) in that it takes more account of uncertainty and is based on a stabilisation trajectory. Including the benefits of lower CO2e emissions from a policy designed to reduce them (or a policy with a different objective that also reduced CO2e as a co-benefit) in the policy’s appraisal would make the policy relatively more attractive - either in comparison to alternatives with worse CO2e impacts, or by increasing the scale of the benefits relative to costs. Accounting for such environmental benefits aids ‘green’ policy-making.
Similarly, valuing the additional CO2e emitted by a policy would add to its overall costs and make it a relatively less attractive option than one with lower additional CO2e emissions (or indeed CO2e savings). It is possible that including the monetised value of a policy that increases CO2e emissions may even switch the balance of costs and benefits so that the costs outweighed the benefits.
DEFRA has produced guidance on how to value greenhouse gas emissions in government appraisal. This guidance is outlined below in four steps:
Step 1: Quantify the impact of greenhouse gas emissions, giving the figures in tonnes of carbon dioxide equivalent
Set out the exact quantity of carbon dioxide – or CO2 equivalent – the policy is expected to save/emit each year in a spreadsheet. This should be a net change from an assumed baseline rate of emissions. The assumed baseline are emissions in the absence of the policy.
Step 2: Calculate the correct schedule of the Shadow Price of Carbon to use and set it alongside the quantities of greenhouse gas saved
- The value of the Shadow Price of Carbon (SPC) is dependent upon the year the carbon is abated/emitted.
- In the year 2000, in year 2000 prices the SPC is set to £19 per tonne CO2e.
- The SPC rises over time for two reasons:
- to account for observed (and assumed) inflation; and
- increasing by 2 per cent per year to account for rising damage costs from higher greenhouse gas concentrations.
- Do not use the same value of the SPC for each year. Use the tables below to find the SPC for each year of your policy, i.e. a SPC schedule. Alternatively, use the tables to find the SPC in the start year of the policy, then add 2% per year to it.
Table 29: SPC from 2007 to 2050 (in 2009 prices) (adapted from DEFRA 2007b)
Year |
2007 |
2008 |
2009 |
2010 |
2011 |
2012 |
2013 |
2014 |
2015 |
2016 |
2017 |
2018 |
|||
|---|---|---|---|---|---|---|---|---|---|---|---|---|---|---|---|
SPC in 2009 prices and with 2% pa increases (£) |
26.5 |
27.1 |
27.6 |
28.2 |
28.7 |
29.3 |
29.9 |
30.5 |
31.1 |
31.7 |
32.3 |
33.0 |
|||
|
|||||||||||||||
2019 |
2020 |
2021 |
2022 |
2023 |
2024 |
2025 |
2026 |
2027 |
2028 |
2029 |
2030 |
2031 |
2032 |
2033 |
2034 |
33.6 |
34.3 |
35.0 |
35.7 |
36.4 |
37.1 |
37.9 |
38.6 |
39.4 |
40.2 |
41.0 |
41.8 |
42.7 |
43.5 |
44.4 |
45.3 |
|
|||||||||||||||
2035 |
2036 |
2037 |
2038 |
2039 |
2040 |
2041 |
2042 |
2043 |
2044 |
2045 |
2046 |
2047 |
2048 |
2049 |
2050 |
46.2 |
47.1 |
48.1 |
49.0 |
50.0 |
51.0 |
52.0 |
53.1 |
54.1 |
55.2 |
56.3 |
57.4 |
58.6 |
59.8 |
60.9 |
62.2 |
- All values of the SPC listed in Table 29 are in 2009 prices. These values have been adjusted from DEFRA’s guidance on greenhouse gas pricing (DEFRA 2007b). For policies appraised in other years or using another year’s price level (which may be appropriate if other costs and benefits are in a different year’s price level), the SPC must be adjusted.
Step 3: Multiply each year’s quantity of greenhouse gas emissions abated/emitted (expressed in CO2e) by that year’s Shadow Price of Carbon
- The spreadsheet should already have each year of the policy’s greenhouse gas emissions (expressed in CO2e), and a SPC schedule. Multiply these year by year.
Step 4: Use the monetised greenhouse gas values in your cost-benefit analysis
- Continue appraising the policy according to Green Book guidance. This includes showing the Net Present Value (NPV) of the carbon impacts in isolation and as part of the overall NPV. It also includes performing sensitivity analysis around the carbon impacts in the same way undertaken for other costs and benefits.
- During sensitivity analysis look out for whether a ±5% change in the SPC would turn a NPV positive policy into NPV negative, or visa versa, or where a higher or lower SPC would change the ranking of different policy options. If this is the case, it should be made clear in the appraisal, and borne in mind in the recommendation.
- Make all assumptions clear in the analysis and Impact Assessment. The policy appraisal must at least state the quantity of greenhouse gases and the value of these (i.e. quantity multiplied by the SPC).
General guidance on greenhouse gas policy appraisal can be found on the DEFRA website. This includes papers on the SPC, which give more detail on the rationale for using SPC and the theoretical background.
The following exercise provides an illustrative example of how the shadow price of carbon could be accounted for during project appraisal. Two scenarios are presented:
- ‘Scenario 1’ where the option for the main crossing includes an orthotropic steel deck and steel is sourced from Rotterdam (730 km) and transported to site by sea; and
- ‘Scenario 2’ where the option for the main crossing includes a composite deck and steel is sourced from China (17,000 km) and transported to site by sea.
Table 30: Comparison of embodied carbon associated with four different options for the Main Crossing and approach viaduct
Cable-Stayed Bridge |
|||
Orthotropic |
Composite |
||
Embodied Carbon (tCO2) |
|||
Approach Viaduct |
Composite |
119,157 |
120,710 |
Concrete |
119,049 |
120,602 |
|
Table 31: Comparison between the ‘Best Case’ and ‘Worst Case’ scenarios for carbon emissions
Scenario 1 (tCO2) |
Scenario 2 (tCO2) |
|
Embodied Carbon |
119,049 |
120,710 |
Transport of Steel |
466 |
10,863 |
Total |
119,515 |
131,573 |
Based on the above analysis, opting for Scenario 1 over Scenario 2 would result in a carbon ‘saving’ of:
- 131,573 – 119,515 = 12,058 tCO2e
Best practice guidance adopts the concept of the Shadow Price of Carbon (SPC) as the basis for incorporating carbon emissions in cost-benefit analysis and impact assessments. The SPC reflects the damage costs of climate change caused by each additional tonne of greenhouse gas emitted – converted into carbon dioxide equivalent (CO2e) for ease of comparison. This allows efficiency in design leading to a reduction in embodied carbon to be monetised at a current value.
9 Conclusions
The Forth Replacement Crossing Sustainable Development Policy (refer to Appendix 1) sets out the key sustainability principles and objectives which form a core thread throughout all the activities of the project team and stages in the project life cycle. Reducing the environmental impacts of the scheme, including lowering the carbon footprint, is integral to this policy.
This energy and carbon assessment is based on information contained in the Highways Agency Carbon Accounting Tool (HA 2008; HA 2009). Other key sources of data include the Inventory of Carbon and Energy produced by the University of Bath (University of Bath 2008) and DEFRA’s GHG conversion factors (DEFRA 2008). Estimated quantities of construction materials to be used in the scheme were provided by the relevant project design teams. The impact of scheme in terms of carbon emissions associated with vehicles using the crossing is discussed within the Chapter 15 (Air Quality) of the ES.
9.3 Results of Embodied Energy and Carbon Assessment
During the early stages of the project design an initial high-level carbon footprinting exercise was carried out to provide a high-level comparison of the carbon emissions associated with two scheme alternatives for the proposed Forth Replacement Crossing.
Based on this early analysis, it was calculated that Option FS2 (involving extensive new road network, three-corridor main crossing with separate provision for public transport) would result in approximately 68% (102,000 tonnes) more embodied carbon than Option MG2 (less extensive road network, two-corridor main crossing, and refurbishment of the FRB to allow use by public transport). This assessment also indicated that steel and concrete were responsible for the majority of the embodied carbon associated with materials to be used in the scheme.
Building on the high-level carbon footprinting exercise carried out at the initial design stage, a more detailed analysis was carried out based on Stage 3 Design which assessed the embodied energy and carbon associated with key materials.
The findings from this assessment indicate that, in the case where Option 1 (orthotropic cable-stayed bridge and composite approach viaduct) is chosen for the Main Crossing superstructure, the total embodied energy for the scheme would be 3,129,574 GJ and the total embodied carbon would be 232,074 tCO2.
The Main Crossing superstructure (cable-stayed bridge and approach viaduct) makes up the greatest proportion of total embodied energy and carbon. In the case where Option 1 is chosen, the Main Crossing superstructure would account for approximately 48% of the overall embodied energy of the scheme. Under this scenario, the Main Crossing substructure would account for around 24% of total embodied energy, while land-based structures and the road network would make up 17% and 11% respectively.
In terms of which materials make the greatest contributions to overall embodied energy, steel accounts for approximately 75%, quarry source materials (aggregates, stone, asphalt, etc) make up around 14%, while cement and concrete account for around 11% and paint accounts for less than 1% of the total.
9.4 Potential Options to Reduce Energy and Carbon
A number of options are being considered which are aimed at reducing embodied energy and carbon. Some of these include:
- using recycled aggregate rather than quarried aggregate;
- use of other recycled materials such as kerbs, plastic pipes, etc;
- using an increased proportion of recycled steel;
- implementation of a sustainable resource management framework;
- optimisation of cut and fill balance to minimise the need to import, or export, fill from site;
- use of pre-cast technologies; and
- various other design measures to achieve an efficient and economical design, thereby minimising material use.
An initial investigation of the carbon emissions associated with the transport of materials to site was also undertaken as part of this assessment. Various illustrative sourcing scenarios for steel materials were assessed, including: sourcing from within the UK and transporting by rail or road; shipping from Rotterdam to Rosyth; or shipping from China. The results of this exercise indicate that sourcing materials close to site and transporting them by the most sustainable means available could achieve significant carbon savings.
In terms of emissions of greenhouse gases such as CO2 associated with the operation of the scheme, the ES assessment (Chapter 15: Air Quality) predicted a 14,952 tonne increase in CO2 emissions in 2017 with the proposed scheme due to more vehicle kilometres being travelled. The scheme will increase the length of the majority of cross-Forth journeys by about 1km because the new crossing is slightly further west than the Forth Road Bridge.
Further assessment was carried out to more fully capture the localised effect of "stop-start" motoring conditions on the congested approaches to the Forth Road Bridge and the localised benefits to be derived from relieving these conditions. The assessment involved modelling a local network in the vicinity of the Forth Replacement Crossing using an alternative approach that better takes into account the emissions from such "stop-start" traffic conditions. Initial findings indicate that during the congested morning peak period, increased CO2 emissions from the additional distance travelled may be mitigated by reduced congestion that the proposed scheme will deliver relative to the situation without the scheme. There is less congestion relief in the evening peak and therefore the mitigating effect referred to above is less evident during this period.
In terms of impacts from vehicles using the crossing, the FRC scheme includes a number of features aimed at reducing CO2 emissions. Briefly, these include:
- use of Intelligent Transport Systems to improve network efficiency and decrease congestion;
- promoting modal shift, particularly through the provision of a public transport corridor on the FRB; and
- encouraging and facilitating active modes of transport (e.g. cycling) by minimising impacts on paths and cycle routes and improving these where feasible.
The energy and carbon assessment will form a ‘baseline’ against which future progress can be monitored. The Contractor will be expected to calculate embodied energy and carbon based on its design and this should not exceed, and should preferably improve on the baseline condition.
Annex A Energy and Carbon Values
Category |
Material Type |
Conversion |
Energy (GJ/t) |
Carbon (tCO2/t) |
Comments |
|---|---|---|---|---|---|
Cements
|
General |
1.5 tonnes/m3 |
4.6 |
0.83 |
|
Cement: general - 25% blast furnace slag |
1.86 tonnes/m3 |
3.81 |
0.64 |
|
|
Cement: general - 50% blast furnace slag |
1.86 tonnes/m3 |
3.01 |
0.45 |
|
Category |
Material Type |
Conversion |
Energy (GJ/t) |
Carbon (tCO2/t) |
Comments |
||||
UK Typical |
Primary |
Secondary |
UK Typical |
Primary |
Secondary |
||||
Metals |
Steel: general |
8.0 tonnes/m3 |
24.4 |
35.3 |
9.5 |
1.77 |
2.75 |
0.43 |
Estimated from UK's consumption of types of steel, and worldwide recycled content 42.7% |
Steel: bar & rod |
7.9 tonnes/m3 |
24.6 |
36.4 |
8.8 |
1.71 |
2.68 |
0.42 |
|
|
Steel: section |
8.0 tonnes/m3 |
25.4 |
36.8 |
10 |
1.78 |
2.78 |
0.44 |
|
|
Steel: wire |
8.0 tonnes/m3 |
- |
36.00 |
- |
2.83 |
- |
- |
|
|
Steel: stainless |
8.0 tonnes/m3 |
56.7 |
- |
- |
6.15 |
- |
- |
|
|
Sheet piling: heavy use |
0.9 tonnes/m2 |
24.4 |
35.3 |
9.5 |
1.77 |
|
|||
Category |
Material Type |
Conversion |
Energy (GJ/t) |
Carbon (tCO2/t) |
Comments |
|---|---|---|---|---|---|
Misc |
Paint (Average) |
1.2 kg/litre |
68 |
3.56 |
Large variations in data, especially for carbon emissions |
Category |
Material Type |
Conversion |
Energy (GJ/t) |
Carbon (tCO2/t) |
Comments |
|---|---|---|---|---|---|
Quarry Sourced Materials |
Quarried aggregate |
2.0 tonnes/m3 |
0.10 |
0.008 |
|
Recycled aggregate |
2.0 tonnes/m3 |
0.10 |
0.00369 |
||
General aggregate |
2.0 tonnes/m3 |
0.10 |
0.005 |
ICE database |
|
General Asphalt |
1.7 tonnes/m3 |
2.60 |
0.045 |
||
Sand |
1.85 tonnes/m3 |
0.10 |
0.005 |
||
Soil |
1.7 tonnes/m3 |
0.45 |
0.023 |
||
Stone: general |
2.0 tonnes/m3 |
1.00 |
0.056 |
Wide data range |
Category |
Material Type |
Conversion |
Energy |
Carbon |
Comments |
|---|---|---|---|---|---|
GJ/t |
tCO2/t |
||||
Concrete |
General Road and Pavement |
- | 1.24 |
0.127 |
|
High Strength |
- |
1.39 |
0.209 |
|
|
Prefabricated Concrete |
- |
2.00 |
0.215 |
|
|
Notes: |
|||||
Above values entered from Highways Agency Model and ICE Database on 17/7/09 |
|||||
The HA Model and ICE Database contain a comprehensive range of embodied energy and carbon values for construction materials |
|||||
Annex B Embodied Energy and Carbon Calculations
Road and Earthworks
Energy and Carbon Calculations for the Road Network and Earthworks
Component |
Category |
Material specification |
Mass (tonnes) |
Energy & Carbon values |
Energy |
Carbon |
|
|---|---|---|---|---|---|---|---|
GJ/t |
tCO2/t |
GJ |
tCO2 |
||||
Pavement |
Quarry Sourced Material |
General Asphalt |
88,751 |
2.60 |
0.045 |
230,752 |
3,994 |
Overlay |
General Asphalt |
10,531 |
2.60 |
0.045 |
27,381 |
474 |
|
Sub-base |
General aggregate |
52,206 |
0.100 |
0.005 |
5,221 |
261 |
|
Capping |
General aggregate |
104,413 |
0.10 |
0.005 |
10,441 |
522 |
|
Import of fill |
General aggregate |
690,000 |
0.10 |
0.01 |
69,000 |
3,450 |
|
Total |
342,794 |
8,701 |
|||||
Land-Based Structures
Summary of Energy and Carbon Calculations for Land-Based Structures
Structure |
Mass (tonnes) |
Energy & Carbon values |
Energy |
Carbon |
||
|---|---|---|---|---|---|---|
Category |
Material |
GJ/t |
tCO2/t |
GJ |
tCO2 |
|
Concrete |
Concrete: high strength |
96,372 |
1.39 |
0.209 |
133,957 |
20,142 |
Precast concrete |
877 |
2.00 |
0.215 |
1,754 |
189 |
|
Structure |
Mass (tonnes) |
Estimated Recycled Proportion (%) |
Embodied Energy (GJ/t) |
Embodied Carbon (tCO2/t) |
Energy |
Carbon |
|||
|---|---|---|---|---|---|---|---|---|---|
Category |
Material |
UK Typical |
Secondary |
UK Typical |
Secondary |
GJ |
tCO2 |
||
Metals |
Steel: bar & rod |
7,847 |
0 |
24.6 |
8.8 |
1.71 |
0.42 |
193,036 |
13,418 |
Steel: section |
7,082 |
0 |
25.4 |
10 |
1.78 |
0.44 |
179,883 |
12,606 |
|
Structure |
Mass (tonnes) |
Energy & Carbon values |
Energy |
Carbon |
||
|---|---|---|---|---|---|---|
Category |
Material |
GJ/t |
tCO2/t |
GJ |
tCO2 |
|
Quarry Sourced Materials |
General aggregate: Imported Fill |
282600 |
0.100 |
0.005 |
28,260 |
1,413 |
Total |
536,890 |
47,768 |
||||
Embodied Energy Calculations for Land-Based Structures
Structure |
Ferrytoll |
Queensferry Junction |
|||||||||||||
|---|---|---|---|---|---|---|---|---|---|---|---|---|---|---|---|
FT01/02 |
FT03 |
FT05 |
FT07E |
FT10E |
FT11 |
FT12 |
ESQ02 |
ESQ03 |
ESQ04 |
ESQ05 |
ESQ06 |
ESQ07 |
ESQ09E |
||
Category |
Material |
Embodied Energy GJ |
|||||||||||||
Concrete |
Concrete: high strength |
66,484 |
4,537 |
3,319 |
10,258 |
177 |
6,946 |
6,345 |
3,536 |
2,819 |
3,586 |
4,837 |
2,102 |
7,256 |
40 |
Precast concrete |
0 |
0 |
476 |
0 |
0 |
0 |
0 |
0 |
0 |
0 |
0 |
0 |
0 |
252 |
|
Metals |
Steel: bar & rod |
98,154 |
6,691 |
5,338 |
4,772 |
221 |
12,398 |
11,341 |
4,994 |
3,764 |
5,166 |
7,134 |
3,100 |
10,701 |
320 |
Steel: section |
147,244 |
6,985 |
0 |
0 |
0 |
0 |
0 |
6,858 |
3,556 |
7,620 |
0 |
0 |
0 |
0 |
|
Quarry Sourced Materials |
General aggregate: Imported Fill |
12,963 |
1,220 |
790 |
106 |
0 |
3,578 |
2,725 |
480 |
411 |
244 |
1,292 |
592 |
1,574 |
0 |
Structure |
M9 Junction 1A |
TOTAL |
||||||
|---|---|---|---|---|---|---|---|---|
M901 |
M903 |
M904 |
M905E |
M907E |
M908E |
|||
Category |
Material |
Embodied Energy GJ |
||||||
Concrete |
Concrete: high strength |
3,210 |
967 |
2,572 |
293 |
303 |
4,370 |
133,957 |
Precast concrete |
0 |
200 |
0 |
0 |
0 |
826 |
1,754 |
|
Metals |
Steel: bar & rod |
5,043 |
1,525 |
4,723 |
394 |
467 |
6,790 |
193,036 |
Steel: section |
7,620 |
0 |
0 |
0 |
0 |
0 |
179,883 |
|
Quarry Sourced Materials |
General aggregate: Imported Fill |
334 |
540 |
486 |
144 |
42 |
738 |
28,260 |
Total (GJ) |
536,890 |
|||||||
Information on Land-Based Structures
Structure |
Comments |
|
Ferrytoll |
FT01/FT02 |
Mainline Viaduct |
FT03 |
Ferrytoll Junction North - New Underbridge |
|
FT05 |
Railway bridge |
|
FT06E |
Structure Demolished |
|
FT07E |
Widening of Structure |
|
FT08E |
No Works required under Stage 3 |
|
FT09E |
No Works required under Stage 3 |
|
FT10E |
Minor works |
|
FT11 |
Proposed Retaining Wall |
|
FT12 |
Retaining Wall Gyratory Interchange South Bound |
|
Queensferry Junction |
ESQ02 |
Queensferry Junction North |
ESQ03 |
Queensferry Junction South |
|
ESQ04 |
New Overbridge |
|
ESQ05 |
Pipe Protection System |
|
ESQ06 |
Pipe Protection System |
|
ESQ07 |
Pipe Protection System |
|
ESQ08E |
Structure Demolished |
|
ESQ09E |
Minor Parapet Works |
|
M9 Junction |
M901 |
New Overbridge |
M903 |
New Underbridge |
|
M904 |
New Swine Burn Culvert |
|
M905E |
Minor works |
|
M906E |
Structure Retained |
|
M907E |
Culvert Extension |
|
M908E |
Reconstruction of Western Section |
|
Information on Main Crossing Substrutures:
SNTBP |
South and north tower bases |
ASLPr |
Approach span piers, S3 to S8 and N3 |
STP |
South tower piles |
ASMPr |
Approach span piers, S1, S2, N1 and N2 |
NTP |
North tower piles |
ACS (Piled) |
S1 to S4, N1 pile caps and piles |
CTB |
Central tower base |
ACS (Pad) |
S5 to S8 and N2, pads |
Embodied Carbon Calculations for Land-Based Structures
Structure |
Ferrytoll |
Queensferry Junction |
|||||||||||||
|---|---|---|---|---|---|---|---|---|---|---|---|---|---|---|---|
FT01/02 |
FT03 |
FT05 |
FT07E |
FT10E |
FT11 |
FT12 |
ESQ02 |
ESQ03 |
ESQ04 |
ESQ05 |
ESQ06 |
ESQ07 |
ESQ09E |
||
Category |
Material |
Embodied Carbon (tCO2) |
|||||||||||||
Concrete |
Concrete: high strength |
9,996 |
682 |
499 |
1,542 |
27 |
1,044 |
954 |
532 |
424 |
539 |
727 |
316 |
1,091 |
6 |
Precast concrete |
0 |
0 |
51 |
0 |
0 |
0 |
0 |
0 |
0 |
0 |
0 |
0 |
0 |
27 |
|
Metals |
Steel: bar & rod |
6,823 |
465 |
371 |
332 |
15 |
862 |
788 |
347 |
262 |
359 |
496 |
215 |
744 |
22 |
Steel: section |
10,319 |
490 |
0 |
0 |
0 |
0 |
0 |
481 |
249 |
534 |
0 |
0 |
0 |
0 |
|
Quarry Sourced Materials |
General aggregate: Imported Fill |
648 |
61 |
40 |
5 |
0 |
179 |
136 |
24 |
21 |
12 |
65 |
30 |
79 |
0 |
Structure |
M9 Junction 1A |
TOTAL |
||||||
|---|---|---|---|---|---|---|---|---|
M901 |
M903 |
M904 |
M905E |
M907E |
M908E |
|||
Category |
Material |
Embodied Carbon (tCO2) |
||||||
Concrete |
Concrete: high strength |
483 |
145 |
387 |
44 |
46 |
657 |
20,142 |
Precast concrete |
0 |
22 |
0 |
0 |
0 |
89 |
189 |
|
Metals |
Steel: bar & rod |
351 |
106 |
328 |
27 |
32 |
472 |
13,418 |
Steel: section |
534 |
0 |
0 |
0 |
0 |
0 |
12,606 |
|
Quarry Sourced Materials |
General aggregate: Imported Fill |
17 |
27 |
24 |
7 |
2 |
37 |
1,413 |
Total (tCO2) |
47,768 |
|||||||
Summary of Embodied Energy and Carbon Associated with Land-Based Structures
Structure |
Embodied Energy GJ |
Percentage of Total |
Embodied Carbon tCO2 |
Percentage of Total |
|---|---|---|---|---|
FT01/FT02 |
324,845 |
61% |
27,786 |
58% |
FT03 |
19,433 |
4% |
1,698 |
4% |
FT05 |
9,924 |
2% |
961 |
2% |
FT07E |
15,137 |
3% |
1,879 |
4% |
FT10E |
398 |
0% |
42 |
0% |
FT11 |
22,922 |
4% |
2,085 |
4% |
FT12 |
20,411 |
4% |
1,879 |
4% |
ESQ02 |
15,868 |
3% |
1,383 |
3% |
ESQ03 |
10,550 |
2% |
955 |
2% |
ESQ04 |
16,616 |
3% |
1,445 |
3% |
ESQ05 |
13,263 |
2% |
1,288 |
3% |
ESQ06 |
5,793 |
1% |
561 |
1% |
ESQ07 |
19,531 |
4% |
1,914 |
4% |
ESQ09E |
612 |
0% |
55 |
0% |
M901 |
16,207 |
3% |
1,384 |
3% |
M903 |
3,233 |
1% |
300 |
1% |
M904 |
7,781 |
1% |
739 |
2% |
M905E |
831 |
0% |
79 |
0% |
M907E |
812 |
0% |
80 |
0% |
M908E |
12,724 |
2% |
1,255 |
3% |
Total |
536,890 |
100% |
47,768 |
100% |
Main Crossing Substructure
Energy and Carbon Calculations for the Main Crossing Substructure
Structure |
Mass (tonnes) |
Energy & Carbon values |
Energy |
Carbon |
|||||
Category |
Material |
GJ/t |
tCO2/t |
GJ |
tCO2 |
||||
Cements |
Cement: general - 50% blast furnace slag |
17,362 |
3.01 |
0.45 |
52,260 |
7,813 |
|||
Structure |
Mass (tonnes) |
Estimated Recycled Proportion (%) |
Embodied Energy (GJ/t) |
Embodied Carbon (tCO2/t) |
Energy |
Carbon |
|||
Category |
Material |
UK Typical |
Secondary |
UK Typical |
Secondary |
GJ |
tCO2 |
||
Metals |
Steel: general |
23,446 |
50 |
24.4 |
9.5 |
1.77 |
0.43 |
397,410 |
25,791 |
Sheet piling: heavy use |
8,565 |
0 |
24.4 |
1.77 |
0 |
208,986 |
15,160 |
||
Structure |
Mass (tonnes) |
Estimated Recycled Proportion (%) |
Embodied Energy (GJ/t) |
Embodied Carbon (tCO2/t) |
Energy |
Carbon |
|||
Category |
Material |
UK Typical |
Secondary |
UK Typical |
Secondary |
GJ |
tCO2 |
||
Quarry Sourced Materials |
Quarried aggregate |
37,259 |
- |
0.1 |
0.008 |
3,726 |
298 |
||
Recycled aggregate |
5,822 |
50 |
- |
0.1 |
- |
0.00369 |
582 |
34 |
|
Sand |
22,643 |
- |
0.1 |
0.005 |
2,264 |
113 |
|||
Stone: general |
27,060 |
- |
1.0 |
0.056 |
27,060 |
1,515 |
|||
Structure |
Mass (tonnes) |
Energy & Carbon values |
Energy |
Carbon |
|||||
Category |
Material |
GJ/t |
tCO2/t |
GJ |
tCO2 |
||||
Concrete |
General Road and Pavement |
31,947 |
1.24 |
0.127 |
39,614 |
4,057 |
|||
High Strength |
7,974 |
1.39 |
0.21 |
11,084 |
1,667 |
||||
Total |
742,986 |
56,448 |
|||||||
Embodied Energy Calculations for the Main Crossing Substructure
Structure |
Estimated Recycled Proportion (%) |
SNTP |
STP |
NTP |
CTB |
ASC (Piled) |
ASC (Pad) |
ASMPr |
ASLPr |
Total |
|
|---|---|---|---|---|---|---|---|---|---|---|---|
Category |
Material |
Embodied Energy (GJ) |
|||||||||
Cements |
Cement: general - 50% blast furnace slag |
- |
26,334 |
0 |
0 |
5,860 |
9,081 |
3,763 |
2,989 |
4,232 |
52,260 |
Metals |
Steel: general |
50 |
199,298 |
14,967 |
12,831 |
11,577 |
131,905 |
8,645 |
7,661 |
10,526 |
397,410 |
Sheet piling: heavy use |
- |
91,256 |
42,432 |
32,989 |
0 |
42,310 |
0 |
0 |
0 |
208,986 |
|
Quarry Sourced Materials |
Quarried aggregate |
- |
1,675 |
0 |
0 |
0 |
948 |
378 |
300 |
425 |
3,726 |
Recycled aggregate |
50 |
462 |
0 |
0 |
120 |
0 |
0 |
0 |
0 |
582 |
|
Sand |
- |
994 |
0 |
0 |
0 |
535 |
252 |
200 |
283 |
2,264 |
|
Stone: general |
- |
0 |
0 |
0 |
0 |
23,540 |
3,520 |
0 |
0 |
27,060 |
|
Concrete |
General Road and Pavement |
- |
0 |
18,676 |
15,995 |
4,944 |
0 |
0 |
0 |
0 |
39,614 |
High Strength |
- |
0 |
0 |
0 |
11,084 |
0 |
0 |
0 |
0 |
11,084 |
|
Total (GJ) |
742,986 |
||||||||||
Embodied Carbon Calculations Substructure
Structure |
Estimated Recycled Proportion (%) |
SNTP |
STP |
NTP |
CTB |
ASC (Piled) |
ASC (Pad) |
ASMPr |
ASLPr |
Total |
|
|---|---|---|---|---|---|---|---|---|---|---|---|
Category |
Material |
Embodied Carbon (tCO2) |
|||||||||
Cements |
Cement: general - 50% blast furnace slag |
- |
3,937 |
0 |
0 |
876 |
1,358 |
563 |
447 |
633 |
7,813 |
Metals |
Steel: general |
50 |
12,934 |
971 |
833 |
751 |
8,560 |
561 |
497 |
683 |
25,791 |
Sheet piling: heavy use |
- |
6,620 |
3,078 |
2,393 |
0 |
3,069 |
0 |
0 |
0 |
15,160 |
|
Quarry Sourced Materials |
Quarried aggregate |
- |
134 |
0 |
0 |
0 |
76 |
30 |
24 |
34 |
298 |
Recycled aggregate |
50 |
27 |
0 |
0 |
7 |
0 |
0 |
0 |
0 |
34 |
|
Sand |
- |
50 |
0 |
0 |
0 |
27 |
13 |
10 |
14 |
113 |
|
Stone: general |
- |
0 |
0 |
0 |
0 |
1,318 |
197 |
0 |
0 |
1,515 |
|
Concrete |
General Road and Pavement |
- |
0 |
1,913 |
1,638 |
506 |
0 |
0 |
0 |
0 |
4,057 |
High Strength |
- |
0 |
0 |
0 |
1,667 |
0 |
0 |
0 |
0 |
1,667 |
|
Total (tCO2) |
56,448 |
||||||||||
Main Crossing Superstructure
Energy and Carbon Calculations for Main Crossing Superstructure Options Summary
Cable Stay Bridge - Single Deck Box Girder - Orthotropic |
||||||
|---|---|---|---|---|---|---|
Category |
Material |
Mass (tonnes) |
Energy and Carbon Values |
Energy |
Carbon |
|
GJ/t |
GJ |
GJ |
tCO2 |
|||
Metals |
Steel: general (UK typical) |
34,412 |
24.40 |
1.77 |
839,641 |
60,908 |
Steel: general (primary) |
49 |
35.30 |
2.75 |
1,723 |
134 |
|
Steel: bar & rod (UK Typical) |
4,712 |
24.60 |
1.71 |
115,915 |
8,058 |
|
Steel: bar & rod (Primary) |
60 |
36.40 |
2.68 |
2,184 |
161 |
|
Steel: wire |
3,721 |
36.00 |
2.83 |
133,956 |
10,530 |
|
Stainless steel |
1,156 |
56.70 |
6.15 |
65,545 |
7,109 |
|
Misc |
Paint: 100um thickness |
48 |
68 |
3.56 |
3,288 |
172 |
Paint: 300um thickness |
32 |
68 |
3.56 |
2,177 |
114 |
|
Quarry Sourced Materials |
25mm Asphalt |
227 |
2.60 |
0.045 |
589 |
10 |
70mm Asphalt |
5,011 |
2.60 |
0.045 |
13,030 |
226 |
|
125mm Asphalt |
2,359 |
2.60 |
0.045 |
6,133 |
106 |
|
Concrete |
Concrete (high strength) |
52,452 |
1.39 |
0.209 |
72,908 |
10,962 |
Concrete (general road and pavement) |
0 |
1.24 |
0.127 |
0 |
0 |
|
|
|
|
|
Total |
1,257,089 |
98,491 |
Cable Stay Bridge - Single Deck Box Girder - Orthotropic |
||||||||||
|---|---|---|---|---|---|---|---|---|---|---|
Material |
Embodied Energy (GJ) |
Percentage of Total |
Embodied Carbon (tCO2) |
Percentage of Total |
||||||
Steel: general (UK typical) |
839,641 |
67% |
60,908 |
62% |
||||||
Steel: general (primary) |
1,723 |
0% |
134 |
0% |
||||||
Steel: bar & rod (UK Typical) |
115,915 |
8,058 |
||||||||
Steel: bar & rod (Primary) |
2,184 |
0% |
161 |
0% |
||||||
Steel: wire |
133,956 |
10,530 |
||||||||
Stainless steel |
65,545 |
5% |
7,109 |
7% |
||||||
Paint |
5,465 |
0% |
286 |
0% |
||||||
Asphalt |
19,752 |
2% |
342 |
0% |
||||||
Concrete (high strength) |
72,908 |
6% |
10,962 |
11% |
||||||
Concrete (general road and pavement) |
0 |
0% |
0 |
0% |
||||||
Total |
1,257,089 |
100% |
98,491 |
100% |
||||||
Cable Stay Bridge - Single Deck Box Girder - Composite |
||||||||||
Category |
Material Steel: general (UK typical) |
Mass (tonnes) |
Energy and Carbon values |
Energy |
Carbon |
|||||
GJ/t |
tCO2/t |
GJ |
tCO2 |
|||||||
Metals |
23,427 |
24.40 |
1.77 |
571,607 |
41,465 |
|||||
Steel: general (primary) |
50 |
35.30 |
2.75 |
1,757 |
137 |
|||||
Steel: bar & rod (UK Typical) |
8,327 |
24.60 |
1.71 |
204,844 |
14,239 |
|||||
Steel: bar & rod (Primary) |
60 |
36.40 |
2.68 |
2,184 |
161 |
|||||
Steel: wire |
5,377 |
36.00 |
2.83 |
193,572 |
15,217 |
|||||
Stainless steel |
1,156 |
56.70 |
6.15 |
65,545 |
7,109 |
|||||
Category |
Material |
Mass (tonnes) |
Energy and Carbon values |
Energy |
Carbon |
|||||
GJ/t |
tCO2/t |
GJ |
tCO2 |
|||||||
Misc |
Paint: 100um thickness |
26 |
68 |
3.56 |
1,776 |
93 |
||||
Paint: 300um thickness |
32 |
68 |
3.56 |
2,177 |
114 |
|||||
Category |
Material |
Mass (tonnes) |
Energy and Carbon values |
Energy |
Carbon |
|||||
GJ/t |
tCO2/t |
GJ |
tCO2 |
|||||||
Quarry Sourced Materials |
25mm Asphalt |
1,086 |
2.60 |
0.045 |
2,824 |
49 |
||||
70mm Asphalt |
0 |
2.60 |
0.045 |
0 |
0 |
|||||
125mm Asphalt |
11,308 |
2.60 |
0.045 |
29,400 |
509 |
|||||
Category |
Material |
Mass (tonnes) |
Energy and Carbon values |
Energy |
Carbon |
|||||
GJ/t |
tCO2/t |
GJ |
tCO2 |
|||||||
Concrete |
Concrete (high strength) |
99,516 |
1.39 |
0.209 |
138,327 |
20,799 |
||||
Concrete (general road and pavement) |
1,200 |
1.24 |
0.127 |
1,488 |
152 |
|||||
Total |
1,215,501 |
100,044 |
||||||||
Cable Stay Bridge - Single Deck Box Girder - Composite |
||||
|---|---|---|---|---|
Material |
Embodied Energy (GJ) |
Percentage of Total |
Embodied Carbon (tCO2) |
Percentage of Total |
Steel: general (UK typical) |
571,607 |
47% |
41,465 |
41% |
Steel: general (primary) |
1,757 |
0% |
137 |
0% |
Steel: bar & rod (UK Typical) |
204,844 |
17% |
14,239 |
14% |
Steel: bar & rod (Primary) |
2,184 |
0% |
161 |
0% |
Steel: wire |
193,572 |
16% |
15,217 |
15% |
Stainless steel |
65,545 |
5% |
7,109 |
7% |
Paint |
3,953 |
0% |
207 |
0% |
Asphalt |
32,224 |
3% |
558 |
1% |
Concrete (high strength) |
138,327 |
11% |
20,799 |
21% |
Concrete (general road and pavement) |
1,488 |
0% |
152 |
0% |
Total |
1,215,501 |
100% |
100,044 |
100% |
Energy and Carbon Calculations for Approach Bridge Options
Approach Bridge - Twin Composite Box Girder |
||||||
|---|---|---|---|---|---|---|
Category |
Material |
Mass (tonnes) |
Energy and Carbon Values |
Energy |
Carbon |
|
GJ/t |
GJ |
GJ |
tCO2 |
|||
Metals |
Steel: general (UK typical) |
5,511 |
24.40 |
1.77 |
134,479 |
9,755 |
Steel: general (primary) |
36 |
35.30 |
2.75 |
1,271 |
99 |
|
Steel: bar & rod |
2,350 |
24.60 |
1.71 |
57,807 |
4,018 |
|
Steel: wire |
0 |
36.00 |
2.83 |
0 |
0 |
|
Stainless steel |
217 |
56.70 |
6.15 |
12,315 |
1,336 |
|
Misc |
Paint: 100um thickness |
3 |
68 |
3.56 |
200 |
10 |
Paint: 300um thickness |
7 |
68 |
3.56 |
499 |
26 |
|
Quarry Sourced Materials |
25mm Asphalt |
164 |
2.60 |
0.045 |
426 |
7 |
70mm Asphalt |
0 |
2.60 |
0.045 |
0 |
0 |
|
125mm Asphalt |
2,931 |
2.60 |
0.045 |
7,620 |
132 |
|
Concrete |
Concrete (high strength) |
25,165 |
1.39 |
0.209 |
34,979 |
5,259 |
Concrete (general road and pavement) |
176 |
1.24 |
0.127 |
218 |
22 |
|
|
|
|
|
Total |
249,815 |
20,666 |
Approach Bridge - Twin Composite Box Girder |
||||||
|---|---|---|---|---|---|---|
Category |
Material |
Mass (tonnes) |
Energy and Carbon Values |
Energy |
Carbon |
|
GJ/t |
GJ |
GJ |
tCO2 |
|||
Metals |
Steel: general (UK typical) |
1,133 |
24.40 |
1.77 |
27,650 |
2,006 |
Steel: general (primary) |
39 |
35.30 |
2.75 |
1,359 |
106 |
|
Steel: bar & rod |
3,475 |
24.60 |
1.71 |
85,482 |
5,942 |
|
Steel: wire |
640 |
36.00 |
2.83 |
23,030 |
1,810 |
|
Stainless steel |
217 |
56.70 |
6.15 |
12,315 |
1,336 |
|
Misc |
Paint: 100um thickness |
0 |
68 |
3.56 |
0 |
0 |
Paint: 300um thickness |
0 |
68 |
3.56 |
0 |
0 |
|
Quarry Sourced Materials |
25mm Asphalt |
164 |
2.60 |
0.045 |
426 |
7 |
70mm Asphalt |
0 |
2.60 |
0.045 |
0 |
0 |
|
125mm Asphalt |
2,931 |
2.60 |
0.045 |
7,620 |
132 |
|
Concrete |
Concrete (high strength) |
44,003 |
1.39 |
0.209 |
61,164 |
9,197 |
Concrete (general road and pavement) |
176 |
1.24 |
0.127 |
218 |
22 |
|
|
|
|
|
Total |
219,265 |
20,558 |
Approach Bridge - Twin Concrete Box Girder |
||||
|---|---|---|---|---|
Material |
Embodied Energy (GJ) |
Percentage of Total |
Embodied Carbon (tCO2) |
Percentage of Total |
Steel: general (UK Typical |
27,650 |
13% |
2,006 |
10% |
Steel: general (UK Primary) |
1,359 |
1% |
106 |
1% |
Steel: bar & rod |
85,482 |
39% |
5,942 |
29% |
Steel: wire |
23,030 |
11% |
1,810 |
9% |
Stainless steel |
12,315 |
6% |
1,336 |
6% |
Paint |
0 |
0% |
0 |
0% |
Asphalt |
8,046 |
4% |
139 |
1% |
Concrete (high strength) |
61,164 |
28% |
9,197 |
45% |
Concrete (general road and pavement) |
218 |
0% |
22 |
0% |
Total |
219,265 |
100% |
20,558 |
100% |
|
Cable Stay Bridge |
||
Orthotropic |
Composite |
||
Embodied Energy (GJ) |
|||
Approach Viaduct |
Composite |
1,506,904 |
1,465,316 |
Concrete |
1,476,353 |
1,434,766 |
|
Combination of Options for Main Crossing
Cable Stay Bridge |
|||
Orthotropic |
Composite |
||
Embodied Energy (GJ) |
|||
Approach Viaduct |
Composite |
119,157 |
120,710 |
Concrete |
119,049 |
120,602 |
|
Footnotes
1. 1 The carbon coefficients contained within the ICE database are generally consistent with those in the Highways Agency Carbon Accounting Tool. Where there are discrepancies these are noted in the calculation tables.
2. " http://www.distances.comal " material comes from secondary (i.e. recycled) sources.