Quantitative and monetary assessment
The appraisal of the impacts on ecosystem service benefit aligns with the recommendations and principles set out in the HM Treasury Green Book (HM Treasury, 2024). For the appraisal of impacts on natural capital (see Appendix A1. ‘Non-market Valuation and Unmonetisable Values’ of the Green Book), the Green Book sets out various recommendations but principally points towards Defra’s ENCA guidance (Defra, 2023) as supplementary, best practice guidance on this matter. The methods and evidence deployed for the assessment of each ecosystem service, detailed in the subsections below, were hence primarily aligned with those in the ENCA Services Databook.
All ecosystem service benefits were calculated as a ‘present value’ (PV) over both a 60-year and 100-year appraisal period, which encompass both the construction and operational phases of the proposed scheme. The former appraisal period aligns with that used across the other appraisals for the proposed scheme (for example, the traffic and transport appraisal) to ensure that the values calculated can be integrated into assessment of the wider scheme benefits. The 100-year appraisal period is in alignment with HM Treasury Green Book guidance on the period over which benefits should be calculated concerning interventions anticipated to have long-term effects, particularly when these are significant, environmental effects. Hence, both appraisal periods were used. The calculation of benefits as a present value is also particularly important for ecosystem service benefits given the prevalence of non-linear effects over time. These were accounted for within the calculations where possible and are discussed further below, e.g. Time to Reach Target Condition (TTRTC).
Note that standard HM Treasury Green Book principles for valuation were followed throughout the assessment process. This includes the discounting of benefits using the social (3.5% starting) discount rate and ensuring that all values were uplifted to and presented in 2025 prices using the latest Government GDP deflator (HM Treasury, 2025). It should be noted, however, that air pollutant removal values were discounted using the lower (1.5% starting) discount rate for health and life values, as recommended by the ENCA guidance and the HM Treasury Green Book. This is because the benefits associated with these values are directly derived from improvements to public health. The HM Treasury Green Book states the following: “The recommended discount rate for risk to health and life values is 1.5%. This is because the ‘wealth effect’, is excluded. The diminishing marginal utility associated with higher incomes does not apply as the welfare or utility associated with additional years of life will not decline as real incomes rise”.
In addition to the presentation of values as a 100-year present value, benefits are also presented as a series of ‘snapshot’ values at different points over the proposed scheme lifespan. These are the benefits (in present value terms) obtained at 10, 15, 25, 50, and 100 years from the beginning of the appraisal period, which is the start of construction, assumed as 2029. The snapshot values presented supplement the 100-year present value benefits presented by providing further detail and helping to identify ‘tipping points’ within the profile of benefits over time e.g., when benefits turn to disbenefits, or vice versa. Note that, as the snapshot values are also in present value terms, they are also subject to discounting. Hence, it is often the case that snapshot values later in the appraisal period are smaller.
Sensitivity analysis has been undertaken for the quantification and/or valuation of each ecosystem service, presenting calculations using lower-bound (conservative), central and upper-bound (more optimistic) data on the ecosystem service benefits provided by the natural environment to present outcomes for three, corresponding scenarios (where the availability of data/evidence permits). Further detail is provided in the individual methodologies below on the specifics of the sensitivity analysis undertaken, which is based on ranges in either the biophysical or monetary data employed, depending on where the most significant level of uncertainty is perceived to have resulted from.
Consideration was also given to how new habitats would change over the lifetime of the proposed scheme as part of the calculation of ecosystem service benefits. To attempt to account for the inherent uncertainty and risk of failure of habitat creation or enhancement, the difficulty multipliers set out in the SBMT were applied to both ‘created’ and ‘enhanced’ habitat parcels. These pre-defined multipliers reflect the difficulty of habitat creation or enhancement and, within the SBMT, reduce biodiversity scores accordingly. The risk multipliers associated with individual habitat parcels (either created or enhanced under the post-development scenario) have been applied to the ecosystem service benefits associated with these parcels to reflect the likelihood of newly created or enhanced habitats failing. For example, the creation of lowland mixed deciduous woodland is of ‘high’ technical difficulty within the SBMT, which relates to a 0.33 penalty multiplier i.e. an assumed failure of 67%, with benefits reduced accordingly. This is in line with the precautionary principle and what is assumed to be a proportionately conservative approach to the estimation of benefits. Note that of the various habitat types represented in the habitats ‘created’, only two are subject to a reduction factor: Lowland mixed deciduous woodland (as aforementioned) and other inland rock and scree, subject to a 0.67 risk multiplier. This is because all other habitats created are of ‘Low’ difficulty to create and thus subject to a risk multiplier of 1 (i.e. no reduction).
In addition to delivery risks, efforts were made to account for how the ability of natural capital assets to provide ecosystem services changes over time. For example, when first planted, newly created woodland habitat will have a lower carbon sequestration rate which quickly increases as the habitat matures. To factor this in, the assessment considered the TTRTC of newly created habitats. This refers to the time for new habitats to mature and thus to reach their full potential to deliver ecosystem services. As per the risk multiplier, for all created and enhanced habitat parcels, the SBMT provides a standard TTRTC. Starting from zero at the year of creation, a linear increase in the ecosystem service benefits delivered from the relevant habitat parcels to the TTRTC was assumed. This is a notable simplification as the relationship is often non-linear, however, in most instances this was deemed a proportionate approach to account for such effects. Where additional analysis was undertaken to account for non-linearity, this is detailed within the individual ecosystem service methodologies.
As well the staggering of benefits to account for TTRTC, it should be noted that zero benefits from enhanced/created habitats were assumed until the end of the construction. The construction phase for individual habitat parcels was aligned with those in the SBMT calculation, supplementary to the biodiversity assessment in the DMRB Stage 3 EIAR Chapter 12 (Biodiversity): it is assumed that there will be a five-year delay in creation for woodland and a four-year delay in creation of other habitats. Benefits from proposed scheme enhancements such as access improvements and corresponding recreation benefits (see Section 6.9 for further details) were also not assumed until the operational phase (starting 2033).
The sections below detail the methods used to assess the individual ecosystem services assessed in quantitative and/or monetary terms, followed by the results.
Food production
The proposed scheme will result in a loss of approximately 4.7 hectares of agricultural land. Since this provisioning ecosystem service provides significant benefits to society through food production, it is important to capture the impacts of the proposed scheme on this service in the assessment.
Following Scottish Government and the Enabling a Natural Capital Approach (ENCA) guidance (Defra, 2023), the impacts to food production were assessed using the average annual farm rent values. These values represent the average rent values tenant farmers pay for different farm types, and are taken from the Agricultural Survey Results: December 2019 (Scottish Government, 2020). These values are typically used as they are representative of the natural asset’s (i.e. the farmland) contribution to the ecosystem service, with other forms of capital input deducted. The results are based on data from larger agricultural holdings together with estimates for smaller farms and indicate the contribution of the land to agricultural output.
The assessment utilizes average annual farmland rents for the 2019/20 period, measured per unit area across various farm types, regions, and classifications such as Less Favoured Areas (LFA) and Non-LFA. The data is presented in terms of median, quartile, and decile rents per hectare, categorized accordingly. Of the habitats present across the study area, cereal cropping, general cropping, and LFA grazing livestock land (cattle and sheep) (note that data from the Scottish Government confirmed that the habitats across the study area are classified as a Less Favored Area) are applicable to the assessment. The central value (£/ha) for each type of agricultural use relevant to the assessment was as follows (presented in 2025 prices):
- Cereal cropping: £159.64/ha
- General cropping: £176.85/ha
- Cattle and Sheep (LFA): £60.66/ha
These values were then mapped to relevant habitat types either retained or created as part of the proposed scheme and multiplied by the respective areas of habitat, also taking into account any losses from the baseline. Cereal cropping values were applied to cereal crop habitat, general cropping to temporary grass and clover leys and non-cereal crops, and cattle and sheep (LFA) to modified grassland.
Sensitivity analysis was applied to the results by using the range of average farm rent values available. Upper and lower bound rent estimates are presented within the agricultural survey for each farm type. This enabled a low, central and high estimate of farm rent to be applied, with the Central estimate calculated using an average of the upper and lower bound rents.
The present value over different appraisal periods (60yr and 100yr) for the low, central, and high estimates are presented in Table 6‑1 below. Table 6‑2 shows that losses are expected to decrease (become less negative) over the appraisal period. This is likely due to a combination of successfully created habitat reaching target conditions and the effect of discounting.
| Estimate | 60yr | 100yr |
|---|---|---|
| Central | - 29,354 | - 34,276 |
| Lower | - 20,817 | - 24,497 |
| Upper | - 35,777 | - 41,485 |
| Estimate | 10 | 15 | 25 | 50 | 100 |
|---|---|---|---|---|---|
| Central | - 716 | - 603 | - 428 | - 230 | - 86 |
| Lower | - 536 | - 451 | - 320 | - 172 | - 64 |
| Upper | - 831 | - 700 | - 496 | - 267 | - 99 |
Timber production
To calculate the value of timber production, it was first necessary to explore the Scottish Forestry Felling Permissions and Licences (Scottish Forestry, 2025) to identify any areas with active licences within the DMRB Stage 3 Design Fix boundary. Two areas were identified within the boundary. Two areas were identified as having active felling licences. These areas provide an ecosystem service value which the proposed scheme will potentially have an impact on, if timber production were to be stopped.
The first area within the DMRB Stage 3 Design Fix boundary is the Dalpowie plantation, located between chainages 400 and 1200. It is understood that in this area, the estate managing the timber plantation will have felled all relevant areas prior to the proposed scheme being constructed, and any future restocking will not be used for timber production. It is therefore assumed that this area would have been taken out for forestry production prior to the proposed scheme and therefore any impacts on this area have not been take into consideration in the assessment.
A second area with an active felling licence is located to the south of the proposed scheme (Muir of Thorn and Gelly Wood) and is currently identified as an area for mitigation planting as part of the proposed scheme. Given this area would be planted as mitigation, an assumption has been made that this would no longer be felled for timber, therefore the benefits would be reduced/lost. Due to current uncertainties around how much of this area will be require for mitigation, a low, central, and high estimate has been calculated, to account for the fact some felling may still occur once the proposed scheme is completed. The low estimate assumes 50% of the current volume felled would be lost, the central estimate assumes 75% of the current volume felled would be lost, and the high estimate assumes all woodland in this area would be required for mitigation and the total area will no longer be felled. It should be noted that the licence in this area is currently in place from 2023-2025, and there are also uncertainties around whether felling would continue at this site. The results presented below should therefore be used with caution, noting the various uncertainties.
Using the Scottish Forestry Felling Permissions and Licences data, it was possible to obtain the felling volume (m3) for the active licences in the area to the south of the scheme. One of the licence areas included an area of woodland that does not sit within the DMRB Stage 3 Design Fix boundary, and it was therefore necessary to calculate a revised felling volume estimate. Based on the areas of woodland, 25% of the volume listed was included in the calculation. Additionally, it was assumed that the volumes presented in the felling permissions and licences are for the duration of the licence. Given the licence for this area is listed as being active from 2023-25 (2 years), the volume was halved, to represent a yearly volume.
To calculate the value of timber production, the Coniferous Standing Sales Price (Scottish Forestry, 2025) was used. A 5-year average (2020-2024) was taken to allow for fluctuations over each year (£37.83/m3 when adjusted to 2025 prices). Using the volume of timber as taken from the active licences, and the standing sales price, the present value for timber production has been estimated. It was assumed that the timber production service is not lost until the end of the construction period, so for the first five years, the volume of timber production is recorded as zero. This is because the value of any timber production is not as a result of the proposed scheme, therefore the benefit of this cannot be claimed.
The values presented in Table 6‑3 below show there is likely to be a significant loss in the value of timber production as a result of the proposed scheme. This is due to areas currently with active felling licences expected to be taken out of production to enable mitigation planting for the scheme to take place. The losses decrease over time; however, this is likely a result of the discounting applied, as it not assumed any new woodland created would have any timber production benefits.
| Estimate | 60yr | 100yr |
|---|---|---|
| Central | - 1,418,387 | - 1,733,871 |
| Lower | - 945,591 | - 1,155,914 |
| Upper | - 1,891,182 | - 2,311,828 |
| Estimate | 10 | 15 | 25 | 50 | 100 |
|---|---|---|---|---|---|
| Central | - 45,922 | - 38,665 | - 27,410 | - 14,776 | - 5,483 |
| Lower | - 30,615 | - 25,777 | - 18,274 | - 9,851 | - 3,655 |
| Upper | - 61,229 | - 51,553 | - 36,547 | - 19,702 | - 7,311 |
Air pollutant removal
Various habitats provide air quality regulation benefits by removing air pollutants. To quantify the change in air pollutant removal, the method set out in ENCA’s Services Databook has been followed. The change in the stocks of natural capital providing air quality regulation benefits within the proposed scheme has been quantified. Additionally, the amounts of air pollutants removed by different types of vegetation were calculated as average physical flows (tonnes) of ammonia, nitrogen dioxide, ozone, sulphur dioxide and inhalable particulate matter (PM10) over a 10-year period (2013-2023).
When valuing air pollutant removal, it is important to consider the wider context and demand for the ecosystem service, such as baseline air quality. It can generally be considered that baseline air quality is likely to be poorer in urban areas than rural areas. The entire proposed scheme is located within a rural area as classified by the Scottish Government Urban Rural Classification 2022 (Scottish Government , 2024a).
To monetise impacts associated with this service, the Office for National Statistics (ONS) UK Natural Capital Accounts: 2024(Office for National Statistics, 2024) annual values for air pollution removal per unit area for different habitat types in Scotland were applied to relevant habitats within the proposed scheme. Values were mapped to the habitats present on a best-fit basis. Supplementary data to inform the valuation of benefits provided by coniferous and broadleaf woodland was sourced from Scotland’s Environment (Scotland's Environment, 2014).
Values not defined by the ONS for “mixed woodland” habitats were calculated by taking an average of broadleaf and coniferous woodland values and for “scrub” habitats an average value was generated using broadleaf woodland, coniferous woodland and semi-natural grassland was used. Other limitations include the use of broad habitat values to define distinct habitats which could both over and underestimate the capacity of the habitat to remove air pollutants. The values used for the assessment are presented in Table 6‑5 below (all in 2025 prices).
| Habitat | Low (£/ha) | Central (£/ha) | High (£/ha) |
|---|---|---|---|
| Broadleaf woodland | £13.23 | £14.04 | £14.84 |
| Coniferous woodland | £46.72 | £49.57 | £52.41 |
| Mixed woodland | £29.98 | £31.80 | £33.63 |
| Enclosed farmland | £7.25 | £7.69 | £8.13 |
| Freshwater, wetlands, and floodplains | £1.73 | £1.84 | £1.94 |
| Mountains, moorland, and heath | £2.21 | £2.35 | £2.48 |
| Semi-natural grassland | £2.80 | £2.97 | £3.14 |
| Scrub | £20.92 | £22.19 | £23.46 |
| Urban grassland | £26.91 | £28.55 | £30.19 |
| Urban trees | £1,164.61 | £1,235.52 | £1,306.43 |
| Coastal margins | £0.53 | £0.57 | £0.60 |
The ability for vegetation to reduce pollutants is expected to decline over time due to long-term trends in background pollution. The ONS previously stated that the value of air pollution removal over time is projected to fall by 2030, reflecting baseline declines in background pollution. In the original Jones et al (2017) study (Jones, et al., 2017), values for 2030 were around 50% lower than 2015 estimates. However, upon review by the ONS of the ratio of asset value to 2020 values, the decline in unit values over time is much more muted than anticipated.
Accordingly, sensitivity analysis was undertaken by comparing the ONS 2013 to 2023 10-year average of all air pollutant removal flows in tonnes per hectare for Perth and Kinross Council (where the proposed scheme is located) against values for the rest of Scotland. The results showed that per hectare, habitats within Perth and Kinross Council removed 6% less air pollutants when compared with the rest of Scotland. This is likely due to the council area covering a primarily rural setting, thus providing less of an air pollutant removal benefit due to low existing background air pollution levels. The sensitivity analysis was derived as follows:
- Lower: 6% reduction in benefit over the appraisal periods.
- Central: No reduction in benefit over the appraisal periods.
- Upper: 6% gain in benefit over the appraisal periods.
Table 6‑6 shows that the air pollutant removal ecosystem service is expected to decrease as a result of the proposed scheme, representing a disbenefit. This conclusion is consistent across the Central, Low and High sensitivity analysis estimates. Sensitivity estimates are based on different benefit reduction factors employed reflecting different scenarios of background pollution levels.
| Estimate | 60yr | 100yr |
|---|---|---|
| Central | - 68,654 | - 93,003 |
| Lower | - 64,714 | - 87,665 |
| Upper | - 72,594 | - 98,341 |
The disbenefit observed is mostly due to the loss of baseline woodland habitat anticipated with the construction of the proposed scheme. The rural location of the scheme has lessened the impact of the loss as the levels of background air pollution are lower than more urban areas.
The change in air pollutant removal values over time across Central, Low and High sensitivity analysis estimates are presented in Table 6‑7, showing that disbenefits are expected to decrease (become less negative) over the appraisal period. This decrease over time is likely due to successfully created habitat reaching target conditions, especially the created woodland and grassland habitats. However, though the value of air pollutant removal services improves over time with the maturation of newly planted woodland and grassland habitat, it is not enough to offset the expected losses in baseline woodland habitat, thus the values remain negative. The decrease in disbenefits over time is also partly attributable to the air pollution reduction effect declining due to long term trends in background pollution, coupled with the effect of applying an economic discount rate.
| Estimate | 10 | 15 | 25 | 50 | 100 |
|---|---|---|---|---|---|
| Central | - 1,419 | - 1,219 | - 1,048 | - 801 | - 522 |
| Lower | - 1,337 | - 1,149 | - 988 | - 755 | - 492 |
| Upper | - 1,500 | - 1,289 | - 1,108 | - 847 | - 552 |
Biophysical values have been calculated for this ecosystem service as discussed. It was deemed not proportionate to break down the air pollutant removal flows for each pollutant due to the rural setting of the proposed scheme, hence the flows are presented for all pollutants combined. The values highlight that the proposed scheme will have a long-term negative impact on air pollutant removal in the area due to habitat changes.
| Estimate | 60yr | 100yr |
|---|---|---|
| Central | -158 | -250 |
| Lower | -149 | -235 |
| Upper | -168 | -265 |
| Estimate | 10 | 15 | 25 | 50 | 100 |
|---|---|---|---|---|---|
| Central | -3 | -2 | -2 | -2 | -2 |
| Lower | -3 | -2 | -2 | -2 | -2 |
| Upper | -3 | -2 | -2 | -2 | -2 |
Carbon reduction
The quantitative and valuation approaches for carbon storage have been based on the land use changes associated with the proposed scheme. This approach aligns with the approach taken to calculate the change in carbon stocks within Chapter 20 (Climate) of the DMRB Stage 3 EIAR. However, as the assessment also includes the impacts on carbon stocks, the assessment within the NCA should not be considered additional to that within the Climate chapter, i.e., carbon stocks are double-counted between the two assessments. As such, when considering the Whole Life Carbon (WLC) impacts of the scheme, figures from both assessments should not be included.
Carbon storage factors (tC/ha) have been identified for habitat types based on the habitats relevant to land use changes associated with the proposed scheme as detailed in Chapter 10 (Landscape) of the DMRB Stage 3 EIAR. The carbon storage factors used were based on the database compiled by Natural England (Gregg, et al., 2021) as this is the most recent database of carbon storage factors and is recommended by ENCA guidance (Defra, 2023). Each land use type was assigned a vegetation and soil carbon density value. Proposed seeding areas were assigned carbon stocks values for neutral grassland for proposed areas of grassland and carbon stocks values for arable/cultivated land were used for proposed areas agricultural land. Proposed planting and woodland areas used the woodland stocks carbon value, specifically 100-year mixed native broadleaved woodland on mineral soil (to 1m).
Risk multipliers derived from the Statutory Biodiversity Metric (Defra, 2023) were assigned to the proposed seeding areas, planting areas and woodland areas to reflect the likelihood of newly created or enhanced habitats failing.
Land use change calculations took into consideration the greenhouse gas emissions produced from vegetation loss and soil disturbance during the construction phase and potential changes in soil carbon during the operational phase. Carbon stored in tonnes was converted to tonnes of CO2e using a greenhouse gas equivalencies calculator. This was to align with Central Government carbon values (see below), which are provided on a £ per tCO2e basis.
Within the construction area, it was assumed that 100% of vegetation carbon would be lost due to clearance and 25% of the soil carbon would be lost due to disturbance. For the operational phase emissions, the remaining soil carbon for each land use type was calculated as 75% remaining after construction.
The difference was calculated between the baseline land use soil carbon remaining after construction and the soil carbon of the proposed (post-development) land use for each parcel. If the proposed land use had a lower soil carbon density than the baseline land use after accounting for construction effects, it was assumed that this change in soil carbon would be lost. This process occurs quickly so it was assumed 100% of the change in soil carbon was lost during the first year of the operational phase across both appraisal periods.
If the proposed land use had a greater soil carbon density than the baseline land use after accounting for construction effects, the change in soil carbon between the land uses would gradually be replenished during the operational phase. As per the methodology in Chapter 20 (Climate) of the DMRB Stage 3 EIAR, 50% of this change in soil carbon was allowed for during the operational phase over the 60-year appraisal period. For the 100-year appraisal period, which also assessed as part of this NCA, an 83% replenishment of soil carbon was allowed for during the operational phase to align with the assumptions made in Chapter 20 (Climate) of the DMRB Stage 3 EIAR. This assumes this process is time-intensive and thus the potential benefits are scaled to account for this.
Monetary values for application to the tonnes of carbon (CO2e) emitted and/or sequestered across the appraisal period were drawn from the Government’s most recent carbon values for use in policy appraisal and evaluation (Department for Energy Security and Net Zero (DESNZ) and Department for Business Energy & Industrial Strategy (BEIS), 2021). This approach aligns with the methods set out in the Green Book and supplementary guidance (HM Treasury, 2024). The lower and upper carbon values were considered alongside central values for the purpose of sensitivity analysis.
As discussed, the above methodology aligns with the approach taken to the calculation of carbon stocks within Chapter 20 (Climate) of the DMRB Stage 3 EIAR. A limitation of this approach is recognised in that there is likely a minor inflation of the carbon losses. This is because soil carbon losses during construction (25% due to disturbance) are assumed also to apply to parcels of woodland which are being retained, within the model. Whilst a fraction of this carbon is restored during the operational phase (50% or 83%, as above, depending on the length of the appraisal period), there is some loss associated with these parcels, which are potentially undisturbed in reality.
The approach to the calculation of carbon reduction benefits across the operational phase associated with parcels moving from a land use with a lower soil carbon density to a higher soil carbon density under the post-development scenario is relatively simplistic. To account for the fact that this flux (draw down) of carbon occurs over time when a land use change results in a habitat change, a reduction factor is applied (50% or 83%, as above). The limitations of this approach are explained further below:
- Firstly, this represents a simplification of the temporal changes in the carbon sequestration potential of newly created habitats. Further work is required to understand how well this would represent the cumulative volume of carbon sequestered by a given habitat over time. There is a possibility that this approach could underestimate the carbon benefits of these parcels. For example, the Woodland Carbon Code (WCC) (Woodland Carbon Code, 2025) states that carbon sequestration in trees typically peaks between years 16 and 25 of a tree's life. Thus, to only claim 50% of the difference in carbon stocks over a 60 year period could represent a significant underestimate.
- Secondly, sequestration (as opposed to emission) fluxes are only accounted for via the difference in the soil carbon stocks from baseline to the post-development (proposed land use) scenario, excluding vegetation. This again could represent a significant underestimate of the sequestration potential of any proposed land use, particularly for parcels moving to a land use with considerable biomass, such as woodland. However, further work would be required to confirm this.
- Finally, to monetise the carbon benefits, it was necessary to map this over time. The 50% and 83% reduction factors for gains in carbon stocks, however, were applied to align with the DMRB Stage 3 EIAR assessment of carbon stocks, to account for the fact that these gains are accrued over time. As a result of the application of economic discounting during the monetisation of benefits, it is possible that the monetary benefits are underestimated due to the potential, conceptual overlap between these negative multipliers (the reduction factors and discounting) and thus the potential ‘doubling up’ of temporal penalties.
Whilst the further work would be required to understand exactly how the above limitations have affected the total carbon reduction benefits, it is assumed that the results of this method may overestimate the potential adverse effect and underestimate the potential beneficial effect, providing a conservative outcome. This, however, is in line with a precautionary approach.
As shown in Table 6‑10, an overall loss is anticipated for carbon stocks due to the assumed total vegetation clearance at the construction phase, the initial decrease in woodland habitat and the time taken for replacement habitat to recover carbon stocks losses. Initial clearance of vegetation carbon and soil carbon disturbance during the construction phase accounts for the greatest loss.
| Estimate | 60yr | 100yr |
|---|---|---|
| Central | - 10,593,603 | - 10,404,425 |
| Lower | - 5,296,802 | - 5,202,212 |
| Upper | - 15,890,405 | - 15,606,637 |
As shown in Table 6‑11, after the initial losses of carbon stocks during the construction and operational phases, the carbon stocks show a benefit and a year-on-year increase as snapshot monetary values. This is because the losses of carbon stocks are accounted for as initial, blanket losses during construction year one (2029) as a result of vegetation clearance and soil carbon disturbance, and in operational year one (2033) when the soil carbon changes associated with land use changes are considered. As discussed above, carbon stocks are not assumed to remain static over time as carbon sequestration rates vary over a habitat’s lifecycle. These gains in carbon stocks throughout the remainder of the appraisal period are not great enough to recuperate the overall losses at the start of the construction and operational phases.
| Estimate | 10 | 15 | 25 | 50 | 100 |
|---|---|---|---|---|---|
| Central | 9,740 | 8,839 | 7,272 | 5,688 | 4,443 |
| Lower | 4,870 | 4,419 | 3,636 | 2,844 | 2,222 |
| Upper | 14,610 | 13,258 | 10,908 | 8,532 | 6,665 |
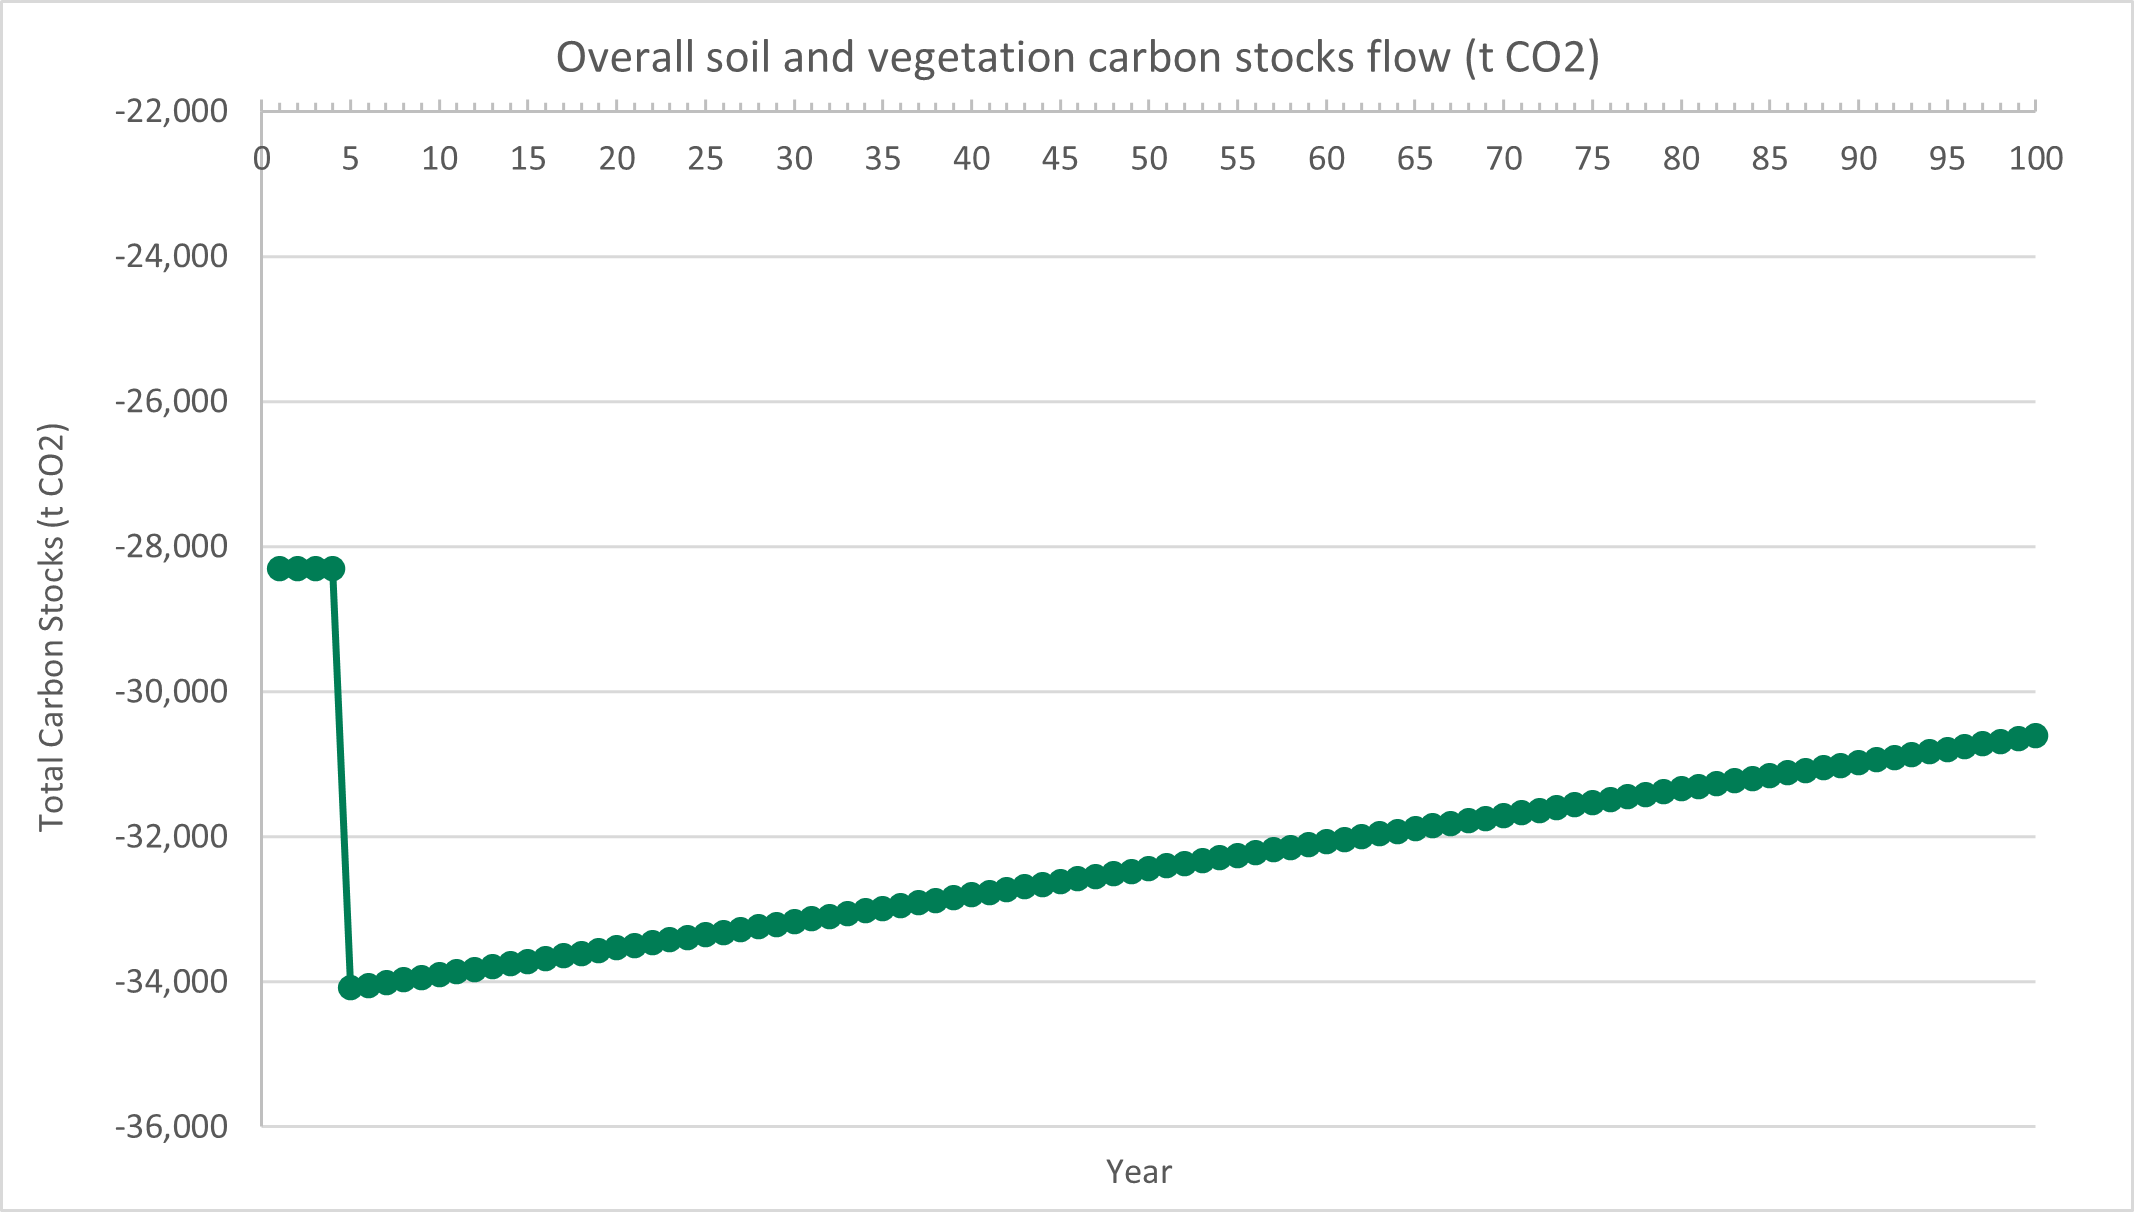
The biophysical flows for carbon stocks are presented in tCO2e and show an overall loss of carbon stocks over the appraisal period, illustrated in Table 6‑12, and Figure 6‑1. The initial construction phase loss in 2029 is assumed to be static until the initial operational phase loss in 2033 associated with land use changes. During the remainder of the appraisal period the soil carbon stocks gradually recover as habitats mature, as discussed, these gains are not great enough to account for the overall losses at the start of the construction and operational phases.
| Estimate | 60yr | 100yr |
|---|---|---|
| Central | -32,071 | -30,609 |
| Estimate | 10 | 15 | 25 | 50 | 100 |
|---|---|---|---|---|---|
| Central | -33,897 | -33,715 | -33,349 | -32,436 | -30,609 |
Flood regulation
Flood regulation refers to the capacity of habitats to store flood waters, thus providing a societal benefit in reducing flood risk. Given that the River Tay is within close proximity to the scheme, local habitats may have a role in regulating flow pathways and flood risk.
Flood regulation has been quantified based on a value transfer approach for the change of stocks which support the storage of flood waters within the boundary of the proposed scheme. This method is based on the Joint UK Land Environmental Simulator (JULES) model approach developed by Forest Research in 2018 (Broadmeadow, S., Thomas, H., Nisbet, T.,Valatin, G., 2018) and built upon by further work, carried out by Broadmeadow (Broadmeadow, et al., 2023) and Fitch et al. (Jones, Fletcher, Fitch, & Morton, 2022). This approach is not based on the Flood Hazard Research Centre’s Multi-coloured Manual and is an approximation based on habitat type only.
The hydraulic modelling carried out for infrastructure schemes is typically focused on the impacts of the engineered works and most often excludes the impacts on the flood water storage capacity of habitats, which are thus considered within this NCA. A higher-level approach has been taken in the assessment, estimating the flood regulation benefits based on average storage capacities per unit habitat area derived from national scale datasets. The equivalent monetary value is determined based on the replacement-cost approach, applying annualised average capital and operating costs of equivalent flood reservoir storage that would be required in the absence of the ecosystem service. It is recognised that a key limitation of this approach is that it does not account for the spatial aspect of flood risk i.e., whether any ‘at risk’ receptors do, in reality, benefit from this storage capacity via a reduced risk. However, the applied 'average' flood storage benefits are designed to account for this limitation and are therefore conservatively estimated.
The annual flood regulation values per unit area for different habitat types from the aforementioned references were assigned to relevant habitats within the NCA boundary. This was done on a best-fit basis. These values were multiplied by the area of the relevant habitats to calculate the annual benefit. Upper and lower replacement costs were considered alongside central values for sensitivity analysis.
Values for grass, shrubland and other woodland habitats (broadleaf and conifer) were taken from Fitch et al. (2022), however the value for trees outside woodland was taken from Broadmeadow et al. (2023). This research presents low, central and upper replacement cost values for the habitat. The differences between these values were converted to multipliers and used to extrapolate lower and upper-bound replacement cost estimates for the other habitats that contribute to flood regulation. Replacement costs in this case represent the average capital and operation costs of flood storage that would be required in the absence of the ecosystem service. The unit values used for each habitat type are as follows (all in 2025 prices):
- Inland wetland: £888.44/ha/yr
- Broadleaved woodland: £312.64/ha/yr
- Coniferous woodland: £382.68/ha/yr
- Mixed woodland: £347.66/ha/yr
- Grass: £149.59/ha/yr
- Shrubland (heather): £149.25/ha/yr
This approach was necessary due to the absence of Central, Low, or High estimates for sensitivity analysis in the studies; Economic Assessment of Freshwater, Wetland and Floodplain Ecosystem Service (Morris, J. and Camino, M, 2011) and Fitch et al. (Jones, Fletcher, Fitch, & Morton, 2022)
The discussed method uses the latest estimates of flood storage volumes by habitat to evaluate the value of this service. The sources of these values are indicated within the ENCA guidance (Defra, 2023).
Table 6‑14 presents the present values over different appraisal periods and shows that flood regulation services provided by habitats are expected decrease as a result of the proposed scheme, representing a disbenefit. The loss in coniferous woodland habitats is a key factor in the results, as these habitats generate an annual flood regulation benefit per unit area over double that of grasslands (£382.68/ha/yr compared to £149.59/ha/yr, 2025 prices). This conclusion is consistent across the low, central and high sensitivity analysis estimates over 60yr and 100yr appraisal periods.
The change in flood regulation values over time for all three scenarios (low, central, and high) are presented in Table 6‑15 showing that disbenefits are expected to decrease (become less negative) over the appraisal period. This is likely due to a combination of successfully created habitat reaching target conditions and the effect of discounting.
| Estimate | 60yr | 100yr |
|---|---|---|
| Central | - 394,120 | - 449,862 |
| Lower | - 78,284 | - 88,880 |
| Upper | - 934,300 | - 1,058,044 |
| Estimate | 10 | 15 | 25 | 50 | 100 |
|---|---|---|---|---|---|
| Central | - 10,159.96 | - 6,831.64 | - 4,843.08 | - 2,610.77 | - 968.82 |
| Lower | - 1,983.88 | - 1,268.39 | - 901.44 | - 489.51 | - 186.52 |
| Upper | - 23,721.33 | - 15,135.52 | - 10,732.11 | - 5,788.96 | - 2,153.07 |
Biophysical values have also been calculated for this ecosystem service, calculating the change in flood water storage capacity associated with habitats as a result of the proposed scheme. The majority of the values have been calculated by taking the 10-year average flood storage volume for various woodland types relative to bare soil. The habitat ‘mixed woodland’ was determined by averaging the values of broadleaf and coniferous woodland. The results, shown in Table 6‑16, highlight that the proposed scheme could adversely affect the capacity of the natural environment to support in flood water storage and the slowing of flows in the local area, due to losses in canopy interception and soil storage capacity. However, it is important to note that this assessment is based on average habitat values, and this has not taken into account the location of specific habitats.
| Estimate | 10 | 15 | 25 | 50 | 100 |
|---|---|---|---|---|---|
| Biophysical Values (m3) | -25,609 | -20,452 | -20,452 | -20,452 | -20,452 |
Pollination
The habitats present around the road network can be of huge importance in supporting pollinator species, which play a vital role in supporting healthy ecosystems. Despite this importance, it is not possible to monetise pollination as an ecosystem service; instead, this has been quantified in the form of identifying the areas of different habitat which have the potential to support pollinators. A comparison has been made between the baseline and post-development scenarios for the proposed scheme.
The approach to assessing pollination utilises both an existing tool and is supplemented with citizen science data. To first understand broadly which habitat types are important to pollinators, the NATURE tool (v1.2) was used. This is a publicly available, excel spreadsheet-based tool that allows users to assess the impacts of land-use and management change on natural capital assets and ecosystem service provision. Built into this tool are a series of base scores that indicate which ecosystem services different habitat types typically provide, as well as an inbuilt metric defining relative provision of ecosystem services in comparison to other habitat types. Pollination is one of the ecosystem services considered in this tool and allows habitat types to be scored based on their potential to support pollinator species. The base scores from this tool were used as an indicator to demonstrate how well each habitat type provided this ecosystem service.
In addition to the NATURE tool scores and to further refine the assessment, data on pollinator host species and pollinating invertebrate species was obtained through the GBIF (Global Biodiversity Information Facility, 2025), which is a mixture of citizen science data uploaded by the public and specialists who have carried out detailed site surveys. The point data for each host species and pollinator species was filtered by only including records between 2013 and 2024. The host species and pollinator species used as indicators were informed by an ecology specialist. The selection of the host plant species was taken from the Centre of Ecology and Hydrology Flower Insect Time (FIT) count methodology, using 14 target flower species which are easily identifiable, and a standardised methodology for citizen science. The invertebrate pollinator species were selected following a literature review of the relative pollination services provided by different genus. The species are listed in Table 6‑18.
There are several limitations to using citizen science data, including the accuracy and availability of the data. In the case of the proposed scheme, there were very few records of host species or pollinator species found within the scheme boundary. This therefore means the assessment is primarily based on the scores from the NATURE tool.
To combine the NATURE tool scores and the citizen science data, a methodology has been developed to score the host species and pollinator species. To avoid artificially displaying any areas where there is no host species or pollinator species data as being of low value to pollinators, the base scores were first multiplied by 10, extending the range of the scores. Scores were then assigned to each of the host and pollinator species, based on their relative importance at demonstrating high value habitat for pollinators. These scores are listed in Table 6‑17 and Table 6‑18. Where host or pollinator species were preset, the score was then added to the base score. A diagram of the methodology is also presented in Figure 6‑2. The final scores were assigned a category from very low to very high value for pollinators.
| Host species | Score |
|---|---|
| Rununculus | 5 |
| Lamium | 5 |
| Cratauegus | 5 |
| Rubus | 2 |
| Taraxacum | 2 |
| Lavandula angustifolia | 6 |
| Heacleum sphondylium | 5 |
| Centaurea | 5 |
| Trifolium | 4 |
| Senecio | 2 |
| Calluna | 6 |
| Cirisium carduus | 4 |
| Buddleja | 2 |
| Hedera | 2 |
| Pollinator species | Score |
|---|---|
| Apis mellifera (honey bee) | 10 |
| Bombus sp (bumblebee species) | 8 |
| Solitary sp (solitary bee species) | 7 |
| Diptera (fly species) | 6 |
| Lepidoptera (butterfly and moth species) | 5 |
| Pollen coleoptera (pollen beetle species) | 4 |
| Vespidae sp (wasp species) | 3 |

Table 6‑19 below presents a summary of the areas of habitat that score very low to very high across the NCA boundary for both the baseline and post-development scenarios. These results show a generally positive change as a result of the proposed scheme, with a decrease in areas seen as very low and low, whilst there is an increase in moderate areas. This suggests several areas of habitat are becoming a higher category for pollinators. This is likely due to the increase in higher value habitats, such as mixed deciduous woodland and grassland, whilst there is a loss of habitats such as coniferous woodland, which scores low for supporting pollinators. There is a very small loss of some high scoring habitat, all of which is made up of lowland and upland heathland. However the change is minimal, so there is likely to be limited impact to pollinators.
| Category (potential to support pollinators) | Baseline area (ha) | Post-development area (ha) | Change |
|---|---|---|---|
| Very low | 81.74 | 65.72 | -16.01 |
| Low | 5.34 | 4.51 | -0.84 |
| Moderate | 116.92 | 136.00 | 19.08 |
| High | 210.50 | 210.24 | -0.26 |
| Very high | 0.00 | 0.00 | 0.00 |
Education
As an ecosystem service, education refers to the capacity for the natural environment to support learning and development, either through presenting new learning opportunities or through facilitating learning via nature’s restorative effects.
Currently, the proposed scheme is not anticipated to have any tangible impact on education benefits provided by the natural environment. However, a specific opportunity has been identified, which if capitalised upon, the scheme may be able to claim some notable education benefit.
The area surrounding Dunkeld is currently frequently visited by geology enthusiasts, geology societies and universities in Scotland as a field trip destination to observe unique structural geology. There are dedicated excursions to Dunkeld and Little Glen Shee run by the Edinburgh Geological Society (Brown & Gillen, 2015), the British Geological Survey (British Geological Society, 2019) and the Geological Society of Glasgow (Geological Society of Glasgow, 2017). The area is visited for its various localities where bedrock is exposed, and geological structures and formations of note can be observed.
As a result of the necessary rock blasting for the construction of the proposed scheme, some of the new cuttings may expose bedrock and, in turn, create new geological features comparable to those visited in the excursions cited above. Three cutting sites have been identified with this potential and are described in Table 6‑20, which has been informed by Chapter 13 (Geology, Soils Groundwater and Land Contamination) of the DMRB Stage 3 EIAR.
| Cutting | Opportunity |
|---|---|
| C13 | The proposed cutting C13, located between chainages 6100 and 6500, is expected to intercept bedrock at a relatively shallow depth (0.3m) and has the potential to expose a similar significant geological feature to the one recognised at the Craig a' Barns Geological Conservation Review (GCR), exposing similar bedrock. The Craig a' Barns GCR is a significant geological feature as an exposed hinge zone of the Highland Border Downbend with associated deformation features (Brown & Gillen, 2015). Craig a' Barns is an outcrop at which important structural features are exposed. C13 lies on the same high of the Highland Border Downbend underlain by the same bedrock geology (Dunkeld Grits). C13 could thus become a comparable feature to that of Craig a' Barns GCR should comparable levels of accessibility be provided. This should be relatively achievable given that Path 45 (PKC Core Path DUNK/65), running from the Hermitage, passes directly behind the proposed cut face. |
| W13 | The proposed cutting W13, located between chainages 8000 and 8400, has the potential to expose a significant geological feature as the cutting is situated between two GCRs: Craig a' Barns and Rotmell Farm, which have been recognised for the significant structural features present in the bedrock. There is a possibility that further features of interest could be exposed as the cutting lies upon the same Dunkeld Grits formation. W13 hence could also become a comparable feature to those discussed should access be provided. Access should be relatively achievable to this roadside cutting by means of a layby or similar. |
| CS7B/CS8 | The proposed cutting CS7B/CS8, located between chainages 2000 and 2300, is expected to expose bedrock of The Birnam Slate and Grit Formation. The cutting is located next to the disused Birnam Quarry which is not a GCR site but is still a locality of interest for structural features related to the formation of the Tay Nappe (Brown & Gillen, 2015). The cutting could thus create a new site of geological interest, albeit a potentially smaller opportunity relative to the potential features which could be exposed at CS7B/CS8. Providing access could be challenging as the cutting is primarily an underpass so access may not be feasible on foot. However, there is a chance bedrock could be exposed at the surface. |
To secure an educational benefit from the proposed scheme, would require additional measures would be required to make sure the cutting sites are accessible. Furthermore, it is not guaranteed that the cuttings will expose comparable geological features to those already within the area. The potential educational benefit has been quantified below as a demonstrative exercise of the potential opportunity for the proposed scheme. However, the benefits calculated will not be included in the NCA summary tables (presented in Section 6.11) as the benefits will not be realised with the current proposed scheme design.
For the purpose of demonstrating the potential benefits, the Dunkeld and Little Glen Shee area is presumed to receive between 120 and 480 visits (central estimate of 300 visits) annually as part of geological excursions. This is a relatively conservative estimate assuming that given the relatively academic nature of the excursions identified, these would be limited to tertiary level education and above. The lower-bound estimate assumes one excursion of 20 members (the number of spaces available for the Geological Society of Glasgow excursion) every two months. The upper-estimateupper estimate assumes two trips per month. A value of £30.73 per visit (uplifted to 2025 prices) is applied to estimate the baseline education benefit. This is a value from the Economic Analysis of Cultural Services: UK NEA Economic Analysis Report (Mourato, et al., 2010) and represents the indicative average cost of nature-based educational trip as a proxy minimum value received by the individual in terms of an investment in their knowledge.
To estimate the net benefit from proposed scheme, uplifts to the baseline were assumed based on the potential value added by the new cuttings. The new cuttings could create three new localities within the Dunkeld and Little Glen Shee excursion area. Hence, the following uplifts were applied:
- Upper-bound: +60%, based on the fact there are currently five localities within the Dunkeld and Little Glen Shee excursion. A direct relationship between value and the number of localities would thus assume an uplift of +60% from three further localities.
- Central: +40%
- Lower-bound: +20%
Table 6‑21 shows that the potential education benefit over 100 years could range from £20k - £244k and from £17k - £201k over 60 years, assuming that new geological features are created from the cutting and that access to these is provided as part of the proposed scheme. With the exception of assuming no access until the operational period, the benefits are assumed to remain constant over time; hence, the changes in the snapshot monetary values shown in Table 6‑22 reflect the impact of discounting.
| Estimate | 60yr | 100yr |
|---|---|---|
| Central | 83,850 | 101,810 |
| Lower | 16,770 | 20,362 |
| Upper | 201,241 | 244,344 |
| Estimate | 10 | 15 | 25 | 50 | 100 |
|---|---|---|---|---|---|
| Central | 2,614 | 2,201 | 1,560 | 841 | 312 |
| Lower | 523 | 440 | 312 | 168 | 62 |
| Upper | 6,274 | 5,283 | 3,745 | 2,019 | 749 |
Recreation
Greenspaces can provide significant recreational value, which is reflected in the welfare benefits gained by individuals visiting such spaces. These benefits are proportional to the nature, accessibility, and quality of the space.
Changes in the benefits provided by local, recreational greenspaces has been assessed using data and insights from Chapter 17 (Population – Accessibility) of the DMRB Stage 3 EIAR. This bespoke approach was developed to best capture the impacts of the proposed scheme on recreational spaces, which are highly specific; for example, there are no substantial, direct land use impacts on such spaces. The Accessibility chapter provides a comprehensive assessment of the proposed scheme’s impacts on routes for WCH. This includes impacts on core paths, rights of way, National Cycle Routes, horse riding routes and local paths within 500m of the proposed scheme, with a total of 60 paths identified.
As part of the Accessibility assessment, the impacts upon OAAs are distinguished. OAAs are defined as, “local open space and green space that are used by the public for recreational purposes” (Ministry for Housing, 2014). Given their definition, it was deemed appropriate to focus the assessment of recreation benefits, as part of the NCA, on the impact on the identified OAAs.
The Accessibility chapter identified adverse impacts on OAAs as a function of the impacts to paths associated with these spaces. Impacts to paths were considered in two terms: the impacts to journey length as a result of severance and the impacts to amenity. The impacts to journey length were not considered as part of the assessment of recreation benefits in the NCA as changes to journey length could be seen as negative or positive from a recreation perspective. Adverse effects on the amenity of paths identified in the chapter were a summation of visual, air quality and noise impacts on the paths. The amenity impacts (including impacts with reference to the three, individual components) to all paths relevant to the proposed scheme are summarised in Appendix A17.1 (Impact Assessment for WCH Routes and Access to Outdoor Areas) of the DMRB Stage 3 EIAR in Table A17.1-2. Table A17.1-2 was reviewed to identify any effects to paths associated with OAAs identified as 'Moderate' or above. Note, that only residual effects (with mitigation) were considered, i.e. lasting impacts to OAAs, in keeping with a proportionate approach. Moderate impacts (or above) were assumed to represent an appropriate threshold for effects of significance, which could have a tangible impact on the recreational experience offered by OAAs.
Whilst the Accessibility chapter focused on the potential, adverse effects on the OAAs and their associated paths (due to the mitigation lens of the EIAR), the NCA looks to capture both the proposed scheme’s adverse and positive impacts (enhancements) on recreation. A review was thus undertaken, with the support of the Accessibility and Design Teams, to identify all new path creation and enhancement measures currently planned as part of the DMRB Stage 3 proposed scheme alignment. These measures were then reviewed as to whether they could have a tangible impact on the recreational experience offered by the OAAs identified, in terms of significant improvements in accessibility.
For each of the OAAs identified in the Accessibility chapter, Table 6‑23 summarises the estimated baseline visitor numbers. The adverse and positive impacts to amenity of associated paths are also identified. Note that paths are referred to using the numbering system from Chapter 17 (Population – Accessibility) of the DMRB Stage 3 EIAR; Figure 17.1 of the DRMB Stage 3 EIAR provides a map of all paths relevant to the proposed scheme and their reference numbers. Several of the OAAs are scoped out of the assessment based on negligible visitor numbers (thus it was deemed they would not be proportionate for inclusion in the quantification of benefits) or overlap with other OAAs in terms of a shared path network, with the potential for double-counting of recreation benefits. Ultimately, based on the adverse and positive amenity impacts identified, conclusions were drawn as to how the baseline recreation benefits associated with each OAA could be scaled to reflect these impacts and calculate the net benefit associated with the proposed scheme. Note that in the case of positive impacts, reference is made to Appendix B, which contains schematics for the path creation and enhancement measures associated with the proposed scheme which were deemed to have the potential for a tangible impact on the recreational experience offered by the OAAs.
|
OAA |
Relevant paths |
Estimated annual visitor numbers |
Source of visitor data |
Adverse amenity impacts |
Positive amenity impacts |
Conclusions for scaling of benefits |
|
The Hermitage and River Braan |
35, 36, 39, 41, 42, 44 |
359,937 |
Annual visitor numbers sourced from Association of Leading Visitor Attractions (ALVA, 2025). Note that in the Accessibility chapter The River Braan is identified as a separate OAA. However, sources (Walkhighlands, 2025) indicate that there is a significant overlap in the path network between these OAAs. Hence, in the NCA, these areas are treated as a single OAA to avoid the potential double-counting of recreatioNot Applicablel visitors. |
Path 39: Due to the closer proximity of the path to the proposed route options and subsequent visual impact from earthworks, there is expected to be a decrease in the amenity value for WCH using this path. Moderate, visual impact anticipated and a Major impact in terms of noise. |
The path enhancements in APPENDIX B should collectively have a positive impact on access to the Hermitage from Dunkeld. This is particularly given that the main footbridge over the River Braan was washed away in a storm in recent years and there has since been a diversion in place using Paths 36 and 41, which is an elongated route (see the Population – Accessibility chapter for further details). The enhancements pictured would create a new crossing using the main A9 bridge across the River Braan to the Hermitage from Dunkeld. The enhancements in Appendix B2 represent a significant improvement to the path network around the popular River Braan area (the Strava Global Heatmap (Strava, n.d.) suggests footfall is almost as heavy as the main Hermitage site). A new path is being added to turn Path 35 into a circular route and Paths 35 and 39, which are currently unbound (dirt) tracks, are to be upgraded. |
The adverse impacts on Path 39 should have a relatively negligible impact on the recreatioNot Applicablel benefits associated with the wider Hermitage and River Braan OAAs, given that this is only a small section of path within the much wider, associated network. The overall improvements in accessibility and new circular route around the River Braan OAA could have a tangible impact on visitor numbers and the recreatioNot Applicablel experience. For the sake of a conservative estimate, an uplift of 5 - 10% of the recreatioNot Applicablel benefit from this OAA was assumed based reflecting the potential change in visitor numbers and/or improvement in recreatioNot Applicablel experience. |
|
Tay Forest Park – Craigvinean Plantation |
45, 46, 47, 52 |
NOT APPLICABLE |
Visitor numbers estimated for the Hermitage were assumed to account for visits to this OAA and hence it was scoped out of the assessment. According to the Land MaNot Applicablegement Plan for Craigvinean (Forestry and Land Scotland, 2020): "The forest receives high visitor numbers each year. Approximately 200,000 people visit the Not ApplicabletioNot Applicablel Trust (NTS) site at the Hermitage with a significant proportion of these visitors also taking in wider walks through the forest block". |
NOT APPLICABLE |
NOT APPLICABLE |
NOT APPLICABLE |
|
Inver Wood |
45, 46, 47 |
NOT APPLICABLE |
The Strava Global Heatmap suggests negligible user numbers compared to other visitor sites. There is also a large overlap in the path network between this OAA and the Craigvinean Plantation OAA and, by extension, with the Hermitage and River Braan OAA, with potential for double-counting of visitor numbers. This OAA was hence scoped out the assessment. |
NOT APPLICABLE |
NOT APPLICABLE |
NOT APPLICABLE |
|
River Tay |
35, 38 (NCR77), 48 (NCR77), 53 |
89,984 |
The path network comprising Paths 35, 38 and 48/NCR77 looks to receive approximately 25% of the footfall received by the Hermitage, according to the Strava Global Heatmap. Other paths within the area appear to receive relatively negligible footfall. |
Path 35: Due to the closer proximity of the path to the proposed route options and subsequent visual impact from earthworks, there is expected to be a decrease in the amenity value for WCH using this path. Moderate, visual impact anticipated and a Moderate impact in terms of noise. |
In its current state, there are concerns for the safety of WCH using the NCR77 when crossing the Jubilee Bridge, as the path is not clearly segregated from northbound carriageway. To address this, the path will be moved to the southbound carriageway-side on the Jubilee Bridge. To accommodate this and to continue to provide access from the east, when coming from the east the NCR has been diverted to the south, crossing under the A9 under the new Dalguise Junction to access the southbound-side, where the new path continues up to (utilising the Dalguise Access Track) and across the Jubilee Bridge. At the northern extent, a new path will be created, to again avoid crossing the A9, to connect to the existing NCR77 route on the eastern bank of the River Tay, heading back down to Dunkeld. The enhancements described should improve the safety of cycle users of NCR77, providing a truly segregated route across the Jubilee Bridge and crossing under the A9 to access the NCR77 route heading east (south of the Jubilee Bridge). |
As a result of the adverse impacts on the amenity associated with Path 35, there will be some adverse effects on the recreatioNot Applicablel experience of users of this path. On the other hand, users of NCR77/Path 48 should have an improved recreatioNot Applicablel experience from the new route which is segregated from the main A9 carriageway. It is likely that these improvements outweigh the adverse effects encountered by users of Path 35 but not to an extent where it would be appropriate to assume an overall benefit proportioNot Applicablete for quantification. Hence, no change to the recreatioNot Applicablel benefit associated with this OAA was assumed. |
|
BirNot Applicablem Hill |
18, 20, 23, 28/NCR77, 30 |
89,984 |
Based on the apparent footfall of the BirNot Applicablem Hill walking route (Walkhighlands, 2025) on the Strava Global Heatmap, compared to that received for the Hermitage, estimated to receive 25% of the visitor numbers to the Hermitage. |
None |
Path 23: Overall an increase in amenity value is expected for WCH using this path due to the improved safety of the grade separated crossing. |
Benefits for amenity (from improvements to Path 23) relate to safety and are not anticipated to have a tangible impact on the overall recreatioNot Applicablel experience offered by the BirNot Applicablem Hill OAA to extent where quantification would be proportioNot Applicablete. Hence, no change to the recreatioNot Applicablel benefit associated with this OAA was assumed. |
|
Ring Wood |
15, 19, 21, 22/NCR77, 24 |
118,779 |
Based on the apparent footfall compared to that received for the Hermitage on the Strava Global Heatmap, assumed to receive approximately 1/3 of the visitor numbers received by the Hermitage. |
None |
The path identified in APPENDIX BB represents a new path connecting the established route around Ring Wood (back to Dunkeld) to the Dalpowie plantation. Currently, there is no formal route connecting Ring Wood to Dalpowie, with the dramatic drop off in footfall between Ring Wood and the Dalpowie area on the Strava Global Heatmap reflecting this. The Dalpowie Plantation sits between Ring Wood and another high footfall walking route, the Murthly Riverside Path (Path 4, following the southern bank of the River Tay around the Murthly Castle grounds, down to the Roman Bridge feature). The new path should connect Ring Wood to the more established, local paths within the Dalpowie Plantation (Path 15), which link up with the Murthly Riverside Path via the Roman Bridge (via Paths 21a and 7). This should hence lead to a more cohesive, single riverside route between Ring Wood and the Murthly area. The Strava Global Heatmap data indicates demand for such a route, with some footfall evident between Ring Wood and the Dalpowie Plantation (across to Murthly Estate), despite there being no obvious footpath currently. AdditioNot Applicablelly, the Roman Bridge/Murthly Riverside Path Route comprises a section of the River Tay Way (Perth and Kinross Countryside Trust, n.d.), which does connect to Dunkeld but does so by diverting south of the A9, presumably due to an absence of formal path via the Dalpowie site. This should hence provide a more direct and scenic route for the River Tay Way (remaining on the banks of the Tay) to Dunkeld. |
The enhancements, by means of a connection between two existing and popular riverside walks, could create a new, extended route along the Tay as part of the River Tay Way, which could have benefits both in terms of new visitors and improved recreatioNot Applicablel experience. For the sake of a conservative estimate of the potential benefit, an uplift of 10 - 20% is applied to the baseline benefit obtained from Ring Wood, reflecting the potential change in visitor numbers and/or improvement in recreatioNot Applicablel experience. |
|
Rohallion Loch |
9 |
NOT APPLICABLE |
Strava Global Heatmap suggests negligible user numbers compared to other OAAs. This OAA was hence scoped out the assessment. |
NOT APPLICABLE |
NOT APPLICABLE |
NOT APPLICABLE |
For those OAAs where a scaling of the associated benefits was deemed appropriate to reflect tangible changes as a result of the proposed scheme, the baseline benefits were calculated by applying a value per visit of £4.11 (uplifted to 2025 prices) to estimated annual visits. This value is the average value per visit to woodland and farmland greenspace sites based on aggregate site selection of the relevant land covers in the Outdoor Recreation and Valuation tool (ORVal) (Day & Smith, 2018). Baseline benefits were then scaled according to the conclusions drawn in Table 6‑23 to estimate the net benefits associated with the proposed scheme.
| Estimate | 60yr | 100yr |
|---|---|---|
| Central | 4,189,059 | 5,086,308 |
| Lower | 2,792,706 | 3,390,872 |
| Upper | 5,585,412 | 6,781,744 |
| Estimate | 10 | 15 | 25 | 50 | 100 |
|---|---|---|---|---|---|
| Central | 130,603 | 109,965 | 77,956 | 42,024 | 15,594 |
| Lower | 87,069 | 73,310 | 51,971 | 28,016 | 10,396 |
| Upper | 174,138 | 146,619 | 103,941 | 56,032 | 20,793 |
Table 6‑24 shows a net benefit to recreation associated with the proposed scheme ranging from approximately £2.79m - £5.59m over a 60yr period to £3.39m - £6.78m over a 100yr period. These benefits are associated with the WCH path creation and improvement efforts which were considered to have a tangible impact on the recreational experience and/or access to two of the OAAs – the Hermitage and River Braan and Ring Wood. Whilst some adverse impacts to the amenity of paths associated with OAAs were identified, these were judged not to be of sufficient scale to have a tangible impact on recreational experience and/or access. The benefits calculated are not assumed to change across the appraisal period (bar the delay over the construction period) and hence the decrease in values over time presented in Table 6‑25 simply reflects the effect of discounting.
Volunteering
Engaging in environmental volunteering provides numerous personal and social advantages, such as promoting physical activity, fostering social connections, enhancing skills, and preparing individuals for future employment. Gathering data on volunteer participation and showcasing the positive outcomes of such opportunities can also play a crucial role in attracting financial support from donors.
The proposed scheme has the potential to support volunteering hours for local environmental groups to increase their outreach and positive impact. These groups carry out activities such as ecological surveys and tree planting around the Dunkeld and Birnam area. If these groups were to be supported further, a potential substantial positive ecosystem service impact is anticipated for the proposed scheme.
To quantify the potential value of volunteering benefits, the method set out in ENCA’s Services Databook has been followed. ENCA recommends applying a monetary value per volunteer hour based on the calculated replacement cost of an average formal volunteer hour (for frequent volunteers i.e. at least once a month).
The valuation is based on a methodology to value unpaid voluntary activity in the Household Satellite Accounts (Office for National Statistics, 2017) which is an estimate of what the same activity would cost if it was being provided by a paid person in the market and the value is then uprated by the Average Weekly (regular) Earnings Index. This approach effectively captures the benefit of volunteering to the organisation by quantifying the labour the organisation is receiving “for free” but doesn’t capture the benefit to the individual. This valuation does capture additional benefits associated with volunteering such as greater social connections and increased mental well-being which is a limitation of the methodology. Ideally, the replacement costs would also reflect the level of skill of the voluntary activity. The value used in this assessment is £16.70 (uplifted to 2025 prices) per volunteer hour.
For the purpose of sensitivity analysis, the number of volunteer hours per week was estimated to be eight per volunteer across two potential environmental volunteer organisations (one ecological surveying group and one tree planting group) providing an environmental benefit. Sensitivity analysis was carried out as follows:
- Lower estimate: Two volunteers sponsored for eight hours per week each across two volunteer organisations
- Central estimate: Four volunteers sponsored for eight hours per week each across two volunteer organisations
- Upper estimate: Six volunteers sponsored for eight hours per week each across multiple environmental groups
Even with the delay in access until 2033 to facilitate the proposed scheme construction, the overall volunteering benefit would likely be positive. This is the case for Central, Low and High sensitivity analysis scenarios and is presented in Table 6‑26. This assumes that the proposed scheme would support volunteering opportunities throughout the appraisal period.
| Estimate | 60yr | 100yr |
|---|---|---|
| Central | 631,978 | 767,341 |
| Lower | 315,989 | 383,670 |
| Upper | 947,967 | 1,151,011 |
Note that the decrease in values over time following the operational phase, shown in Table 6‑27, is due to the effect of discounting. Volunteer hours are assumed to remain constant throughout the appraisal period.
| Estimate | 10 | 15 | 25 | 50 | 100 |
|---|---|---|---|---|---|
| Central | 19,703 | 16,590 | 11,761 | 6,340 | 2,353 |
| Lower | 9,852 | 8,295 | 5,880 | 3,170 | 1,176 |
| Upper | 29,555 | 24,885 | 17,641 | 9,510 | 3,529 |
Summary results
Table 6‑28 presents the summary 100-year present value results for each ecosystem service and the sum, total Net Present Value (NPV), across each of the sensitivity scenarios (central, lower- and upper-bound). Note that, as discussed within the respective sub-sections in Section 6, the values associated with education and volunteering have not been included within the summary results. This is because the benefits associated with these services were calculated for demonstrative purposes of additional opportunities only and are not forecasted to be gained as part of the proposed scheme, currently.
The upper- and lower-bound scenarios represent a scenario where the baseline capacity for natural assets to provide ecosystem services is at its greatest. This means that for those services where there is a loss in the service due to the proposed scheme, the loss is actually greatest under the upper-bound scenario (and vice versa, losses are smallest under the lower-bound scenario). For this reason, Table 6‑29 presents the summary values translated into a new set of ‘optimism’ scenarios. Under the ‘least optimistic’ scenario, for each ecosystem service, the lowest benefit (or greatest loss) calculated from across the three sensitivity scenarios is assumed. Under the ‘most optimistic’ scenario, the highest benefit (or smallest loss) calculated from across the three sensitivity scenarios is assumed. Theoretically, this demonstrates the maximum range in the change in ecosystem service benefits which is forecast to occur as a result of the proposed scheme.
On the basis of the optimism scenarios presented in Table 6‑29, the 100-year NPV for the proposed scheme ranges from approximately -£15.73m to (+)£222.58k. The breakdown of the 100-year NPV is visualised in Figure 6‑3. The most significant losses are associated with carbon reduction, followed by timber production. Only under the most optimistic scenario, where the losses are the smallest (and gains greatest), do the benefits from recreation outweigh these losses. Carbon reduction and recreation clearly have the greatest influence on the total 100-year NPV across the optimism scenarios. It should be noted that, as discussed in Section 6.5, the values associated with carbon reduction are assumed to be conservative and the losses, in reality, could be less than those forecasted. This could have a notable impact on the overall profile of the impact of the proposed scheme on natural capital values.
| Ecosystem service | Central | Lower | Upper |
|---|---|---|---|
| Food production | - 34,276 | - 24,497 | - 41,485 |
| Timber production | - 1,733,871 | - 1,155,914 | - 2,311,828 |
| Air pollutant removal | - 93,003 | - 87,665 | - 98,341 |
| Carbon reduction | - 10,404,425 | - 5,202,212 | - 15,606,637 |
| Flood regulation | - 449,862 | - 88,880 | - 1,058,044 |
| Recreation | 5,086,308 | 3,390,872 | 6,781,744 |
| Total | - 7,629,129 | - 3,168,297 | - 12,334,592 |
| Ecosystem service | Central | Least optimistic | Most optimistic |
|---|---|---|---|
| Food production | - 34,276 | - 41,485 | - 24,497 |
| Timber production | - 1,733,871 | - 2,311,828 | - 1,155,914 |
| Air pollutant removal | - 93,003 | - 98,341 | - 87,665 |
| Carbon reduction | - 10,404,425 | - 15,606,637 | - 5,202,212 |
| Flood regulation | - 449,862 | - 1,058,044 | - 88,880 |
| Recreation | 5,086,308 | 3,390,872 | 6,781,744 |
| Total | - 7,629,129 | - 15,725,464 | 222,575 |
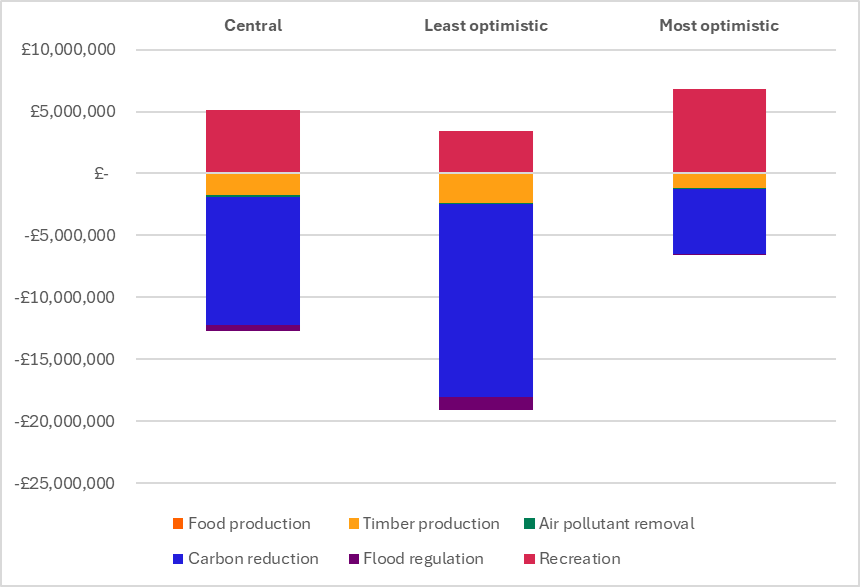
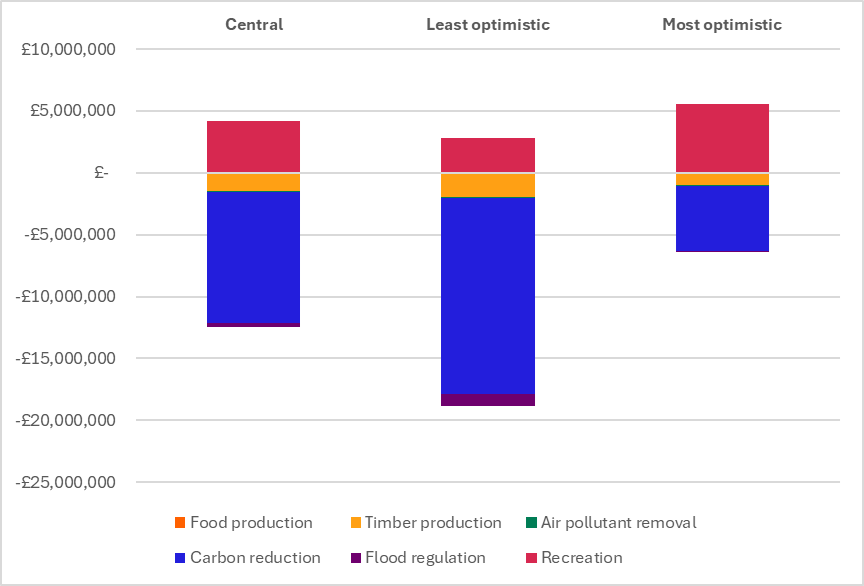
Table 6‑30, Table 6‑31 and Figure 6‑4 represent the equivalent summary tables/figures to Table 6‑28, Table 6‑29 and Figure 6‑3, respectively, over the 60 year appraisal period. On the basis of the optimism scenarios presented in Table 6‑31, the 60-year NPV for the proposed scheme ranges from approximately -£16.03m to -£820.8k. Similarly to the 100-year appraisal period, as depicted in Figure 6‑4, the losses associated with carbon reduction and the gains associated with recreation have the greatest influence on the total 60-year NPV. Over the 60-year appraisal period, the losses are greater under the least optimistic scenario due to the greater carbon losses, primarily. As is explained in Section 6.5, most the of the carbon reduction losses occur at the start of the appraisal period whilst the gains associated with habitat creation efforts are accrued more steadily over time. Consequently, across the 60-year appraisal period, the gains have had less opportunity to outweigh the early losses.
| Ecosystem service | Central | Lower | Upper |
|---|---|---|---|
| Food production | - 29,354 | - 20,817 | - 35,777 |
| Timber production | - 1,418,387 | - 945,591 | - 1,891,182 |
| Air pollutant removal | - 68,654 | - 64,714 | - 72,594 |
| Carbon reduction | - 10,593,603 | - 5,296,802 | - 15,890,405 |
| Flood regulation | - 394,120 | - 78,284 | - 934,300 |
| Recreation | 4,189,059 | 2,792,706 | 5,585,412 |
| Total | - 8,315,059 | - 3,613,502 | - 13,238,847 |
| Ecosystem service | Central | Least optimistic | Most optimistic |
|---|---|---|---|
| Food production | - 29,354 | - 35,777 | - 20,817 |
| Timber production | - 1,418,387 | - 1,891,182 | - 945,591 |
| Air pollutant removal | - 68,654 | - 72,594 | - 64,714 |
| Carbon reduction | - 10,593,603 | - 15,890,405 | - 5,296,802 |
| Flood regulation | - 394,120 | - 934,300 | - 78,284 |
| Recreation | 4,189,059 | 2,792,706 | 5,585,412 |
| Total | - 8,315,059 | - 16,031,553 | - 820,796 |
It should be noted that the education and volunteering opportunities, if realised, could have a notable effect on the overall natural capital value of the proposed scheme. Over 100 years, the NPV would range from -£15.32m to (+)£1.62m if the benefits forecasted are included. Over 60 years, the NPV would range from -£15.7m to (+)£328.41k.