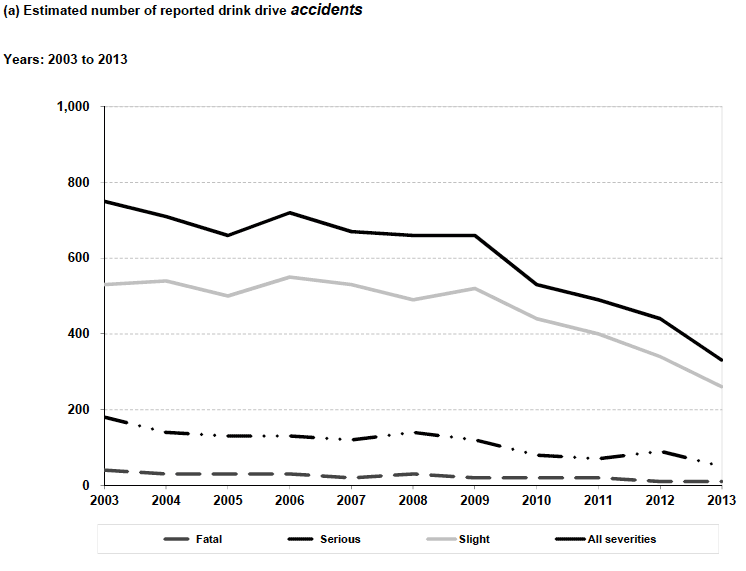
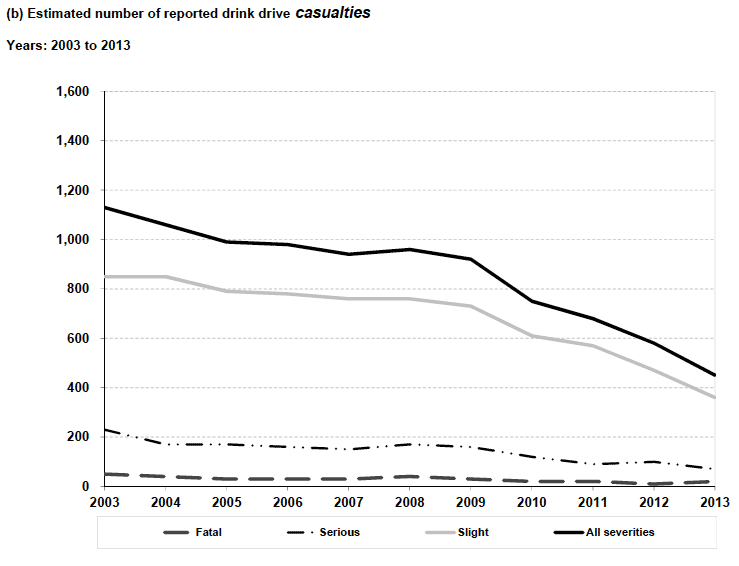
Table 22
Reported Road Casualties Scotland 2014
Table 22


| Number of accidents/casualties | ||||||||
| Accidents | Casualties | |||||||
|---|---|---|---|---|---|---|---|---|
| Fatal | Serious | Slight | Total | Killed | Serious | Slight | Total | |
| 2004-08 Average | 30 | 130 | 520 | 690 | 30 | 170 | 790 | 990 |
| 2003 | 40 | 180 | 530 | 750 | 50 | 230 | 850 | 1,130 |
| 2004 | 30 | 140 | 540 | 710 | 40 | 170 | 850 | 1,060 |
| 2005 | 30 | 130 | 500 | 660 | 30 | 170 | 790 | 990 |
| 2006 | 30 | 130 | 550 | 720 | 30 | 160 | 780 | 980 |
| 2007 | 20 | 120 | 530 | 670 | 30 | 150 | 760 | 940 |
| 2008 | 30 | 140 | 490 | 660 | 40 | 170 | 760 | 960 |
| 2009 | 20 | 120 | 520 | 660 | 30 | 160 | 730 | 920 |
| 2010 | 20 | 80 | 440 | 530 | 20 | 120 | 610 | 750 |
| 2011 | 20 | 70 | 400 | 490 | 20 | 90 | 570 | 680 |
| 2012 | 10 | 90 | 340 | 440 | 10 | 100 | 470 | 580 |
| 2013 | 10 | 50 | 260 | 330 | 20 | 70 | 360 | 450 |
| 2009-13 average | 20 | 80 | 390 | 490 | 20 | 110 | 550 | 680 |
Note: individual columns may not sum to totals due to rounding