Table 21 Motorists involved in reported injury accidents, breath tested and breath test results, by time of day, 2004-08 and 2013-2017 averages, 2013 to 2017
Reported Road Casualties Scotland 2017
Table 21 Motorists involved in reported injury accidents, breath tested and breath test results, by time of day, 2004-08 and 2013-2017 averages, 2013 to 2017
| Year | Time of day | |||||||||
|---|---|---|---|---|---|---|---|---|---|---|
| 00.00 to 02.59 | 03.00 to 05.59 | 06.00 to 08.59 | 09.00 to 11.59 | 12.00 to 14.59 | 15.00 to 17.59 | 18.00 to 20.59 | 21.00 to 23.59 | Total | ||
| (a) Numbers | ||||||||||
| Motorists involved | 2004-08 average | 754 | 391 | 2,520 | 2,996 | 4,125 | 5,400 | 3,201 | 1,598 | 20,985 |
| 2013 | 400 | 233 | 1,792 | 2,230 | 2,962 | 3,804 | 2,128 | 833 | 14,382 | |
| 2014 | 423 | 241 | 1,808 | 2,076 | 2,826 | 3,924 | 2,207 | 858 | 14,363 | |
| 2015 | 413 | 205 | 1,601 | 2,086 | 2,807 | 3,753 | 2,088 | 894 | 13,847 | |
| 2016 | 336 | 210 | 1,874 | 2,087 | 2,820 | 3,646 | 2,072 | 901 | 13,946 | |
| 2017 | 300 | 162 | 1,421 | 1,837 | 2,385 | 3,244 | 1,819 | 747 | 11,915 | |
| 2013 to 2017 average | 374 | 210 | 1,699 | 2,063 | 2,760 | 3,674 | 2,063 | 847 | 13,691 | |
| Breath tests requested | 2004-08 average | 490 | 248 | 1,496 | 1,769 | 2,401 | 3,179 | 1,959 | 1,020 | 12,563 |
| 2013 | 261 | 149 | 1,072 | 1,316 | 1,725 | 2,296 | 1,312 | 536 | 8,667 | |
| 2014 | 269 | 147 | 1,075 | 1,257 | 1,629 | 2,257 | 1,300 | 527 | 8,461 | |
| 2015 | 251 | 113 | 907 | 1,195 | 1,591 | 2,099 | 1,223 | 556 | 7,935 | |
| 2016 | 205 | 119 | 1,004 | 1,154 | 1,522 | 1,858 | 1,139 | 488 | 7,489 | |
| 2017 | 182 | 103 | 829 | 967 | 1,285 | 1,760 | 1,059 | 433 | 6,618 | |
| 2013 to 2017 average | 234 | 126 | 977 | 1,178 | 1,550 | 2,054 | 1,207 | 508 | 7,834 | |
| Positive/refused | 2004-08 average | 118 | 63 | 33 | 26 | 30 | 47 | 66 | 91 | 474 |
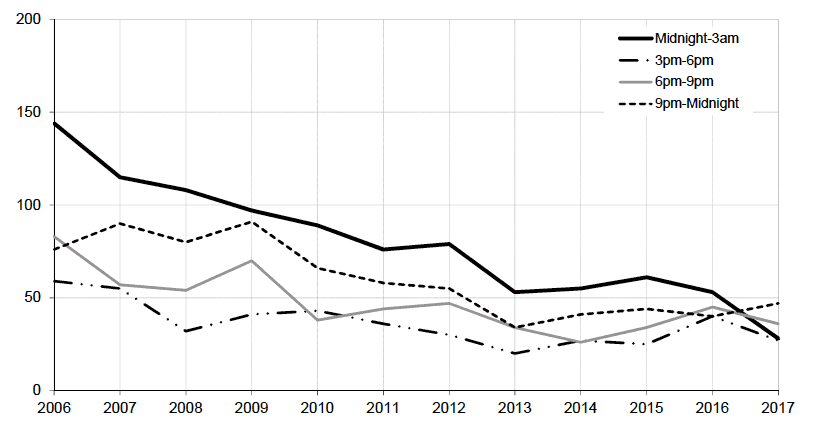
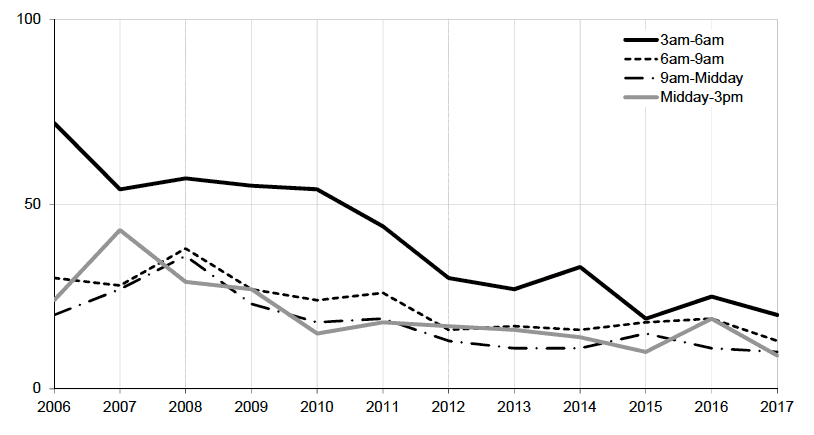
| 2006 | 144 | 72 | 30 | 20 | 24 | 59 | 83 | 76 | 508 | |
| 2007 | 115 | 54 | 28 | 27 | 43 | 55 | 57 | 90 | 469 | |
| 2008 | 108 | 57 | 38 | 36 | 29 | 32 | 54 | 80 | 434 | |
| 2009 | 97 | 55 | 27 | 23 | 27 | 41 | 70 | 91 | 431 | |
| 2010 | 89 | 54 | 24 | 18 | 15 | 43 | 38 | 66 | 347 | |
| 2011 | 76 | 44 | 26 | 19 | 18 | 36 | 44 | 58 | 321 | |
| 2012 | 79 | 30 | 16 | 13 | 17 | 30 | 47 | 55 | 287 | |
| 2013 | 53 | 27 | 17 | 11 | 16 | 20 | 34 | 34 | 212 | |
| 2014 | 55 | 33 | 16 | 11 | 14 | 27 | 26 | 41 | 223 | |
| 2015 | 61 | 19 | 18 | 15 | 10 | 25 | 34 | 44 | 226 | |
| 2016 | 53 | 25 | 19 | 11 | 19 | 40 | 45 | 40 | 252 | |
| 2017 | 28 | 20 | 13 | 10 | 9 | 27 | 36 | 47 | 190 | |
| 2013 to 2017 average | 50 | 25 | 17 | 12 | 14 | 28 | 35 | 41 | 221 | |
| (b) Percentages | ||||||||||
| Breath test requested as percent of motorists involved | 2004-08 average | 65.0 | 63.5 | 59.4 | 59.0 | 58.2 | 58.9 | 61.2 | 63.8 | 59.9 |
| 2013 | 65.3 | 63.9 | 59.8 | 59.0 | 58.2 | 60.4 | 61.7 | 64.3 | 60.3 | |
| 2014 | 63.6 | 61.0 | 59.5 | 60.5 | 57.6 | 57.5 | 58.9 | 61.4 | 58.9 | |
| 2015 | 60.8 | 55.1 | 56.7 | 57.3 | 56.7 | 55.9 | 58.6 | 62.2 | 57.3 | |
| 2016 | 61.0 | 56.7 | 53.6 | 55.3 | 54.0 | 51.0 | 55.0 | 54.2 | 53.7 | |
| 2017 | 60.7 | 63.6 | 58.3 | 52.6 | 53.9 | 54.3 | 58.2 | 58.0 | 55.5 | |
| 2013 to 2017 average | 62.4 | 60.0 | 57.5 | 57.1 | 56.2 | 55.9 | 58.5 | 60.0 | 57.2 | |
| Positive/refused as percent of motorists involved | 2004-08 average | 15.6 | 16.2 | 1.3 | 0.9 | 0.7 | 0.9 | 2.1 | 5.7 | 2.3 |
| 2013 | 13.3 | 11.6 | 0.9 | 0.5 | 0.5 | 0.5 | 1.6 | 4.1 | 1.5 | |
| 2014 | 13.0 | 13.7 | 0.9 | 0.5 | 0.5 | 0.7 | 1.2 | 4.8 | 1.6 | |
| 2015 | 14.8 | 9.3 | 1.1 | 0.7 | 0.4 | 0.7 | 1.6 | 4.9 | 1.6 | |
| 2016 | 15.8 | 11.9 | 1.0 | 0.5 | 0.7 | 1.1 | 2.2 | 4.4 | 1.8 | |
| 2017 | 9.3 | 12.3 | 0.9 | 0.5 | 0.4 | 0.8 | 2.0 | 6.3 | 1.6 | |
| 2013 to 2017 average | 13.4 | 11.8 | 1.0 | 0.6 | 0.5 | 0.8 | 1.7 | 4.9 | 1.6 | |
| Positive/refused as percent of those where breath test requested | 2004-08 average | 24.0 | 25.5 | 2.2 | 1.5 | 1.2 | 1.5 | 3.4 | 8.9 | 3.8 |
| 2013 | 20.3 | 18.1 | 1.6 | 0.8 | 0.9 | 0.9 | 2.6 | 6.3 | 2.4 | |
| 2014 | 20.4 | 22.4 | 1.5 | 0.9 | 0.9 | 1.2 | 2.0 | 7.8 | 2.6 | |
| 2015 | 24.3 | 16.8 | 2.0 | 1.3 | 0.6 | 1.2 | 2.8 | 7.9 | 2.8 | |
| 2016 | 25.9 | 21.0 | 1.9 | 1.0 | 1.2 | 2.2 | 4.0 | 8.2 | 3.4 | |
| 2017 | 15.4 | 19.4 | 1.6 | 1.0 | 0.7 | 1.5 | 3.4 | 10.9 | 2.9 | |
| 2013 to 2017 average | 21.4 | 19.7 | 1.7 | 1.0 | 0.9 | 1.4 | 2.9 | 8.1 | 2.8 | |
Table 21 Motorists involved in reported injury road accidents with positive or refused breath test
Years: 2006 to 2017
(a) Late afternoon/evening to night time (3pm-3am)

(b) Early morning to early afternoon (3am-3pm)
