Statistical Tables (49)
Statistical Tables
| Road User | Age group | Killed | Serious 2 | Slight 2 | All Severities | Killed | Serious 2 | Slight 2 | All Severities |
|---|---|---|---|---|---|---|---|---|---|
| numbers | rates per thousand population | ||||||||
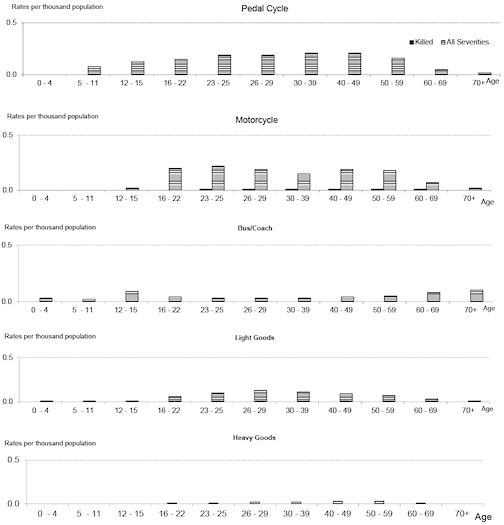
| Heavy goods | 0 - 4 | - | .. | .. | - | - | .. | .. | - |
| 5 - 11 | - | .. | .. | - | - | .. | .. | - | |
| 12 - 15 | - | .. | .. | - | - | .. | .. | - | |
| 16 - 22 | - | .. | .. | 3 | - | .. | .. | 0.01 | |
| 23-25 | - | .. | .. | 3 | - | .. | .. | 0.01 | |
| 26-29 | - | .. | .. | 5 | - | .. | .. | 0.02 | |
| 30 - 39 | - | .. | .. | 14 | - | .. | .. | 0.02 | |
| 40 - 49 | 1 | .. | .. | 24 | - | .. | .. | 0.03 | |
| 50 - 59 | - | .. | .. | 21 | - | .. | .. | 0.03 | |
| 60 - 69 | - | .. | .. | 9 | - | .. | .. | 0.01 | |
| 70 & over | - | .. | .. | 1 | - | .. | .. | - | |
| Total 1 | 2 | .. | .. | 80 | - | .. | .. | 0.01 | |
| Child 0-15 | - | .. | .. | 1 | - | .. | .. | - | |
| Adult 16+ | 2 | .. | .. | 79 | - | .. | .. | 0.02 | |
| Other | 0 - 4 | - | .. | .. | - | - | .. | .. | - |
| 5 - 11 | - | .. | .. | 1 | - | .. | .. | - | |
| 12 - 15 | - | .. | .. | 1 | - | .. | .. | - | |
| 16 - 22 | - | .. | .. | 8 | - | .. | .. | 0.02 | |
| 23-25 | 1 | .. | .. | 2 | - | .. | .. | 0.01 | |
| 26-29 | - | .. | .. | 3 | - | .. | .. | 0.01 | |
| 30 - 39 | - | .. | .. | 12 | - | .. | .. | 0.02 | |
| 40 - 49 | - | .. | .. | 11 | - | .. | .. | 0.02 | |
| 50 - 59 | - | .. | .. | 13 | - | .. | .. | 0.02 | |
| 60 - 69 | - | .. | .. | 7 | - | .. | .. | 0.01 | |
| 70 & over | 1 | .. | .. | 7 | - | .. | .. | 0.01 | |
| Total 1 | 3 | .. | .. | 65 | - | .. | .. | 0.01 | |
| Child 0-15 | - | .. | .. | 1 | - | .. | .. | - | |
| Adult 16+ | 3 | .. | .. | 63 | - | .. | .. | 0.01 | |
| Total | 0 - 4 | 1 | .. | .. | 133 | - | .. | .. | 0.47 |
| 5 - 11 | 2 | .. | .. | 413 | - | .. | .. | 1.00 | |
| 12 - 15 | 2 | .. | .. | 332 | 0.01 | .. | .. | 1.50 | |
| 16 - 22 | 16 | .. | .. | 1,357 | 0.04 | .. | .. | 3.04 | |
| 23-25 | 10 | .. | .. | 630 | 0.04 | .. | .. | 2.81 | |
| 26-29 | 10 | .. | .. | 748 | 0.03 | .. | .. | 2.48 | |
| 30 - 39 | 21 | .. | .. | 1,514 | 0.03 | .. | .. | 2.18 | |
| 40 - 49 | 23 | .. | .. | 1,420 | 0.03 | .. | .. | 2.00 | |
| 50 - 59 | 25 | .. | .. | 1,352 | 0.03 | .. | .. | 1.73 | |
| 60 - 69 | 20 | .. | .. | 764 | 0.03 | .. | .. | 1.20 | |
| 70 & over | 36 | .. | .. | 793 | 0.05 | .. | .. | 1.12 | |
| Total 1 | 166 | .. | .. | 9,474 | 0.03 | .. | .. | 1.75 | |
| Child 0-15 | 5 | .. | .. | 877 | 0.01 | .. | .. | 0.96 | |
| Adult 16+ | 161 | .. | .. | 8,577 | 0.04 | .. | .. | 1.90 | |
1. Includes those whose age was 'not known'
2. Due to changes in the the way casualty severities are recorded, figures for serious and slight casualties in 2019 are not comparable with previous years.
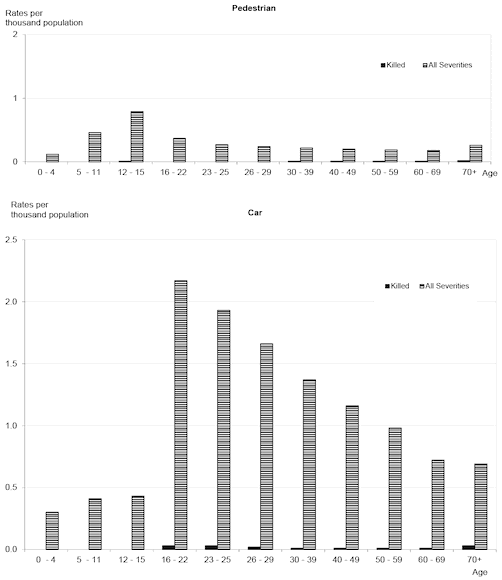
Table 32: Reported casualty rates per thousand population by mode of transport, age group and severity
Years: 2015-2019 average

Table 32: Reported casualty rates per thousand population by mode of transport, age group and severity
Years: 2014-2018 average
