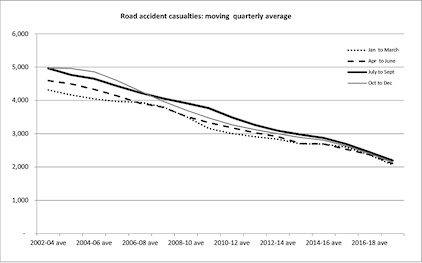
Statistical Tables (68)
Statistical Tables
| Percentage difference from average per quarter for that year | ||||||||||
|---|---|---|---|---|---|---|---|---|---|---|
| Jan to March | Apr to June | July to Sept | Oct to Dec | Total for year | Average per quarter | Jan to March | Apr to June | July to Sept | Oct to Dec | |
| (c) All severities | ||||||||||
| numbers | percentage | |||||||||
| 1981 | 6,231 | 7,029 | 7,813 | 7,693 | 28,766 | 7,192 | -13 | -2 | 9 | 7 |
| 1982 | 6,298 | 6,933 | 7,606 | 7,436 | 28,273 | 7,068 | -11 | -2 | 8 | 5 |
| 1983 | 5,384 | 6,176 | 6,796 | 6,868 | 25,224 | 6,306 | -15 | -2 | 8 | 9 |
| 1984 | 5,339 | 6,409 | 6,890 | 7,520 | 26,158 | 6,540 | -18 | -2 | 5 | 15 |
| 1985 | 5,684 | 6,623 | 7,802 | 7,178 | 27,287 | 6,822 | -17 | -3 | 14 | 5 |
| 1986 | 5,745 | 6,207 | 6,656 | 7,509 | 26,117 | 6,529 | -12 | -5 | 2 | 15 |
| 1987 | 5,145 | 5,977 | 7,013 | 6,613 | 24,748 | 6,187 | -17 | -3 | 13 | 7 |
| 1988 | 5,629 | 5,808 | 6,956 | 7,032 | 25,425 | 6,356 | -11 | -9 | 9 | 11 |
| 1989 | 6,255 | 6,332 | 7,410 | 7,535 | 27,532 | 6,883 | -9 | -8 | 8 | 9 |
| 1990 | 6,184 | 6,559 | 7,360 | 7,125 | 27,228 | 6,807 | -9 | -4 | 8 | 5 |
| 1991 | 5,646 | 6,114 | 6,827 | 6,759 | 25,346 | 6,337 | -11 | -4 | 8 | 7 |
| 1992 | 5,886 | 5,701 | 6,453 | 6,133 | 24,173 | 6,043 | -3 | -6 | 7 | 1 |
| 1993 | 5,089 | 5,566 | 5,910 | 5,849 | 22,414 | 5,604 | -9 | -1 | 5 | 4 |
| 1994 | 5,522 | 5,164 | 5,674 | 6,213 | 22,573 | 5,643 | -2 | -8 | 1 | 10 |
| 1995 | 5,172 | 5,115 | 5,971 | 5,936 | 22,194 | 5,549 | -7 | -8 | 8 | 7 |
| 1996 | 4,519 | 5,108 | 5,905 | 6,184 | 21,716 | 5,429 | -17 | -6 | 9 | 14 |
| 1997 | 5,468 | 5,407 | 5,740 | 6,014 | 22,629 | 5,657 | -3 | -4 | 1 | 6 |
| 1998 | 5,060 | 5,419 | 5,780 | 6,208 | 22,467 | 5,617 | -10 | -4 | 3 | 11 |
| 1999 | 5,129 | 4,888 | 5,377 | 5,608 | 21,002 | 5,251 | -2 | -7 | 2 | 7 |
| 2000 | 4,937 | 4,828 | 5,116 | 5,637 | 20,518 | 5,130 | -4 | -6 | 0 | 10 |
| 2001 | 4,717 | 4,796 | 5,128 | 5,270 | 19,911 | 4,978 | -5 | -4 | 3 | 6 |
| 2002 | 4,527 | 4,615 | 5,141 | 4,992 | 19,275 | 4,819 | -6 | -4 | 7 | 4 |
| 2003 | 4,242 | 4,534 | 4,969 | 5,011 | 18,756 | 4,689 | -10 | -3 | 6 | 7 |
| 2004 | 4,173 | 4,635 | 4,779 | 4,915 | 18,502 | 4,626 | -10 | 0 | 3 | 6 |
| 2005 | 4,070 | 4,315 | 4,550 | 4,950 | 17,885 | 4,471 | -9 | -3 | 2 | 11 |
| 2006 | 3,895 | 4,042 | 4,617 | 4,715 | 17,269 | 4,317 | -10 | -6 | 7 | 9 |
| 2007 | 3,926 | 4,054 | 4,132 | 4,127 | 16,239 | 4,060 | -3 | 0 | 2 | 2 |
| 2008 | 4,014 | 3,641 | 3,946 | 3,991 | 15,592 | 3,898 | 3 | -7 | 1 | 2 |
| 2009 | 3,474 | 3,686 | 4,091 | 3,792 | 15,043 | 3,761 | -8 | -2 | 9 | 1 |
| 2010 | 3,050 | 3,230 | 3,716 | 3,342 | 13,338 | 3,335 | -9 | -3 | 11 | 0 |
| 2011 | 2,945 | 3,078 | 3,486 | 3,276 | 12,785 | 3,196 | -8 | -4 | 9 | 2 |
| 2012 | 3,018 | 3,230 | 3,275 | 3,189 | 12,712 | 3,178 | -5 | 2 | 3 | 0 |
| 2013 | 2,771 | 2,786 | 3,034 | 2,901 | 11,492 | 2,873 | -4 | -3 | 6 | 1 |
| 2014 | 2,714 | 2,714 | 2,964 | 2,910 | 11,302 | 2,826 | -4 | -4 | 5 | 3 |
| 2015 | 2,601 | 2,613 | 2,923 | 2,840 | 10,977 | 2,744 | -5 | -5 | 7 | 3 |
| 2016 | 2,753 | 2,743 | 2,729 | 2,673 | 10,898 | 2,725 | 1 | 1 | 0 | -2 |
| 2017 | 2,426 | 2,231 | 2,413 | 2,363 | 9,433 | 2,358 | 3 | -5 | 2 | 0 |
| 2018 | 1,899 | 2,148 | 2,197 | 2,180 | 8,424 | 2,106 | -10 | 2 | 4 | 4 |
| 2019 | 1,871 | 1,937 | 1,978 | 1,852 | 7,638 | 1,910 | -2 | 1 | 4 | -3 |
