The likely range of random year-to-year variation in road accident and casualty numbers for Scotland as a whole
The likely range of random year-to-year variation in road accident and casualty numbers for Scotland as a whole
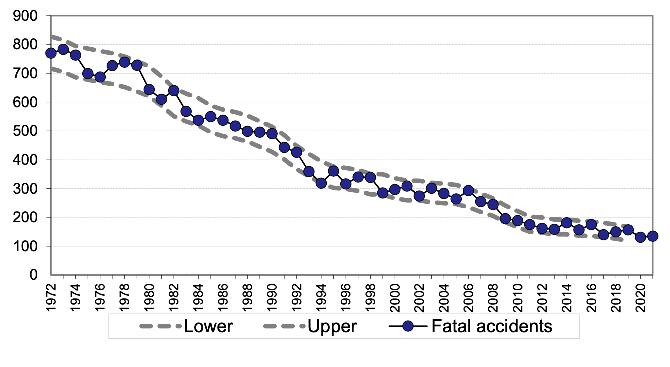
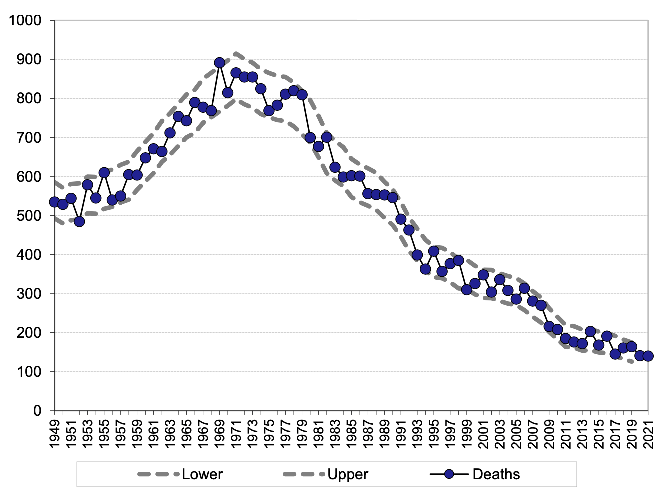
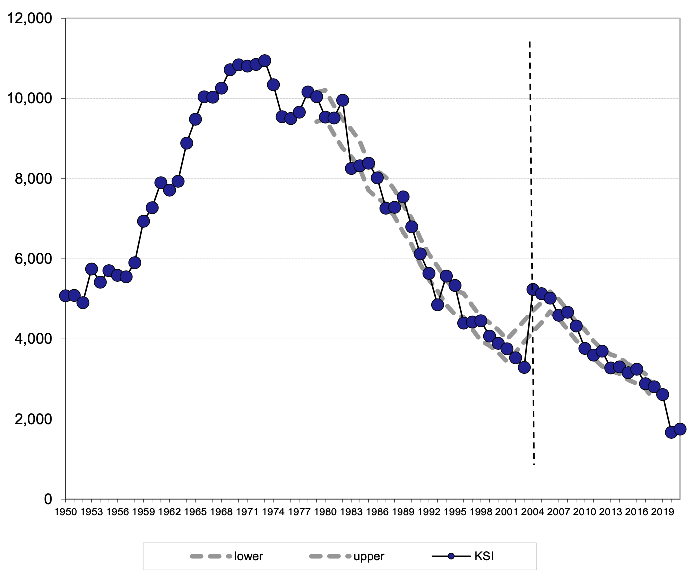
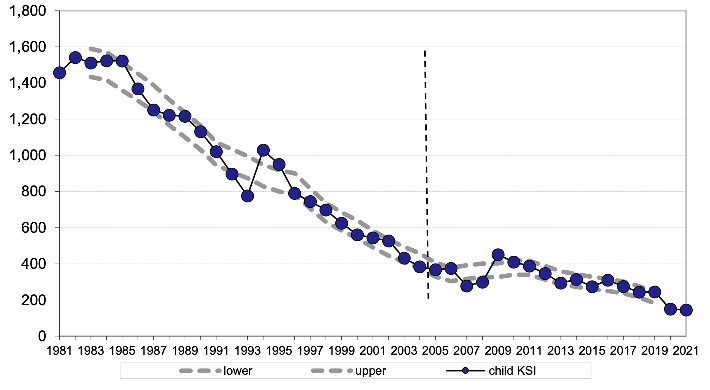
Because road accidents may occur at random, the numbers of accidents, and the numbers of casualties in those accidents, can fluctuate from year to year. Figures 2 to 5 show, for Scotland as a whole, the numbers of:
- fatal road accidents (1972 to 2021);
- road deaths (1949 to 2021);
- people killed or seriously injured (1950 to 2021);
- children killed or seriously injured (1981 to 2021).
The number of years covered by each chart reflects the availability of the relevant figures. The blue dots are the values in each year, and the blue lines indicate the year-to-year variation. The grey dashed lines show the likely range of random year-to-year variation in the figures: based on statistical theory, one would expect that only about 5% of years would have figures outwith these ranges. Appendix G describes how these ranges were produced: the limits of the likely ranges of values are calculated in a similar way to 95% confidence intervals. It also explains why they cannot be produced for all years. It should be noted that figures for combined fatal and serious, serious and slight severities prior to 2004 cannot be compared to later years due to changes in the way casualty severities were recorded from 2004 onwards.


Note for figure 4: Due to changes in the way casualty severities are recorded, serious figures in 2004 are not comparable with previous years.

Note for figure 5: Due to changes in the way casualty severities are recorded, serious figures in 2004 are not comparable with previous years.
Fatal accidents, and deaths in road accidents
Figures 2 and 3 show that the number of fatal accidents is within its likely range of values in every year, and the number of road deaths is within its likely range of values in all but three years. These results are reasonable: one would expect a few years' figures to be outside the likely range of random year-to-year variation, given that there are over 40 years' figures for fatal accidents and over 60 years' figures for road accident deaths. Figures 2 and 3 therefore show that, despite the large percentage changes such as the falls in deaths of 19% between 1998 and 1999, and of 13% between 2001 and 2002, the figures almost always remain within the expected ranges. Hence, one should not put too much weight on a single large percentage change.
Killed or seriously injured (KSI) casualties
Figure 4 has many years' figures (around a third) outwith the calculated likely range of values. The reason for this is that statistical variability is not the only reason for year-to-year changes – other factors have contributed to sharp falls and rises in KSI casualty numbers. For example, the sharp fall shown in 1983 may be partly due to the introduction of seat belt wearing (for drivers and front seat passengers in most cars and light vans). Similarly, the sharp rise in 1994 may be due in part to the change in hospital practices where more casualties were kept in overnight for observation.
Such factors change the underlying rate of occurrence of accidents and/or casualties, and therefore, in effect, introduce a break into the series of moving average values. The method used to calculate the likely range of random variation cannot take account of the effect of such changes.
Only Figure 4 has figures outwith the calculated interval due to the likely ranges of random year-to-year variation calculated for small numbers being quite wide in percentage terms. This is because, for a Poisson process (see Appendix G), by definition, the greater the frequency of occurrence of events, the smaller the proportion that the standard deviation of the frequency (which is the square root of that number) represents of that number. For example:
- with 100 cases, the square root is 10 – or 10% of the value;
- with 400 cases, the square root is 20 – 5% of the value;
- with 10,000 cases, the square root is 100 – only 1% of the value.
As a result, if a factor (like the introduction of the compulsory wearing of front seat belts) were to cause the same percentage fall in each of the four types of accident and casualty numbers used in the charts, the following might be observed. The percentage fall could be within the relatively wide percentage range of likely random variation around the smaller numbers, but outwith the relatively narrow percentage range of likely random variation around the larger numbers. The ranges in Figures 2, 3 and 5 appear to be sufficiently wide to encompass the effects of changes such as those mentioned above. That is, the effects of the changes in their first years may fall within the likely range of random variation.
Of course, over the longer-term, such changes should make significant contributions to the reductions in casualty numbers and their severity. However, the intervals in Figure 4 include a much smaller than expected proportion of the figures. This is because the likely range of random variation for KSI casualties represents only a small percentage of the total, and factors like those mentioned above appear to have had a greater percentage effect than was seen in their first years.
Children killed or seriously injured
Figure 5 shows the year-to-year fluctuations in the numbers of children killed or seriously injured (for the years for which figures are readily available) are generally within the expected ranges. The exceptions are around 1994, when health boards' policies changed, with the result that more child casualties were admitted to hospitals for overnight observation. This changed the classification of many injuries from slight to serious.
When changes in operational practice or to administrative processes have a marked effect on the statistics, the resulting year-to-year changes can be much greater than those expected due to normal random year-to-year variation – so it is not surprising there are figures outwith the expected ranges around 1994.
< Previous | Contents | Next >