Road Casualty Reduction Figures
Road Safety Framework 2019 - Annual Report
Road Casualty Reduction Figures
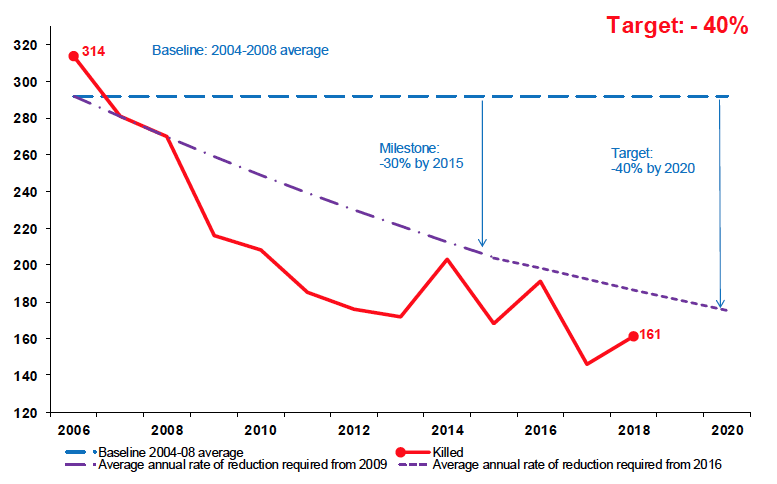
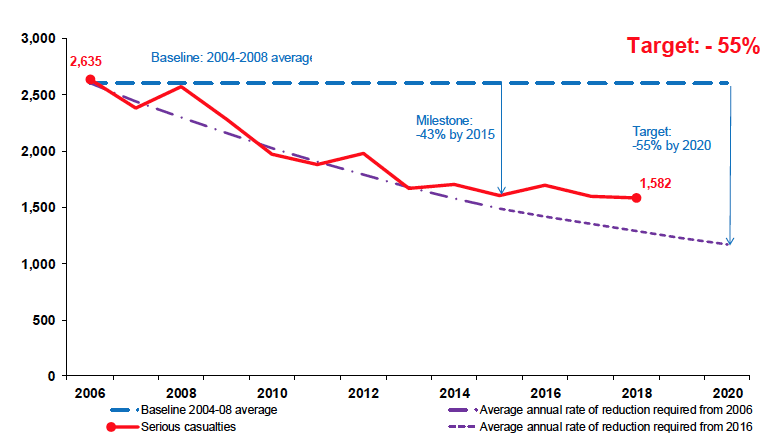
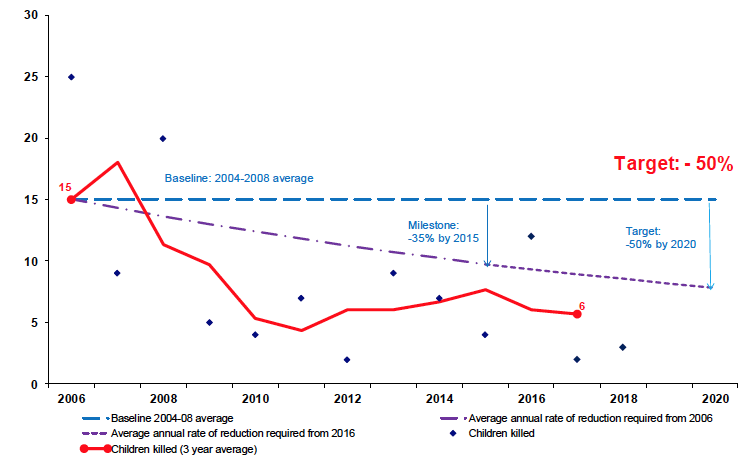
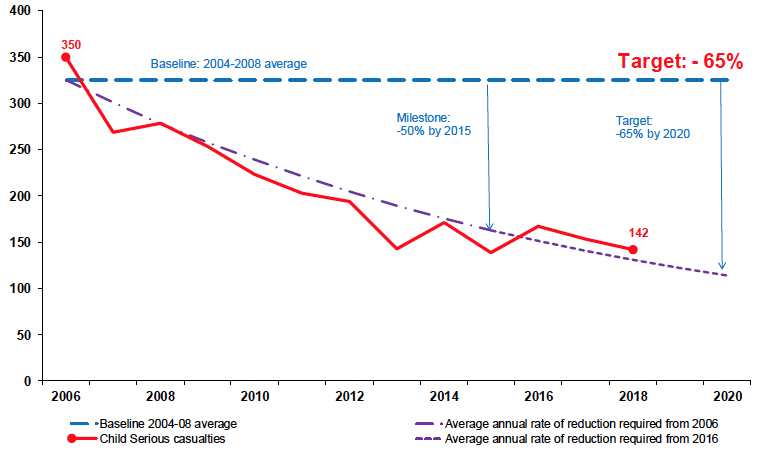
Reported Road Casualties Scotland 2018, the latest year for which official statistics are available, continue to track the long-term downward trend towards the Framework Targets. The charts show an "indicative line" representing a constant annual percentage decrease that would result in meeting the 2020 targets. This is an accepted way to represent progress towards a target; however, it should not be assumed that the trend will match these lines exactly.
Graph 1: Reported casualties killed

In 2018, there were 161 (45%) fewer road deaths than the 2004-2008 average of 292; the reduction rate indicates Scotland is on track to meet the 2020 target.
Graph 2: Reported seriously Injured casualties

In 2018, there were 1,582 (39%) fewer seriously injured casualties than the 2004-2008 average of 2,605. The number of people seriously injured falls short of the 2020 target but continues a general downward trend.
Graph 3: Reported children killed

Three children were reported as killed in 2018, an average of six a year in the 2016-2018 period. There were nine (63%) fewer deaths compared to the 2004-2008 average of 15. The level of reduction exceeds the 2015 milestone.
Graph 4: Reported child seriously Injured casualties

In 2018, there were 142 (56%) fewer child seriously injured casualties than the 2004-2008 average of 325. The number of children seriously injured exceeded the 2015 milestone and continues a general downward trend.