4. Mobile phone survey results
Seatbelt and Mobile Phone Usage Survey Scotland, 2017
4. Mobile phone survey results
The 2017 mobile phone survey resulted in 14,427 drivers being observed in Scotland, the majority of which (79%, 11,392) were in cars.
Key findings
- mobile phone use has increased overall. In 2017, 2% of all drivers were observed using a mobile phone at moving sites and 2.5% at stationary sites, compared to 1.6% and 1.7% respectively in 2014
- notably, at-ear mobile phone use has increased for all drivers, bringing use up to similar levels for in-hand use
- mobile phone use by drivers of 'other vehicles' (vans, lorries, buses, coaches, and minibuses) was higher at both moving and stationary sites (2.9% and 3% respectively) compared to car drivers
- data collected at stationary sites revealed that younger car drivers (aged between 17-29) were more likely to be observed using a mobile phone than those in older age categories
The majority of the results are based on data recorded during weekday observations, except from those sections which explicitly discuss weekends.
In addition, results presented in sections 4.4 to 4.8 focus solely on mobile phone use by car drivers due to small sample sizes for 'other vehicles'.
Figures relating to the mobile phone usage rates in England and across Great Britain have been provided by the Department of Transport, some of which have been calculated differently from the figures for Scotland. For example, the DfT car category does not include taxi or private hire drivers. However, broad comparisons of headline figures should be reliable. Further information and comparisons are available in the DfT (2019) publication Seatbelt and Mobile Phone Use Surveys: Great Britain, 2017.
4.1. Overview of observations
The 2017 mobile phone survey resulted in 14,427 drivers being observed in Scotland, the majority of which (79%, 11,392) were in cars.
| Vehicle type | Moving sites | Stationary sites |
|---|---|---|
| Car | 6,720 | 4,975 |
| Other vehicle | 1,634 | 1,098 |
| All vehicles | 8,354 | 6,073 |
4.2. Overall mobile phone use
Analysis of the weighted data collected through the mobile phone observation survey found that mobile phone use was slightly higher at stationary sites (see table 4.2). At-ear use has increased from 0.2% for both sites in 2014, to 0.9% and 1.3% for moving and stationary sites respectively in 2017 (see table 4.3). Therefore, at-ear and in-hand use are now at similar levels, whereas previously there was a distinction between type of use.
| Site type | All use | At-Ear | In-Hand | Sample size |
|---|---|---|---|---|
| Moving | 2.0% | 0.9% | 1.1% | 8,354 |
| Stationary | 2.5% | 1.3% | 1.2% | 6,073 |
4.3. Mobile phone use by vehicle type
There has been an increase of mobile phone use at both sites for all vehicles. This is driven by increased at-ear usage as in-hand usage has remained static for car drivers and notably decreased for drivers of 'other vehicles' (see table 4.3).
Car drivers were less likely than drivers of 'other vehicles' to use mobile phones at both moving (1.8% compared to 3%) and stationary sites (2.4% compared to 2.9%). However, drivers of 'other vehicles' were less likely to be observed using a mobile phone in-hand than car drivers at stationary sites (0.3% versus 1.5%).
| Site type | Vehicle type | Scotland 2014 | Scotland 2017 | 2017 Scotland sample size | ||||
|---|---|---|---|---|---|---|---|---|
| All use | At-ear | In-hand | All use | At-ear | In-hand | |||
| Moving | Car | 1.3% | 0.2% | 1.1% | 1.8% | 0.7% | 1.1% | 6,720 |
| Other vehicle | 2.9% | 0.5% | 1.4% | 2.9% | 1.8% | 1.1% | 1,634 | |
| All vehicles | 1.6% | 0.2% | 1.3% | 2.0% | 0.9% | 1.1% | 8,354 | |
| Stationary | Car | 1.6% | 0.2% | 1.5% | 2.4% | 0.9% | 1.5% | 4,975 |
| Other vehicle | 1.8% | 0.6% | 1.2% | 3.0% | 2.7% | 0.3% | 1,098 | |
| All vehicles | 1.7% | 0.2% | 1.4% | 2.5% | 1.3% | 1.2% | 6,073 | |
Considering 'other vehicles' in Scotland, van drivers were more likely than lorry drivers to be observed using a mobile phone at both moving and stationary sites (see table 4.4). Rates for van drivers at moving sites were found to be notably higher than lorry drivers, while lorry drivers' mobile phone use at stationary sites has increased significantly from 0% in 2014 to 1.9% in 2017. However, it is worth noting the small sample size for lorry drivers.
| Vehicle type | Moving sites | Stationary sites | ||||||
|---|---|---|---|---|---|---|---|---|
| All use | At-ear | In-Hand | Sample size | All use | At-ear | In-Hand | Sample size | |
| Van | 3.4% | 2.0% | 1.4% | 1,225 | 3.2% | 2.8% | 0.4% | 800 |
| Lorry | 0.2% | 0.0% | 0.2% | 231 | 1.9% | 1.9% | 0.0% | 183 |
| Van and Lorry | 2.9% | 1.6% | 1.2% | 1,456 | 2.9% | 2.6% | 0.3% | 983 |
Mobile phone usage rates at stationary sites in Scotland were marginally higher compared to England and Wales and Great Britain (see table 4.5). While drivers in Scotland were almost equally as likely to be recorded using a mobile phone in-hand as at-ear, drivers in England and Wales were more likely to be observed using a mobile phone in-hand. A comparison of mobile phone use at moving sites is not possible (see section 2.4 for more information).
| Stationary sites | ||||
|---|---|---|---|---|
| All use | At-ear | In-hand | Sample size | |
| Great Britain | 2.1% | 0.7% | 1.4% | 18,274 |
| England and Wales | 2.2% | 0.5% | 1.7% | 12,201 |
| Scotland | 2.5% | 1.3% | 1.2% | 6,073 |
4.4. Mobile phone use by gender
Analysis of mobile phone use by gender revealed marginal differences between male and female drivers. Mobile phone use by female drivers was the same across sites. Male drivers were somewhat more likely than female drivers to be observed using a mobile phone at stationary sites (2.6% compared to 2%), while female drivers were marginally more likely to be recorded using a mobile phone at moving sites (2% compared to 1.7%).
| Site type | Male | Sample size | Female | Sample size |
|---|---|---|---|---|
| Moving | 1.7% | 3,736 | 2.0% | 2,977 |
| Stationary | 2.6% | 2,748 | 2.0% | 2,189 |
The survey recorded a general increase of mobile phone use compared to 2014 levels, most notably of at-ear use. For male drivers, at-ear use at stationary sites was observed as 1.1% compared to 0.3% in 2014.
| Site type | Use | Scotland 2014 | Scotland 2017 | ||
|---|---|---|---|---|---|
| Male | Female | Male | Female | ||
| Moving | At-ear | 0.1% | 0.2% | 0.7% | 0.7% |
| In-hand | 1.2% | 0.9% | 1.0% | 1.3% | |
| All use | 1.3% | 1.2% | 1.7% | 2.0% | |
| Stationary | At-ear | 0.3% | 0.1% | 1.1% | 0.7% |
| In-hand | 1.3% | 1.6% | 1.5% | 1.4% | |
| All use | 1.6% | 1.7% | 2.6% | 2.0% | |
Figure 4.1
4.5. Mobile phone use by age
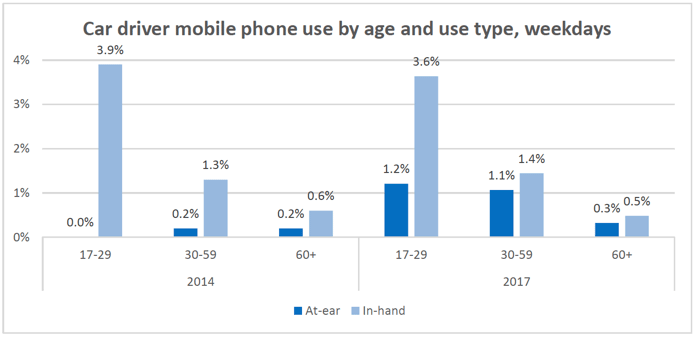
Analysis of the data collected at stationary sites by age found that younger drivers (those aged between 17 and 29) were more likely to be observed using a mobile phone than those in older age groups (see table 4.8).
| 17-29 | 30-59 | 60+ | |
|---|---|---|---|
| At-ear | 1.2% | 1.1% | 0.3% |
| In-hand | 3.6% | 1.4% | 0.5% |
| All use | 4.8% | 2.5% | 0.8% |
| Sample size | 523 | 3,253 | 1,178 |
All mobile phone use for younger drivers has also increased since 2014. In-hand use has decreased slightly for those aged 60+, while at-ear use has increased for drivers aged 30 to 59 (see figure 4.2). Overall mobile phone use has increased for all age groups except for drivers aged 60+ whose usage rate has remained static.
Figure 4.2
The usage rates according to age followed a similar pattern for both men and women, with the highest overall usage rate found amongst younger men.
| Age | Male | Female | ||||||
|---|---|---|---|---|---|---|---|---|
| All use | At-ear | In-hand | Sample size | All use | At-ear | In-hand | Sample size | |
| 17-29 | 5.9% | 1.2% | 4.7% | 159 | 4.3% | 1.1% | 3.2% | 361 |
| 30-59 | 2.9% | 1.3% | 1.6% | 1,822 | 2.0% | 0.7% | 1.3% | 1,403 |
| 60+ | 1.2% | 0.5% | 0.7% | 760 | 0.1% | 0.0% | 0.1% | 413 |
4.6. Mobile phone use by area and road type
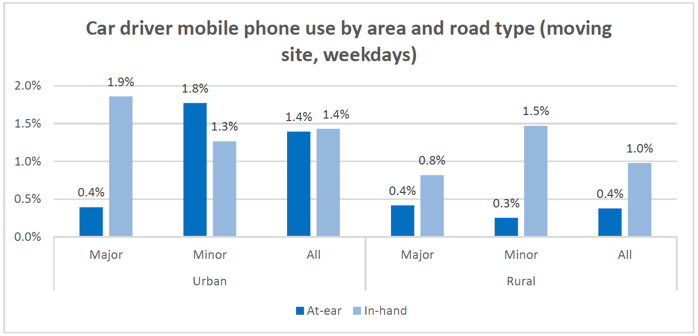
The largest proportion of car drivers observed using mobile phones at moving sites were on minor roads in urban areas (3.0%). This signifies a change from 2014 when major roads in urban areas had the largest proportion of car drivers observed using mobile phones. Drivers were also more likely to be observed using mobile phones in urban areas overall than rural (2.8% compared to 1.4%).
Figure 4.3

The opposite was true for stationary sites, where rural areas had the largest proportion of drivers observed using mobile phones, with minor roads in particular having the greatest percentage of mobile phone usage at 8.6%. This is a notable change from 2014, where minor roads in rural areas had the lower proportion of mobile phone usage at 0.4%. However, only two stationary rural minor road sites were surveyed in 2017, neither of which were included in the 2014 survey. It is possible that these sites have particularly high mobile phone usage rates relative to the sites surveyed in 2014, rather than there being a general increase in mobile phone use on these types of roads.
Figure 4.4
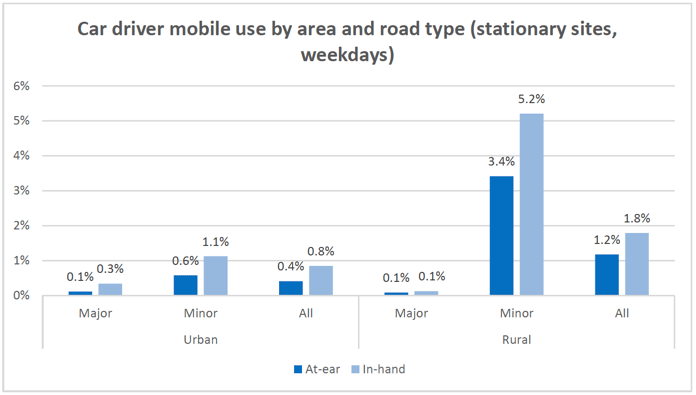
Mobile phone usage at major roads in urban areas decreased from 1.9% in 2014 to 0.4% in 2017, and at major roads in rural areas from 2.1% in 2014 to 0.2% in 2017.
4.7. Mobile phone use by time of day
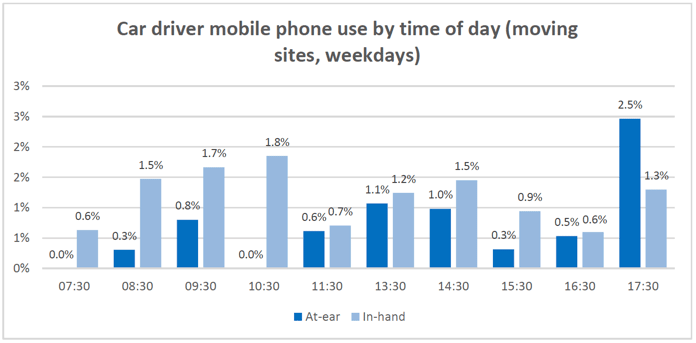
Analysis of the data recorded at moving sites found varying levels of mobile phone use over the course of the day, peaking at 17.30.
Figure 4.5
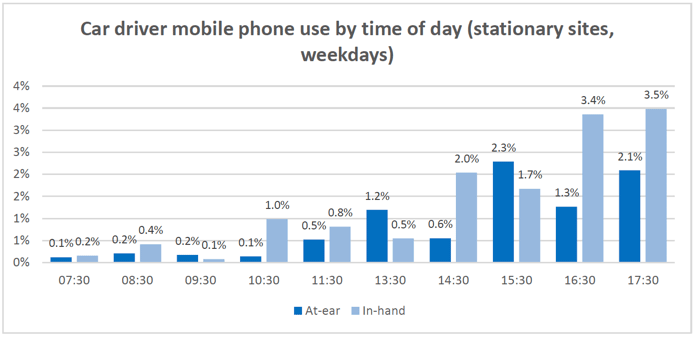
In contrast, mobile phone use at stationary sites seemed to increase as the day progressed, with higher levels at later times of day.
Figure 4.6
4.8. Mobile phone use by time of week
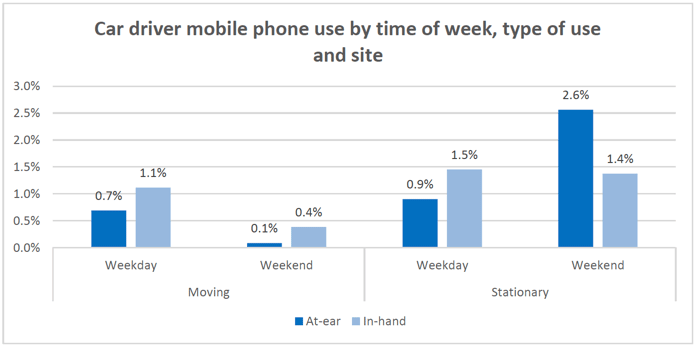
In order to allow comparison between weekdays and weekends, a selected number of sites were re-surveyed on a Saturday. Analysis of only those sites surveyed both during the week and at the weekend shows that usage rates were higher during the week at moving sites (1.8% compared to 0.5%). Conversely, usage rates at stationary sites were higher at the weekend (3.9% compared to 2.4%). This contrasts with findings from 2014 where the weekend rate at stationary sites was recorded at 1.5% which was lower than the weekday rate of 2.3%.
Figure 4.7
