Appendix H - Scheme feedback
Introduction
A total of 19,584 responses were received in response to the consultation. This included 19,484 responses via the online questionnaire on Citizen Space, 55 hardcopy forms (returned at consultation events, by post, or email), and 45 unstructured email responses. 139 organisations responded to the consultation.
Two emails were received as additional comments from respondents who had already completed questionnaires. One organisation submitted an email response in addition to a survey form. One email response from an organisation included answers to closed questions in addition to unstructured feedback, so these answers were included in the closed question survey data.
This section provides an overview of all feedback received. Most respondents opted to take part via the online questionnaire. Data is presented in the same order as the questions were presented in the questionnaire for ease of interpretation.
For closed questions, percentages are shown rounded to the nearest whole number. All charts have data labels, and the corresponding narrative states the number of respondents that selected each question option where relevant.
Thematic feedback from unstructured email responses is presented following the questionnaire data.
Current speed limit experiences
The first five questions in the survey sought to understand respondents’ opinions on current speed limits.
Question 1 asked respondents how frequently they use single carriageways with a national speed limit of 60mph. 19,527 respondents provided a valid response to this question. The results are shown in Figure 1.
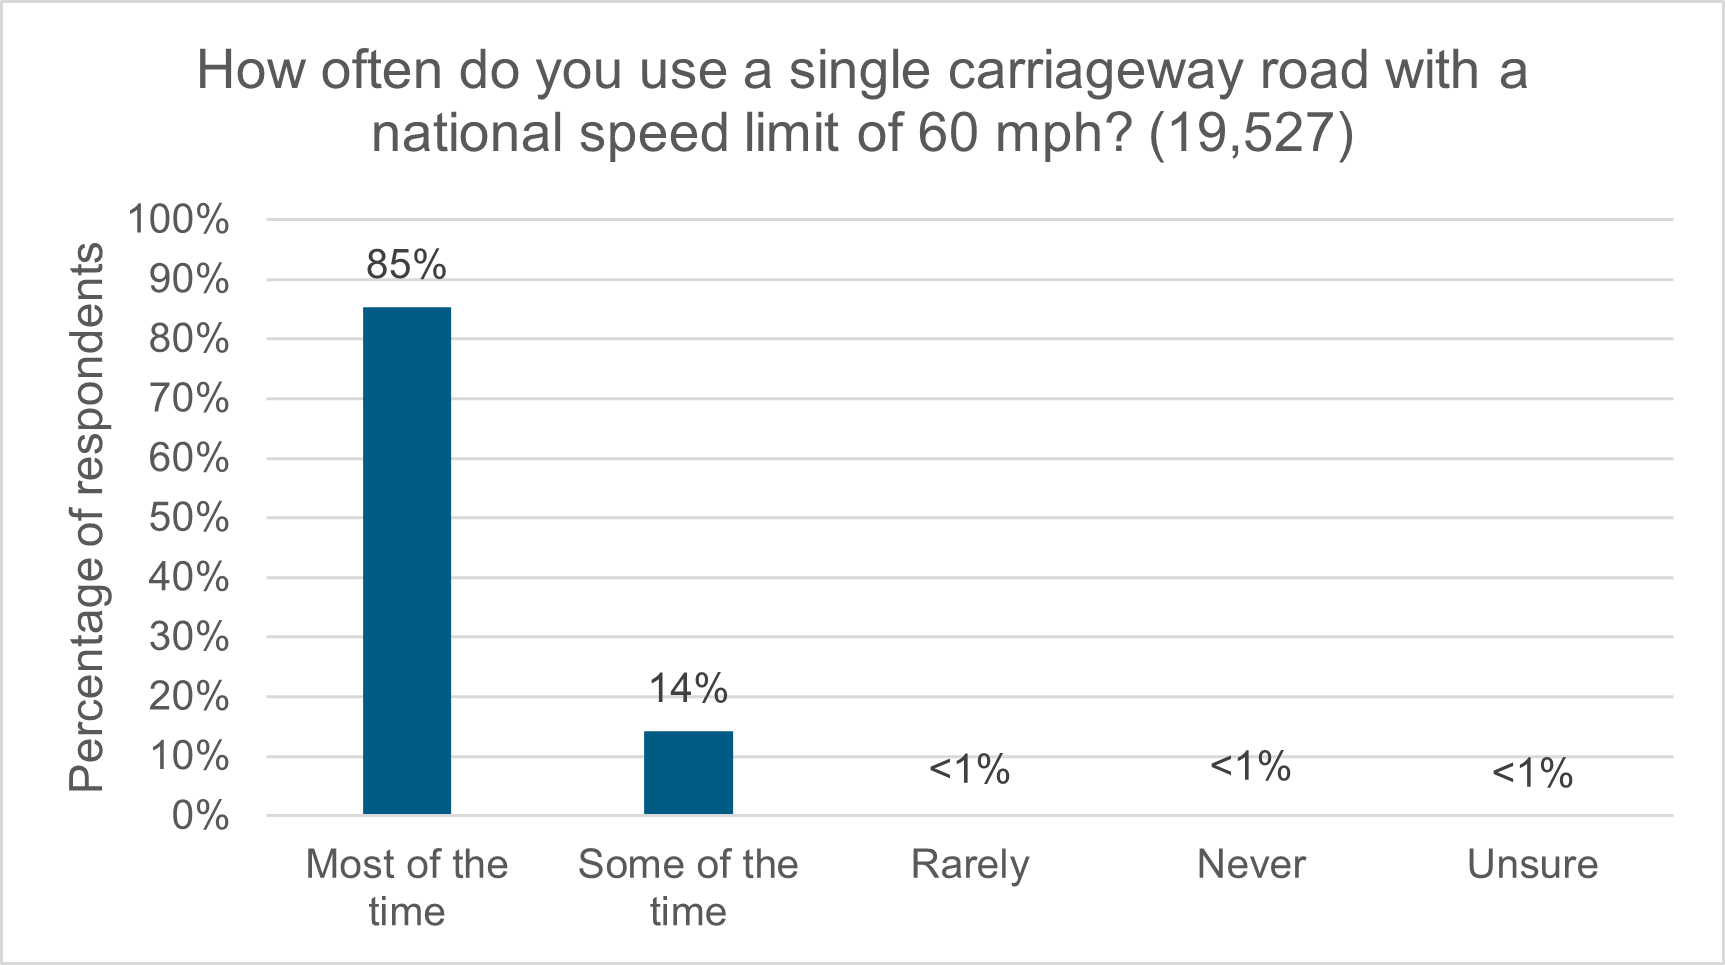
As shown in Figure 1, 85% of respondents (16,669) use a single carriageway road with a national speed limit of 60mph most of the time. 14% of respondents (2,785) use this type of road some of the time. Less than 1% of respondents use this type of road rarely (58), never (10) or were unsure (5).
Question 2 asked how respondents felt about the current national speed limit on single carriageway roads for cars and motorcycles.
19,532 respondents provided a valid response to this question. The results are shown in Figure 2.
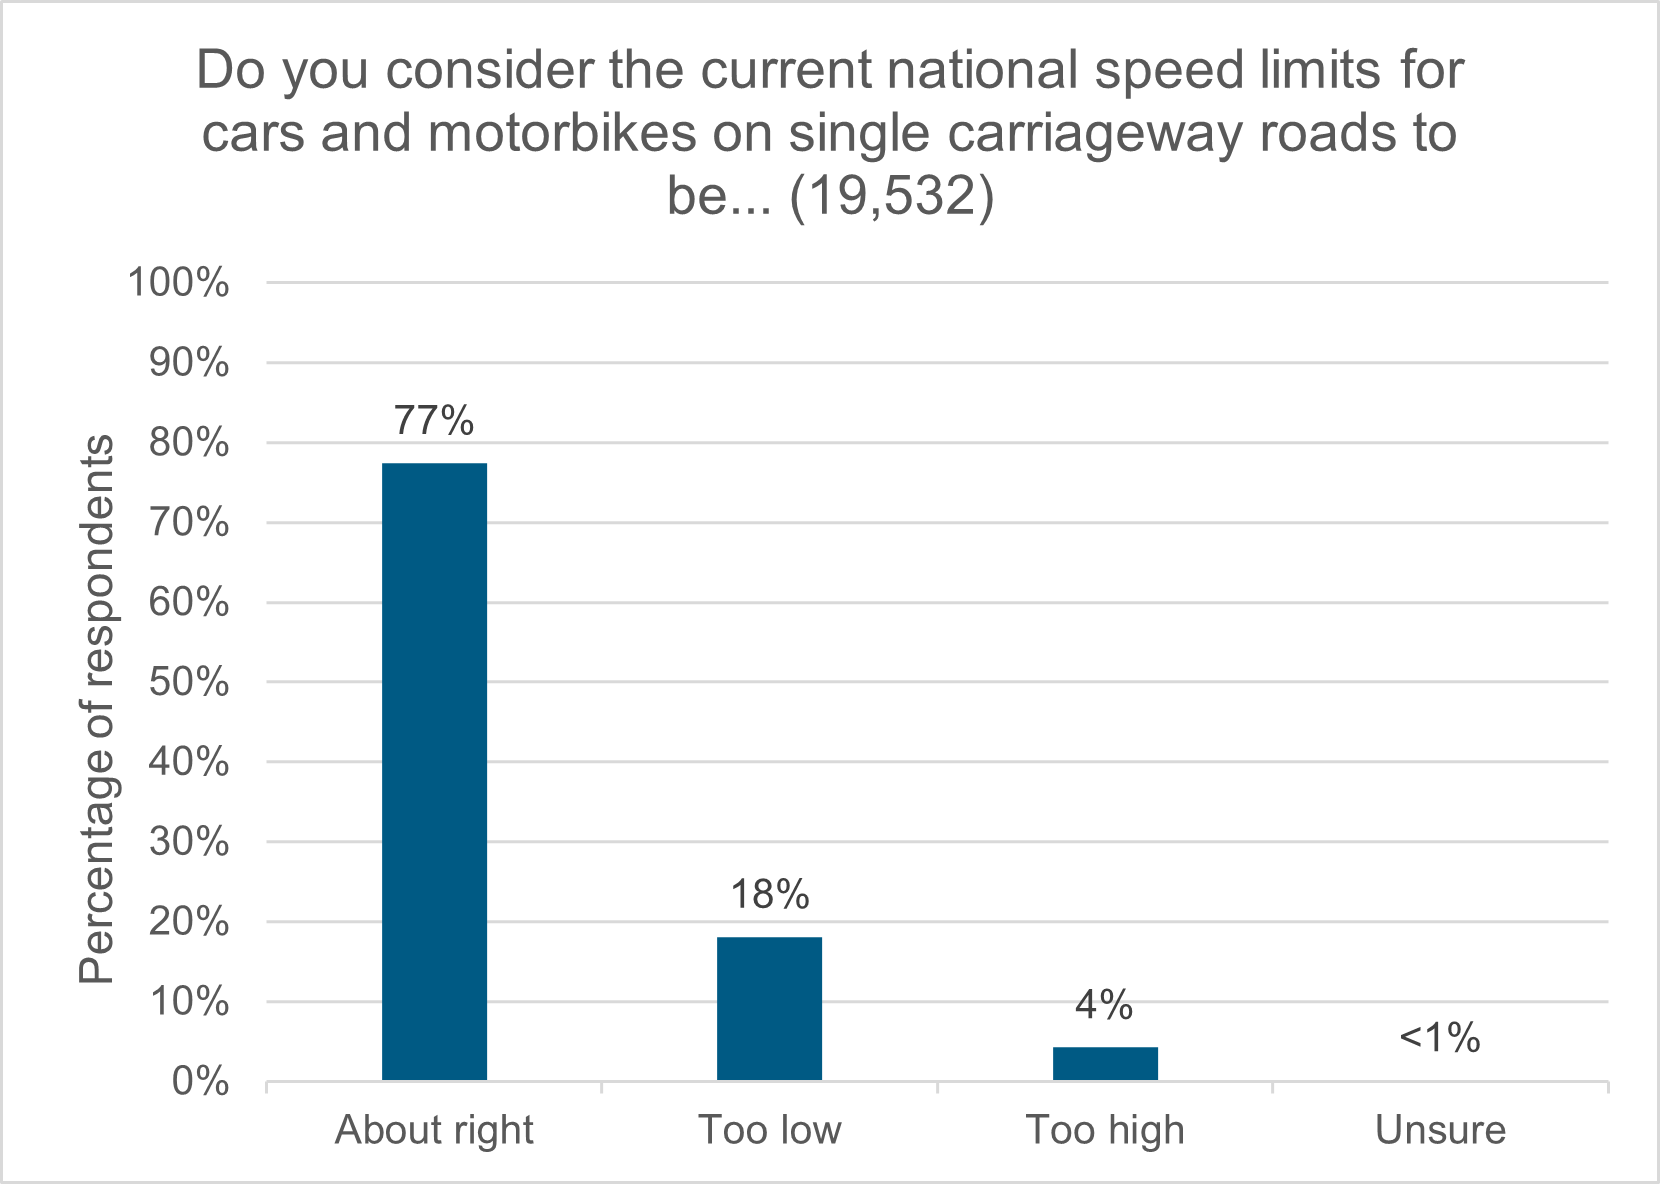
As shown in Figure 2, 77% of respondents (15,126) felt the current national speed limit for cars and motorcycles is about right. 18% of respondents (3,539) thought that the current national speed limit was too low, whilst 4% of respondents (836) felt it was too high. Less than 1% of respondents (31) were unsure.
Of those who provided responses to this question (19,532), 139 responded as organisations. Of these organisations 71% (98) said the current national speed limit for cars and motorcycles is about right. 14% of respondents (20) thought that the current national speed limit was too low, whilst 14% of respondents (20) felt it was too high. 1% of respondents (1) were unsure.
Question 3 asked how respondents felt about the current national speed limit on dual carriageway roads for cars and motorcycles.
19,521 respondents provided a valid response to this question. The results are shown in Figure 3.

As shown in Figure 3, 60% of respondents (11,676) thought the national speed limit for cars and motorcycles on dual carriageways was about right. 39% of respondents (7,552) felt the current limit was too low, whilst 1% of respondents (274) thought it was too high. Less than 1% of respondents (19) were unsure.
Of those who provided responses to this question (19,531), 131 responded as organisations. Of these organisations, 69% of respondents (90) thought the national speed limit for cars and motorcycles on dual carriageways was about right. 24% of respondents (32) felt the current limit was too low, whilst 6% of respondents (8) thought it was too high. 1% of respondents (1) were unsure.
Question 4 asked how respondents felt about the current speed limit on single carriageway roads for goods vehicles over 7.5 tonnes.
19,510 respondents provided a valid response to this question. The results are shown in Figure 4.

As shown in Figure 4, 47% of respondents (9,226) thought the speed limit for Heavy Goods Vehicles (HGVs) on single carriageways was about right. 47% of respondents (9,161) said the current HGV limit was too low. 3% of respondents (637) thought the current limit was too high, whilst 2% of respondents (486) were unsure.
Of those who provided responses to this question (19,510), 131 responded as organisations. Of these organisations, 37% (48) thought the speed limit for Heavy Goods Vehicles (HGVs) on single carriageways was about right. 57% of respondents (75) felt the current limit was too low, whilst 4% of respondents (5) thought it was too high. 2% of respondents (3) were unsure.
Question 5 asked how respondents felt about the current speed limit on dual carriageway roads for goods vehicles over 7.5 tonnes. 19,520 respondents provided a valid response to this question. The results are shown in Figure 5.

As shown in Figure 5, 54% of respondents (10,617) thought the speed limit for Heavy Goods Vehicles (HGVs) on dual carriageways was about right. 41% of respondents said the current HGV limit was too low (7,959) and 2% of respondents (476) thought the current limit was too high. 2% of respondents (486) were unsure.
Of those who provided responses to this question (19,510), 131 responded as organisations. Of these organisations 45% of respondents (59) thought the speed limit for Heavy Goods Vehicles (HGVs) on dual carriageways was about right. 49% of respondents (65) said the current HGV limit was too low and 5% of respondents (7) thought the current limit was too high. 1% of respondents (1) were unsure.
Safety considerations
Reduction in the national speed limit
Question 6 asked respondents if they thought a reduction in the current national speed limit on single carriageway roads would support national casualty reduction targets.
As these questions weren’t mandatory, the base size of respondents to each element varies. The results are shown in Figure 6.

Across all of the target reduction targets around 9 out of ten respondents selected ‘no’ that they did not think the reduction would support them.
- For the target of a 50% reduction in people killed: 90% of respondents (17,635) selected “no”, 6% of respondents (1,103) “yes” and 4% of respondents (764) “unsure”. Of those who responded to this question (19,502), 133 responded as organisations. Of these organisations, 68% of respondents (90) selected “no”, 23% of respondents (30) “yes” and 10% of respondents (13) “unsure”.
- For the target of a 50% reduction in people seriously injured: 90% of respondents (17,454) selected “no”, 6% of respondents (1,155) “yes” and 4% of respondents (861) “unsure”. Of those who responded to this question (19,470), 134 responded as organisations. Of these organisations, 66% of respondents (89) selected “no”, 25% of respondents (33) “yes” and 9% of respondents (12) “unsure”.
- For the target of a 60% reduction in children (aged <16) killed: 88% of respondents (17,222) selected “no”, 5% of respondents (1,049) “yes” and 6% of respondents (1,195) “unsure”. Of those who responded to this question (19,466), 134 responded as organisations. Of these organisations, 70% of respondents (94) selected “no”, 20% of respondents (27) “yes” and 10% of respondents (13) “unsure”.
- For the target of a 60% reduction in children (aged <16) seriously injured: 88% of respondents (17,170) selected “no”, 5% of respondents (1,081) “yes” and 6% of respondents (1,198) “unsure”. Of those who responded to this question (19,449), 133 responded as organisations. Of these organisations, 70% of respondents (93) selected “no”, 20% of respondents (27) “yes” and 10% of respondents (13) “unsure”.
Question 7 introduced 12 impacts that could be affected by a reduction in the national speed limit on single carriageway roads. Respondents were asked how they thought these impacts might change if the national speed limit was reduced.
Respondents were invited to tick as many impacts that applied to them, so the base size shown for each varies – these are shown in brackets after each impact. The results are shown in Figure 7.

12,302 respondents provided an answer for at least one of the stated impacts in this question. Not every respondent provided a response for each impact, so percentages are calculated based on the number of responses received for each impact.
(Following the consultation launch on 27 November 2024, consultees provided feedback on the design of this question. In response to this feedback, the questionnaire wording was updated on 9 December 2024 at 14:40 to include a “no change” option to ensure respondents were able to express their view if they felt that the change would make no difference. Figure 7 shows responses received after the change to this question. Responses received prior to this change can be viewed in Appendix I.)
The breakdown of responses per impact, including the base size of respondents who answered the question in brackets, is:
Impact on driver frustration (12,278)
79% of respondents (9,716) - “makes a lot worse”
10% of respondents (1,231) - “worsens slightly”
5% of respondents (624) - “no change”
2% of respondents (192) - “improves slightly”
2% of respondents (292) - “improves a lot”
2% of respondents (223) - “unsure”
Impact on journey time (12,278)
60% of respondents (7,385) - “makes a lot worse”
27% of respondents (3,347) - “worsens slightly”
8% of respondents (1,022) - “no change”
1% of respondents (178) - “improves slightly”
1% of respondents (155) - “improves a lot”
2% of respondents (191) - “unsure”
Impact on climate change (12,255)
14% of respondents (1,675) - “makes a lot worse”
14% of respondents (1,710) - “worsens slightly”
56% of respondents (6,868) - “no change”
5% of respondents (656) - “improves slightly”
2% of respondents (264) - “improves a lot”
9% of respondents (1,082) - “unsure”
Impact on noise (12,252)
11% of respondents (1,305) - “makes a lot worse”
10% of respondents (1,254) - “worsens slightly”
64% of respondents (7,880) - “no change”
6 of respondents (759) - “improves slightly”
3% of respondents (317) - “improves a lot”
6% of respondents (737) - “unsure”
Impact on air pollution (12,253)
16% of respondents (1,906) - “makes a lot worse”
17% of respondents (2,068) - “worsens slightly”
50% of respondents (6,092) - “no change”
7% of respondents (803) - “improves slightly”
3% of respondents (318) - “improves a lot”
9% of respondents (1,066) - “unsure”
Impact on quality of life (12,255)
34% of respondents (4,160) - “makes a lot worse”
24% of respondents (2,900) - “worsens slightly”
32% of respondents (3,907) - “no change”
3% of respondents (351) - “improves slightly”
4% of respondents (441) - “improves a lot”
4% of respondents (496) - “unsure”.
Impact on motorcycle safety (12,263)
14% of respondents (1,694) - “makes a lot worse”
13% of respondents (1,625) - “worsens slightly”
58% of respondents (7,056) - “no change”
6% of respondents (765) - “improves slightly”
4% of respondents (518) - “improves a lot”
5% of respondents (605) - “unsure”
Impact on horse rider safety (12,260)
9% of respondents (1,084) - “makes a lot worse”
7% of respondents (843) - “worsens slightly”
64% of respondents (7,246) - “no change”
9% of respondents (1,253) - “improves slightly”
5% of respondents (688) - “improves a lot”
6% of respondents (1,146) - “unsure”.
Impact on cyclist safety (12,260)
10% of respondents (1,272) - “makes a lot worse”
10% of respondents (1,192) - “worsens slightly”,
59% of respondents (7,278) - “no change”
9% of respondents (1,146) - “improves slightly”
5% of respondents (629) - “improves a lot”
6% of respondents (743) - “unsure”.
Impact on pedestrian safety (12,255)
9% of respondents (1,084) - “makes a lot worse”
7% of respondents (917) - “worsens slightly”
64% of respondents (7,893) - “no change”
9% of respondents (1,077) - “improves slightly”
5% of respondents (571) - “improves a lot”
6% of respondents (713) - “unsure”
Impact on serious collisions (12,263)
16% of respondents (2,010) - “makes a lot worse”
17% of respondents (2,137) - “worsens slightly”,
47% of respondents (5,813) - “no change”
10% of respondents (1,219) - “improves slightly”
4% of respondents (541) - “improves a lot”
4% of respondents (543) - “unsure”.
Impact on fatal collisions (12,280)
17% of respondents (2,117) - “makes a lot worse”
17% of respondents (2,132) - “worsens slightly”
47% of respondents (5,754) - “no change”
10% of respondents (1,237) - “improves slightly”
4% of respondents (525) - “improves a lot”
4% of respondents (515) - “unsure”
Of the 12,302 respondents who provided an answer for at least one of the stated impacts in this question, 105 were organisations.
Of these organisational responses, the breakdown of responses per impact, including the base size of those who answered the question in brackets, is:
Impact on driver frustration (104)
63% of respondents (66) - “makes a lot worse”
8% of respondents (8) - “worsens slightly”
7% of respondents (7) - “no change”
4% of respondents (4) - “improves slightly”
5% of respondents (5) - “improves a lot”
13% of respondents (14) - “unsure”
Impact on journey time (104)
50% of respondents (52) - “makes a lot worse”
29% of respondents (30) - “worsens slightly”
7% of respondents (7) - “no change”
6% of respondents (6) - “improves slightly”
2% of respondents (2) - “improves a lot”
7% of respondents (7) - “unsure”
Impact on climate change (103)
12% of respondents (12) - “makes a lot worse”
10% of respondents (10) - “worsens slightly”
41% of respondents (42) - “no change”
19% of respondents (20) - “improves slightly”
10% of respondents (10) - “improves a lot”
9% of respondents (9) - “unsure”
Impact on noise (103)
9% of respondents (9) - “makes a lot worse”
6% of respondents (6) - “worsens slightly”
49% of respondents (50) - “no change”
22% of respondents (23) - “improves slightly”
10% of respondents (10) - “improves a lot”
5% of respondents (5) - “unsure”
Impact on air pollution (104)
12% of respondents (12) - “makes a lot worse”
13% of respondents (13) - “worsens slightly”
40% of respondents (42) - “no change”
20% of respondents (21) - “improves slightly”
8% of respondents (8) - “improves a lot”
8% of respondents (8) - “unsure”
Impact on quality of life (103)
26% of respondents (27) - “makes a lot worse”
18% of respondents (19) - “worsens slightly”
25% of respondents (26) - “no change”
13% of respondents (13) - “improves slightly”
12% of respondents (12) - “improves a lot”
6% of respondents (6) - “unsure”.
Impact on motorcycle safety (104)
13% of respondents (14) - “makes a lot worse”
12% of respondents (12) - “worsens slightly”
38% of respondents (40) - “no change”
13% of respondents (14) - “improves slightly”
17% of respondents (18) - “improves a lot”
6% of respondents (6) - “unsure”
Impact on horse rider safety (105)
7% of respondents (7) - “makes a lot worse”
6% of respondents (6) - “worsens slightly”
47% of respondents (49) - “no change”
16% of respondents (17) - “improves slightly”
17% of respondents (18) - “improves a lot”
8% of respondents (8) - “unsure”.
Impact on cyclist safety (105)
8% of respondents (8) - “makes a lot worse”
13% of respondents (14) - “worsens slightly”,
43% of respondents (45) - “no change”
14% of respondents (15) - “improves slightly”
17% of respondents (18) - “improves a lot”
5% of respondents (5) - “unsure”.
Impact on pedestrian safety (104)
4% of respondents (4) - “makes a lot worse”
11% of respondents (11) - “worsens slightly”
50% of respondents (52) - “no change”
15% of respondents (16) - “improves slightly”
13% of respondents (13) - “improves a lot”
8% of respondents (8) - “unsure”
Impact on fatal collisions (105)
14% of respondents (15) - “makes a lot worse”
15% of respondents (16) - “worsens slightly”
26% of respondents (27) - “no change”
24% of respondents (25) - “improves slightly”
15% of respondents (16) - “improves a lot”
6% of respondents (6) - “unsure”
Question 8 was an open text box. It asked respondents to comment if they thought any impacts were missing from those outlined in the previous Question 7.
10,947 respondents provided a free text response to this question. Most respondents used this open text box to comment on the proposals in general, as opposed to specifically answering the stated question, therefore responses were coded according to more general themes. Many respondents used this question to comment further on the themes already outlined in Question 7.
Table 1 provides a breakdown of the thematic codes that were applied across the content of this question. Open text feedback can be wide ranging, ambiguous and cover multiple topics within one response. There is always a level of subjectivity in the interpretation of free text comments.
For easier interpretation, thematic codes are grouped within high-level themes, highlighted in light blue in Table 1. Where appropriate, supplementary context has been added to the themes.
Table 1: Are there any other impacts that a reduction in the national speed limit from 60mph to 50mph for cars and motorcycles on single carriageway roads that have been missed?
If so, please detail below.
The feedback to this question is provided in order of theme frequency.
Table 1a. Road safety theme
|
Sub theme |
Sub theme total |
|---|---|
|
Lowering national speed limit would increase driver frustration |
5,077 |
|
Drivers would not comply with change in speed limits |
1,118 |
|
Modern vehicles are safe travelling at higher speeds |
692 |
|
Lowering national speed limit would reduce concentration and lead to fatigue |
672 |
|
Lowering national speed limit would increase collisions |
298 |
|
Lowering national speed limit would have no impact on collisions |
249 |
|
Increasing HGV limit would result in reduced need to overtake |
108 |
|
Lowering national speed limit would decrease collisions |
107 |
|
Comments about cyclist behaviour and safety |
105 |
|
More consideration should be given to different vehicle classes |
87 |
|
Increasing HGV limit would increase driver frustration |
81 |
|
Comments about pedestrian behaviour and safety |
76 |
|
Lowering national speed limit would have positive impact on driver behaviour |
66 |
|
Perception that non-motorised users are not frequent users of dual (and single) carriageways |
60 |
|
Increasing HGV limit would increase collisions |
42 |
|
Lowering national speed limit could increase wear and damage to cars |
40 |
|
Increasing HGV limit would increase stopping distance |
36 |
|
Lowering national speed limit would positively impact non-motorised users |
29 |
|
Proposals would have no impact on non-motorised user safety |
28 |
|
Road worthiness of vehicles |
15 |
|
Increasing HGV limit would negatively impact safety of non-motorised users |
6 |
|
HGV drivers have higher skill level |
5 |
|
Increasing HGV speed limit could increase wear and damage to HGV vehicles |
5 |
|
Increasing HGV limit would decrease collisions |
5 |
|
Lowering national speed limit could decrease wear and damage to cars |
4 |
|
Increasing HGV limit would have no impact on safety / collisions |
2 |
|
Road safety |
9,013 total |
Table 1b. Traffic and transport theme
|
Sub theme |
Sub theme total |
|---|---|
|
Lowering the national speed limit would negatively impact journey times |
1557 |
|
Speed limits should be bespoke to specific road design and conditions |
766 |
|
Suggestion to improve road infrastructure / design |
433 |
|
Lowering national speed limit would negatively impact journey times for businesses |
324 |
|
Speed limits should be consistent across the UK |
146 |
|
Public transport in rural areas is lacking as an alternative to driving |
135 |
|
Lowering national speed limit would negatively impact emergency services and response vehicles |
116 |
|
Suggestion to improve signage on roads |
87 |
|
Lowering national speed limit would positively impact journey times |
20 |
|
Increasing HGV limit would positively impact journey times |
14 |
|
Reducing national speed limit could reduce wear on roads |
13 |
|
Increasing HGV limit would negatively impact journey times |
12 |
|
Increasing HGV limit could cause more wear on roads |
8 |
|
Suggestion for road infrastructure or rules for HGVs travelling at higher speeds |
8 |
|
Lowering national speed limit would have no impact on journey times |
6 |
|
Lowering national speed limit could increase wear on roads |
6 |
|
Suggestion to reduce amount of freight transported by road |
5 |
|
Traffic and transport |
3,656 total |
Table 1c. General theme
|
Sub theme |
Sub theme total |
|---|---|
|
Criticism of the Scottish Government |
719 |
|
General opposition to reducing the national speed limit |
611 |
|
Scottish Government should direct resources to road maintenance instead |
550 |
|
Scottish Government should dual major roads instead of changing speed limits |
404 |
|
Concern about the cost of implementing the proposals |
208 |
|
Scottish Government should direct resources elsewhere instead |
141 |
|
General support for increasing HGV limit |
102 |
|
General support for reducing the national speed limit |
49 |
|
Scottish Government should invest in improving public transport and dedicated active travel infrastructure instead |
48 |
|
General opposition to increasing HGV limit |
26 |
|
General |
2,858 total |
Table 1d. Enforcement theme
|
Sub theme |
Sub theme total |
|---|---|
|
Concern that key issue is a minority of dangerous drivers, not the speed limit itself |
850 |
|
Suggestion relating to driver education |
569 |
|
Increased police presence would be necessary to enforce change in speed limits |
414 |
|
Suggestion for alternative speed limit proposal |
356 |
|
Suggestion for tougher penalties for speeding and dangerous driving |
151 |
|
Increase enforcement (non-specific suggestion) |
129 |
|
More speed cameras would be needed to enforce a lowered national speed limit |
103 |
|
Reducing the national speed limit would be difficult to enforce |
102 |
|
Comments relating to vehicle technology |
69 |
|
Suggestion relating to promotion of good driving practice |
38 |
|
Suggestion to remove speed cameras |
21 |
|
Decrease enforcement (non-specific suggestion) |
13 |
|
Suggestions relating to insurance or financial incentives |
12 |
|
Enforcement |
2,832 total |
Table 1e. Socioeconomic theme
|
Sub theme |
Sub theme total |
|---|---|
|
Reducing national speed limit would have a disproportionate impact on people who need to travel long distances |
979 |
|
Reducing national speed limit would negatively impact Scotland's economy |
416 |
|
Proposals would negatively impact quality of life |
354 |
|
Concern about driving ability of non-locals |
212 |
|
Reducing national speed limit would have negative impact on tourism |
144 |
|
Proposals would positively impact quality of life |
18 |
|
Increasing HGV limit would positively impact Scotland's economy |
5 |
|
Proposals would have no impact on quality of life |
4 |
|
Socioeconomic |
2,132 total |
Table 1f. Environment theme
|
Sub theme |
Sub theme total |
|---|---|
|
Reducing national speed limit would lead to decrease in fuel efficiency / negative climate change impact |
577 |
|
Reducing national speed limit would worsen air quality |
160 |
|
Reducing national speed limit would have no impact on climate change |
46 |
|
Reducing national speed limit would lead to increase in fuel efficiency / positive climate change impact |
38 |
|
Reducing national speed limit would lead to more noise |
30 |
|
Increasing HGV limit would lead to decrease in fuel efficiency / negative climate change impact |
21 |
|
Other suggestions relating to climate change |
16 |
|
Increasing HGV limit would lead to increase in fuel efficiency / positive climate change impact |
12 |
|
Reducing national speed limit would have no impact on air quality |
7 |
|
Reducing national speed limit would lead to less noise |
7 |
|
Proposals will have no impact on noise |
6 |
|
Reducing national speed limit would improve air quality |
6 |
|
Increasing HGV limit would improve air quality |
1 |
|
Increasing HGV limit would lead to more noise |
1 |
|
Increasing HGV limit would worsen air quality |
1 |
|
Environment |
929 total |
Table 1g. Consultation theme
|
Sub theme |
Sub theme total |
|---|---|
|
Criticism of the evidence provided for the proposals |
232 |
|
Criticism of the survey questions |
165 |
|
Criticism of the consultation as having a predetermined outcome |
61 |
|
General criticism of consultation |
50 |
|
Request for further information on the proposals |
45 |
|
Criticism of the consultation materials |
22 |
|
Positive feedback on the consultation process |
6 |
|
Criticism of the consultation events |
1 |
|
Criticism of the consultation promotion |
1 |
|
Consultation |
583 total |
Question 9 was an open text box. It asked respondents to comment if they thought any impacts outlined in the previous Question 7 were incorrect.
8,481 respondents provided a free text response to this question. Most respondents used this open text box to comment on the proposals in general, as opposed to specifically answering the stated question, therefore responses were coded according to more general themes. Many respondents used this question to comment further on the themes already outlined in Question 7.
Table 2 provides a breakdown of the thematic codes that were applied across the content of this question. Open text feedback can be wide ranging, ambiguous and cover multiple topics within one response. There is always a level of subjectivity in interpretation of free text comments.
For easier interpretation, thematic codes are grouped within high-level themes, highlighted in light blue in Table 2. Where appropriate, supplementary context has been added to the themes.
Table 2: Are there any impacts that a reduction in the national speed limit from 60mph to 50mph for cars and motorcycles on single carriageway roads that you consider to be incorrect? Please provide as much detail and evidence as you can to support this.
The feedback to this question is provided in order of theme frequency.
Table 2a. Road safety theme
|
Sub theme |
Sub theme total |
|---|---|
|
Lowering national speed limit would increase driver frustration |
2,587 |
|
Drivers would not comply with change in speed limits |
650 |
|
Lowering national speed limit would have no impact on collisions |
550 |
|
Modern vehicles are safe travelling at higher speeds |
435 |
|
Lowering national speed limit would increase collisions |
292 |
|
Lowering national speed limit would reduce concentration and lead to fatigue |
286 |
|
Perception that non-motorised users are not frequent users of dual (and single) carriageways |
108 |
|
Comments about pedestrian behaviour and safety |
72 |
|
Proposals would have no impact on non-motorised user safety |
66 |
|
Comments about cyclist behaviour and safety |
59 |
|
More consideration should be given to different vehicle classes |
54 |
|
Increasing HGV limit would result in reduced need to overtake |
50 |
|
Increasing HGV limit would increase collisions |
41 |
|
Lowering national speed limit would decrease collisions |
35 |
|
Increasing HGV limit would increase driver frustration |
28 |
|
Increasing HGV limit would increase stopping distance |
13 |
|
Lowering national speed limit could increase wear and damage to cars |
12 |
|
Lowering national speed limit would positively impact non-motorised users |
12 |
|
Lowering national speed limit would have positive impact on driver behaviour |
11 |
|
Road worthiness of vehicles |
10 |
|
Increasing HGV limit would have no impact on safety / collisions |
6 |
|
Increasing HGV limit would negatively impact safety of non-motorised users |
4 |
|
Increasing HGV speed limit could increase wear and damage to HGV vehicles |
2 |
|
Increasing HGV limit would decrease collisions |
2 |
|
HGV drivers have higher skill level |
1 |
|
Lowering national speed limit could decrease wear and damage to cars |
1 |
|
Road safety |
5,387 total |
Table 2b. Enforcement theme
|
Sub theme |
Sub theme totals |
|---|---|
|
Concern that key issue is a minority of dangerous drivers, not the speed limit itself |
680 |
|
Suggestion relating to driver education |
447 |
|
Increased police presence would be necessary to enforce change in speed limits |
204 |
|
Suggestion for alternative speed limit proposal |
186 |
|
Increase enforcement (non-specific suggestion) |
119 |
|
Suggestion for tougher penalties for speeding and dangerous driving |
99 |
|
Reducing the national speed limit would be difficult to enforce |
60 |
|
More speed cameras would be needed to enforce a lowered national speed limit |
56 |
|
Comments relating to vehicle technology |
39 |
|
Suggestion relating to promotion of good driving practice |
24 |
|
Suggestion to remove speed cameras |
21 |
|
Suggestions relating to insurance or financial incentives |
9 |
|
Decrease enforcement (non-specific suggestion) |
4 |
|
Enforcement |
1948 total |
Table 2c. Traffic and transport theme
|
Sub theme |
Sub theme total |
|---|---|
|
Lowering the national speed limit would negatively impact journey times |
758 |
|
Speed limits should be bespoke to specific road design and conditions |
520 |
|
Suggestion to improve road infrastructure / design |
284 |
|
Lowering national speed limit would negatively impact journey times for businesses |
78 |
|
Public transport in rural areas is lacking as an alternative to driving |
68 |
|
Suggestion to improve signage on roads |
61 |
|
Speed limits should be consistent across the UK |
49 |
|
Lowering national speed limit would negatively impact emergency services and response vehicles |
27 |
|
Increasing HGV limit would positively impact journey times |
14 |
|
Lowering national speed limit would positively impact journey times |
10 |
|
Increasing HGV limit would negatively impact journey times |
7 |
|
Suggestion to reduce amount of freight transported by road |
7 |
|
Increasing HGV limit could cause more wear on roads |
4 |
|
Lowering national speed limit would have no impact on journey times |
4 |
|
Suggestion for road infrastructure or rules for HGVs travelling at higher speeds |
4 |
|
Reducing national speed limit could reduce wear on roads |
3 |
|
Traffic and transport |
1,898 total |
Table 2d. General theme
|
Sub theme |
Sub theme total |
|---|---|
|
General opposition to reducing the national speed limit |
482 |
|
Criticism of the Scottish Government |
434 |
|
Scottish Government should direct resources to road maintenance instead |
343 |
|
Scottish Government should dual major roads instead of changing speed limits |
231 |
|
Scottish Government should direct resources elsewhere instead |
91 |
|
Concern about the cost of implementing the proposals |
80 |
|
General support for increasing HGV limit |
45 |
|
General support for reducing the national speed limit |
30 |
|
Scottish Government should invest in improving public transport and dedicated active travel infrastructure instead |
27 |
|
General opposition to increasing HGV limit |
18 |
|
General |
1,781 total |
Table 2e. Environment theme
|
Sub theme |
Sub theme total |
|---|---|
|
Reducing national speed limit would lead to decrease in fuel efficiency / negative climate change impact |
557 |
|
Reducing national speed limit would have no impact on climate change |
175 |
|
Reducing national speed limit would worsen air quality |
156 |
|
Reducing national speed limit would lead to more noise |
66 |
|
Proposals will have no impact on noise |
42 |
|
Reducing national speed limit would have no impact on air quality |
31 |
|
Other suggestions relating to climate change |
17 |
|
Increasing HGV limit would lead to decrease in fuel efficiency / negative climate change impact |
14 |
|
Reducing national speed limit would improve air quality |
7 |
|
Reducing national speed limit would lead to increase in fuel efficiency / positive climate change impact |
6 |
|
Reducing national speed limit would lead to less noise |
6 |
|
Increasing HGV limit would lead to increase in fuel efficiency / positive climate change impact |
4 |
|
Increasing HGV limit would lead to more noise |
4 |
|
Increasing HGV limit would have no impact on climate change |
3 |
|
Increasing HGV limit would worsen air quality |
2 |
|
Increasing HGV limit would improve air quality |
1 |
|
Environment |
1,091 |
Table 2f. Consultation theme
|
Sub theme |
Sub theme total |
|---|---|
|
Criticism of the evidence provided for the proposals |
604 |
|
Criticism of the survey questions |
244 |
|
Including commentary on optionality of Questions 7, 10 and 11. Changes made to these questions from feedback received can be viewed in Appendix I. |
72 |
|
Request for further information on the proposals |
68 |
|
General criticism of consultation |
59 |
|
Criticism of the consultation materials |
34 |
|
Criticism of the consultation promotion |
3 |
|
Criticism of the consultation events |
1 |
|
Consultation |
1,085 total |
Table 2g. Socioeconomic theme
|
Sub theme |
Sub theme total |
|
Reducing national speed limit would have a disproportionate impact on people who need to travel long distances |
347 |
|
Proposals would negatively impact quality of life |
144 |
|
Reducing NSL will negatively impact Scotland's economy |
123 |
|
Concern about driving ability of non-locals |
104 |
|
Reducing national speed limit would have negative impact on tourism |
33 |
|
Proposals would have no impact on quality of life |
11 |
|
Increasing HGV limit would positively impact Scotland's economy |
2 |
|
Proposals would positively impact quality of life |
1 |
|
Socioeconomic theme |
765 total |
Impact on serious collisions (105)
14% of respondents (15) - “makes a lot worse”
13% of respondents (14) - “worsens slightly”,
29% of respondents (30) - “no change”
23% of respondents (24) - “improves slightly”
16% of respondents (17) - “improves a lot”
5% of respondents (5) - “unsure”.
HGV questions
Question 10 introduced 12 impacts that could be affected by raising the HGV limit on single carriageway roads. Respondents were asked how they thought these impacts might change if the HGV limit on single carriageway roads was increased.
Respondents were invited to tick as many impacts as applied to them, so the base size shown for each varies - these are shown in brackets after each impact. The results are shown in Figure 8.

12,220 respondents provided an answer for at least one of the stated impacts in this question. Not every respondent provided a response for each impact, so percentages are calculated based on the number of responses received for each impact.
(Following the consultation launch on 27 November 2024, feedback on the design of this question was received through the consultation. As a result of this feedback, the questionnaire was updated on 9 December 2024 at 14:40 to include a “no change” option to ensure respondent views were captured as accurately as possible. Figure 8 shows responses received after the change to this question. Responses received prior to this change can be viewed in Appendix I.)
The breakdown of responses per impact, including the base size of respondents who answered the question in brackets, is:
Impact on driver frustration (12,169)
16% of respondents (1,995) - “makes a lot worse”
7% of respondents (797) “worsens slightly”
14% of respondents (1,708) - “no change”
27% of respondents (3,273) - “improves slightly”
29% of respondents (3,527) - “improves a lot”
7% of respondents (869) - “unsure”.
Impact on journey time (12,168):
11% of respondents (1,283) - “makes a lot worse”
7% of respondents (811) “worsens slightly”
18% of respondents (2,169) - “no change”
35% of respondents (4,253) - “improves slightly”
22% of respondents (2,689) - “improves a lot”
8% of respondents (963) - “unsure”
Impact on climate change (12,148)
8% of respondents (914) - “makes a lot worse”
11% of respondents (1,380) - “worsens slightly”
53% of respondents (6,460) - “no change”
9% of respondents (1,090) - “improves slightly”
5% of respondents (654) - “improves a lot”
14% of respondents (1,650) - “unsure”
Impact on noise (12,161)
9% of respondents (1,068) “makes a lot worse”
14% of respondents (1,644) - “worsens slightly”
56% of respondents (6,851) - “no change”
6% of respondents (775) - “improves slightly”
5% of respondents (572) - “improves a lot”
10% of respondents (1,251) - “unsure”.
Impact on air pollution (12,162)
8% of respondents (1,023) - “makes a lot worse”
13% of respondents (1,608) - “worsens slightly”
48% of respondents (5,869) - “no change”
10% of respondents (1,277) - “improves slightly”
6% of respondents (717) “improves a lot”
14% of respondents (1,668) - “unsure”
Impact on quality of life (12,158)
10% of respondents (1,183) - “makes a lot worse”
11% of respondents (1,297) - “worsens slightly”
40% of respondents (4,916) - “no change”
18% of respondents (2,185) - “improves slightly”
11% of respondents (1,355) - “improves a lot”
10% of respondents (1,222) - “unsure”
Impact on motorcycle safety (12,164)
11% of respondents (1,342) - “makes a lot worse”
13% of respondents (1,551) - “worsens slightly”
53% of respondents (6,402) - “no change”
9% of respondents (1,058) - “improves slightly”
6% of respondents (771) - “improves a lot”
9% of respondents (1,040) - “unsure”
Impact on horse rider safety (12,174):
12% of respondents (1,511) - “makes a lot worse”
15% of respondents (1,767) - “worsens slightly”
53% of respondents (6,392) - “no change”
5% of respondents (548) “improves slightly”
4% of respondents (500) - “improves a lot”
12% of respondents (1,456) - “unsure”
Impact on cyclist safety (12,168)
12% of respondents (1,465) - “makes a lot worse”
15% of respondents (1,845) - “worsens slightly”
53% of respondents (6,401) - “no change”
5% of respondents (667) “improves slightly”
5% of respondents (553) - “improves a lot”
10% of respondents (1,237) - “unsure”
Impact on pedestrian safety (12,181)
11% of respondents (1,288) - “makes a lot worse”
13% of respondents (1,637) - “worsens slightly”
56% of respondents (6,806) - “no change”
5% of respondents (640) - “improves slightly”
4% of respondents (539) - “improves a lot”
10% of respondents (1,271) - “unsure”
Impact on serious collisions (12,184)
11% of respondents (1,351) - “makes a lot worse”
16% of respondents (2,028) - “worsens slightly”
41% of respondents (5,053) - “no change”
13% of respondents (1,538) - “improves slightly”
8% of respondents (988) - “improves a lot”
10% of respondents (1,226) - “unsure”
Impact on fatal collisions (12,204)
11% of respondents (1,290) - “makes a lot worse”
16% of respondents (1,978) - “worsens slightly”
40% of respondents (4,870) - “no change”
14% of respondents (1,757) - “improves slightly”
9% of respondents (1,106) - “improves a lot”
10% of respondents (1,203) - “unsure”
Of the 12,220 respondents who provided an answer for at least one of the stated impacts in this question, 105 were organisations.
Of these organisational responses, the breakdown of responses per impact, including the base size of respondents who answered the question in brackets, is:
Impact on driver frustration (104)
13% of respondents (13) - “makes a lot worse”
2% of respondents (2) - “worsens slightly”
8% of respondents (8) - “no change”
29% of respondents (30) - “improves slightly”
37% of respondents (38) - “improves a lot”
13% of respondents (13) - “unsure”.
Impact on journey time (104):
9% of respondents (9) - “makes a lot worse”
5% of respondents (5) - “worsens slightly”
8% of respondents (8) - “no change”
38% of respondents (39) - “improves slightly”
32% of respondents (33) - “improves a lot”
10% of respondents (10) - “unsure”
Impact on climate change (104)
13% of respondents (13) “makes a lot worse”
14% of respondents (15) - “worsens slightly”
40% of respondents (42) - “no change”
12% of respondents (12) - “improves slightly”
9% of respondents (9) - “improves a lot”
13% of respondents (13) - “unsure”
Impact on noise (103)
14% of respondents (14) “makes a lot worse”
20% of respondents (21) - “worsens slightly”
44% of respondents (45) - “no change”
7% of respondents (7) - “improves slightly”
8% of respondents (8) - “improves a lot”
8% of respondents (8) - “unsure”.
Impact on air pollution (104)
13% of respondents (13) - “makes a lot worse”
16% of respondents (17) - “worsens slightly”
39% of respondents (41) - “no change”
11% of respondents (11) - “improves slightly”
10% of respondents (10) - “improves a lot”
12% of respondents (12) - “unsure”
Impact on quality of life (103)
15% of respondents (15) - “makes a lot worse”
12% of respondents (12) - “worsens slightly”
29% of respondents (30) - “no change”
14% of respondents (14) - “improves slightly”
18% of respondents (19) - “improves a lot”
13% of respondents (13) - “unsure”
Impact on motorcycle safety (104)
19% of respondents (20) - “makes a lot worse”
11% of respondents (11) - “worsens slightly”
45% of respondents (47) - “no change”
10% of respondents (10) - “improves slightly”
9% of respondents (9) - “improves a lot”
7% of respondents (7) - “unsure”
Impact on horse rider safety (105):
21% of respondents (22) - “makes a lot worse”
12% of respondents (13) - “worsens slightly”
51% of respondents (54) - “no change”
5% of respondents (5) - “improves slightly”
6% of respondents (6) - “improves a lot”
5% of respondents (5) - “unsure”
Impact on cyclist safety (104)
21% of respondents (22) - “makes a lot worse”
11% of respondents (11) - “worsens slightly”
50% of respondents (52) - “no change”
7% of respondents (7) - “improves slightly”
6% of respondents (6) - “improves a lot”
6% of respondents (6) - “unsure”
Impact on pedestrian safety (105)
19% of respondents (20) - “makes a lot worse”
11% of respondents (12) - “worsens slightly”
50% of respondents (53) - “no change”
4% of respondents (4) - “improves slightly”
8% of respondents (8) - “improves a lot”
8% of respondents (8) - “unsure”
Impact on serious collisions (105)
19% of respondents (20) - “makes a lot worse”
12% of respondents (13) - “worsens slightly”
36% of respondents (38) - “no change”
11% of respondents (12) - “improves slightly”
12% of respondents (13) - “improves a lot”
9% of respondents (9) - “unsure”
Impact on fatal collisions (104)
17% of respondents (18) - “makes a lot worse”
13% of respondents (14) - “worsens slightly”
32% of respondents (33) - “no change”
13% of respondents (13) - “improves slightly”
15% of respondents (16) - “improves a lot”
10% of respondents (10) - “unsure”
Question 11 introduced 12 impacts that could be affected by raising the HGV limit on dual carriageway roads. Respondents were asked how they thought these impacts might change if the HGV limit on dual carriageway roads was increased.
12,157 respondents provided an answer for at least one of the stated impacts in this question. Not every respondent provided a response for every impact, so percentages are calculated based on number of responses received for each impact. The results are shown in Figure 9.
(Following the consultation launch on 27 November 2024, feedback on the design of this question was received through the consultation. As a result of this feedback, the questionnaire was updated on 9 December 2024 at 14:40 to include a “no change” option to ensure respondent views were captured as accurately as possible. Figure 9 shows responses received after the change to this question. Responses received prior to this change can be viewed in Appendix I.)

The breakdown of responses per impact, including the base size of respondents who answered the question in brackets, is:
Impact on driver frustration (12,079)
12% of respondents (1,439) - “makes a lot worse”
6% of respondents (711) “worsens slightly”
18% of respondents (2,172) - “no change”
27% of respondents (3,283) - “improves slightly”
30% of respondents (3,591) - “improves a lot”
7% of respondents (883) - “unsure”
Impact on journey time (12,104)
8% of respondents (995) “makes a lot worse”
5% of respondents (635) “worsens slightly”
20% of respondents (2,389) - “no change”
35% of respondents (4,265) - “improves slightly”
24% of respondents (2,903) - “improves a lot”
8% of respondents (917) - “unsure”
Impact on climate change (12,070)
7% of respondents (829) - “makes a lot worse”
10% of respondents (1,221) - “worsens slightly”
54% of respondents (6,497) - “no change”
9% of respondents (1,105) - “improves slightly”
6% of respondents (767) - “improves a lot”
14% of respondents (1,651) - “unsure”
Impact on noise (12,081)
7% of respondents (889) “makes a lot worse”
12% of respondents (1,507) - “worsens slightly”
58% of respondents (6,983) - “no change”
6% of respondents (777) - “improves slightly”
6% of respondents (672) - “improves a lot”
10% of respondents (1,253) - “unsure”
Impact on air pollution (12,087)
7% of respondents (850) “makes a lot worse”
12% of respondents (1,396) - “worsens slightly”
51% of respondents (6,189) - “no change”
10% of respondents (1,264) - “improves slightly”
7% of respondents (802) - “improves a lot”
13% of respondents (1,586) - “unsure”
Impact on quality of life (12,064)
8% of respondents (938) “makes a lot worse”
7% of respondents (875) “worsens slightly”
43% of respondents (5,189) - “no change”
19% of respondents (2,260) - “improves slightly”
13% of respondents (1,596) - “improves a lot”
10% of respondents (1,206) - “unsure”
Impact on motorcycle safety (12,094)
9% of respondents (1,101) - “makes a lot worse”
11% of respondents (1,307) - “worsens slightly”
56% of respondents (6,778) - “no change”
9% of respondents (1,031) - “improves slightly”
7% of respondents (833) - “improves a lot”
9% of respondents (1,044) - “unsure”
Impact on horse rider safety (12,066)
9% of respondents (1,129) - “makes a lot worse”
9% of respondents (1,145) - “worsens slightly”
62% of respondents (7,450) - “no change”
4% of respondents (453) “improves slightly”
4% of respondents (533) - “improves a lot”
11% of respondents (1,356) - “unsure”
Impact on cyclist safety (12,075)
9% of respondents (1,123) - “makes a lot worse”
11% of respondents (1,278) - “worsens slightly”
61% of respondents (7,409) - “no change”
4% of respondents (541) “improves slightly”
5% of respondents (580) - “improves a lot”
9% of respondents (1,144) - “unsure”
Impact on pedestrian safety (12,092)
8% of respondents (1,015) - “makes a lot worse”
9% of respondents (1,126) - “worsens slightly”
63% of respondents (7,664) - “no change”
4% of respondents (537) “improves slightly”
5% of respondents (606) - “improves a lot”
9% of respondents (1,144) - “unsure”
Impact on serious collisions (12,106)
9% of respondents (1,118) - “makes a lot worse”
14% of respondents (1,730) - “worsens slightly”
48% of respondents (5,799) - “no change”
11% of respondents (1,376) - “improves slightly”
8% of respondents (978) - “improves a lot”
9% of respondents (1,105) - “unsure”
Impact on fatal collisions (12,142):
9% of respondents (1,079) - “makes a lot worse”
14% of respondents (1,658) - “worsens slightly”
48% of respondents (5,770) - “no change”
12% of respondents (1,488) - “improves slightly”
9% of respondents (1,052) - “improves a lot”
9% of respondents (1,095) - “unsure”
Of the 12,157 respondents who provided an answer for at least one of the stated impacts in this question, 103 were organisations.
Of the organisational responses, the breakdown of responses per impact, including the base size of respondents who answered the question in brackets, is:
Impact on driver frustration (102)
7% of respondents (7) - “makes a lot worse”
4% of respondents (4) “worsens slightly”
10% of respondents (10) - “no change”
33% of respondents (34) - “improves slightly”
33% of respondents (34) - “improves a lot”
13% of respondents (13) - “unsure”
Impact on journey time (103)
5% of respondents (5) - “makes a lot worse”
6% of respondents (6) - “worsens slightly”
8% of respondents (8) - “no change”
42% of respondents (43) - “improves slightly”
29% of respondents (30) - “improves a lot”
11% of respondents (11) - “unsure”
Impact on climate change (102)
15% of respondents (15) “makes a lot worse”
7% of respondents (7) - “worsens slightly”
47% of respondents (48) - “no change”
12% of respondents (12) - “improves slightly”
6% of respondents (6) - “improves a lot”
14% of respondents (14) - “unsure”
Impact on noise (103)
14% of respondents (14) “makes a lot worse”
18% of respondents (19) - “worsens slightly”
47% of respondents (48) - “no change”
7% of respondents (7) - “improves slightly”
5% of respondents (5) - “improves a lot”
10% of respondents (10) - “unsure”
Impact on air pollution (102)
14% of respondents (14) - “makes a lot worse”
10% of respondents (10) - “worsens slightly”
46% of respondents (47) - “no change”
12% of respondents (12) - “improves slightly”
6% of respondents (6) - “improves a lot”
13% of respondents (13) - “unsure”
Impact on quality of life (103)
15% of respondents (15) “makes a lot worse”
7% of respondents (7) “worsens slightly”
32% of respondents (33) - “no change”
14% of respondents (14) - “improves slightly”
19% of respondents (20) - “improves a lot”
14% of respondents (14) - “unsure”
Impact on motorcycle safety (103)
17% of respondents (17) - “makes a lot worse”
12% of respondents (12) - “worsens slightly”
48% of respondents (49) - “no change”
11% of respondents (11) - “improves slightly”
8% of respondents (8) - “improves a lot”
6% of respondents (6) - “unsure”
Impact on horse rider safety (101)
14% of respondents (14) - “makes a lot worse”
10% of respondents (10) - “worsens slightly”
61% of respondents (62) - “no change”
5% of respondents (5) “improves slightly”
3% of respondents (3) - “improves a lot”
7% of respondents (7) - “unsure”
Impact on cyclist safety (102)
15% of respondents (15) - “makes a lot worse”
11% of respondents (11) - “worsens slightly”
58% of respondents (59) - “no change”
7% of respondents (7) - “improves slightly”
4% of respondents (4) - “improves a lot”
6% of respondents (6) - “unsure”
Impact on pedestrian safety (102)
16% of respondents (16) - “makes a lot worse”
7% of respondents (7) - “worsens slightly”
58% of respondents (59) - “no change”
9% of respondents (9) - “improves slightly”
5% of respondents (5) - “improves a lot”
6% of respondents (6) “unsure”
Impact on serious collisions (102)
19% of respondents (19) - “makes a lot worse”
11% of respondents (11) - “worsens slightly”
39% of respondents (40) - “no change”
9% of respondents (9) - “improves slightly”
13% of respondents (13) - “improves a lot”
10% of respondents (10) - “unsure”
Impact on fatal collisions (103):
19% of respondents (20) - “makes a lot worse”
9% of respondents (9) - “worsens slightly”
40% of respondents (41) - “no change”
9% of respondents (9) - “improves slightly”
13% of respondents (13) - “improves a lot”
11% of respondents (11) - “unsure”
Question 12 was an open text box. It asked respondents to comment if they thought any impacts were missing from those outlined in the previous Questions 10 and 11.
5,156 respondents provided a free text responses to this question. Most respondents used this open text box to comment on the proposals in general, as opposed to specifically answering the stated question, therefore responses were coded according to more general themes. Many respondents used this question to comment further on the themes already outlined in Question 7.
Table 3 provides a breakdown of the thematic codes that were applied across the content of this question. Open text feedback can be wide ranging, ambiguous and cover multiple topics within one response. There is always a level of subjectivity in interpretation of free text comments. Subjective interpretation was mitigated as far as possible through the following steps:
- Robust, thematic code frame with guidance to assist coders
- Real-time peer review for complex responses
- Quality Assurance process with ongoing feedback and training to coders
For easier interpretation, thematic codes are grouped within high-level themes, highlighted in light blue in Table 3. Where appropriate, supplementary context has been added to the themes.
Table 3: Are there any impacts that an increase in the national speed limit for goods vehicles exceeding 7.5 tonnes on single and dual carriageways that have been missed? If so, please detail below.
The feedback to this question is provided in order of theme frequency.
Table 3a. Road safety theme
|
Sub theme |
Sub theme total |
|---|---|
|
Increasing HGV limit would increase driver frustration |
391 |
|
Drivers would not comply with change in speed limits |
363 |
|
Increasing HGV limit would increase collisions |
330 |
|
Increasing HGV limit would increase stopping distance |
221 |
|
Perception that non-motorised users are not frequent users of dual (and single) carriageways |
215 |
|
Lowering national speed limit would increase driver frustration |
156 |
|
Modern vehicles are safe travelling at higher speeds |
154 |
|
Increasing HGV limit would have no impact on safety / collisions |
65 |
|
HGV drivers have higher skill level |
62 |
|
More consideration should be given to different vehicle classes |
59 |
|
Increasing HGV limit would negatively impact safety of non-motorised users |
56 |
|
Increasing HGV limit would decrease collisions |
48 |
|
Increasing HGV limit would increase collisions |
31 |
|
Comments about cyclist behaviour and safety |
22 |
|
Proposals would have no impact on non-motorised user safety |
16 |
|
Increasing HGV speed limit could increase wear and damage to HGV vehicles |
15 |
|
Lowering national speed limit would have no impact on collisions |
13 |
|
Comments about pedestrian behaviour and safety |
13 |
|
Lowering national speed limit would reduce concentration and lead to fatigue |
12 |
|
Lowering national speed limit would increase collisions |
10 |
|
Road worthiness of vehicles |
9 |
|
Lowering national speed limit would have positive impact on driver behaviour |
5 |
|
Lowering national speed limit would decrease collisions |
3 |
|
Lowering national speed limit could increase wear and damage to cars |
1 |
|
Road safety |
3,127 total |
Table 3b. Traffic and transport theme
Sub theme
|
Sub theme total |
|
|---|---|
|
Increasing HGV limit would positively impact journey times |
348 |
|
Speed limits should be bespoke to specific road design and conditions |
174 |
|
Increasing HGV limit could cause more wear on roads |
111 |
|
Speed limits should be consistent across the UK |
92 |
|
Suggestion to improve road infrastructure / design |
76 |
|
Increasing HGV limit would negatively impact journey times |
70 |
|
Lowering the national speed limit would negatively impact journey times |
33 |
|
Suggestion for road infrastructure or rules for HGVs travelling at higher speeds |
29 |
|
Suggestion to reduce amount of freight transported by road |
29 |
|
Lowering national speed limit would negatively impact journey times for businesses |
20 |
|
Suggestion to improve signage on roads |
11 |
|
Public transport in rural areas is lacking as an alternative to driving |
6 |
|
Lowering national speed limit would negatively impact emergency services and response vehicles |
3 |
|
Lowering national speed limit could increase wear on roads |
2 |
|
Lowering national speed limit could decrease wear on roads |
1 |
|
Traffic and transport |
1,005 total |
Table 3c. General theme
|
Sub theme |
Sub theme total |
|---|---|
|
General support for increasing HGV limit |
264 |
|
General opposition to increasing HGV limit |
204 |
|
Criticism of the Scottish Government |
65 |
|
General opposition to reducing the national speed limit |
52 |
|
Scottish Government should direct resources to road maintenance instead |
48 |
|
Scottish Government should dual major roads instead of changing speed limits |
42 |
|
Concern about the cost of implementing the proposals |
24 |
|
Scottish Government should direct resources elsewhere instead |
12 |
|
Scottish Government should invest in improving public transport and dedicated active travel infrastructure instead |
8 |
|
General opposition to reducing the national speed limit |
2 |
|
General |
721 total |
Table 3d. Enforcement theme
|
Sub theme |
Sub theme total |
|---|---|
|
Suggest alternative speed limit proposal |
112 |
|
Concern that key issue is a minority of dangerous drivers, not the speed limit itself |
86 |
|
Suggestion relating to driver education |
54 |
|
Increased police presence would be necessary to enforce change in speed limits |
38 |
|
Comments relating to vehicle technology |
30 |
|
Increase enforcement (non-specific suggestion) |
21 |
|
Suggestion for tougher penalties for speeding and dangerous driving |
19 |
|
More speed cameras would be needed to enforce a lowered national speed limit |
13 |
|
Reducing the national speed limit would be difficult to enforce |
5 |
|
Suggestion relating to promotion of good driving practice |
2 |
|
Suggestions relating to insurance or financial incentives |
2 |
|
Decrease enforcement (non-specific suggestion) |
1 |
|
Suggestion to remove speed cameras |
1 |
|
Enforcement |
385 total |
Table 3e. Consultation theme
|
Sub theme |
Sub theme total |
|---|---|
|
Criticism of the survey questions |
143 |
|
Criticism of the evidence provided for the proposals |
70 |
|
Request for further information on the proposals |
30 |
|
General criticism of consultation |
21 |
|
Criticism of the consultation as having a predetermined outcome |
18 |
|
Criticism of the consultation materials |
10 |
|
Positive feedback on the consultation process |
4 |
|
Criticism of consultation events |
1 |
|
Consultation |
297 total |
Table 3f. Environment theme
|
Sub theme |
Sub theme total |
|---|---|
|
Increasing HGV limit would lead to increase in fuel efficiency / positive climate change impact |
66 |
|
Increasing HGV limit would lead to decrease in fuel efficiency / negative climate change impact |
64 |
|
Increasing HGV limit would improve air quality |
22 |
|
Increasing HGV limit would lead to more noise |
22 |
|
Reducing national speed limit would lead to decrease in fuel efficiency / negative climate change impact |
13 |
|
Increasing HGV limit would have no impact on climate change |
11 |
|
Increasing HGV limit would worsen air quality |
10 |
|
Increasing HGV limit would lead to less noise |
9 |
|
Reducing national speed limit would worsen air quality |
5 |
|
Other suggestions relating to climate change |
5 |
|
Proposals will have no impact on noise |
3 |
|
Reducing national speed limit would have no impact on air quality |
2 |
|
Reducing national speed limit would have no impact on climate change |
2 |
|
Reducing national speed limit would lead to less noise |
2 |
|
Reducing national speed limit would lead to more noise |
2 |
|
Reducing national speed limit would lead to increase in fuel efficiency / positive climate change impact |
1 |
|
Environment |
239 total |
Table 3g. Socioeconomic theme
|
Sub theme |
Sub theme total |
|---|---|
|
Increasing HGV limit would positively impact Scotland's economy |
158 |
|
Proposals would positively impact quality of life |
24 |
|
Proposals would negatively impact quality of life |
20 |
|
Concern about driving ability of non-locals |
18 |
|
Reducing national speed limit would have a disproportionate impact on people who need to travel long distances |
17 |
|
Reducing national speed limit would negatively impact Scotland's economy |
13 |
|
Reducing national speed limit would have negative impact on tourism |
2 |
|
Socioeconomic |
252 total |
Question 13 was an open text box. It asked respondents to comment if they thought any impacts outlined in the previous Question 7 were incorrect.
3,645 respondents provided a free text response to this question. Most respondents used this open text box to comment on the proposals in general, as opposed to specifically answering the stated question, therefore responses were coded according to more general themes. Many respondents used this question to comment further on the themes already outlined in Question 7.
Table 4 provides a breakdown of the thematic codes that were applied across the content of this question. Open text feedback can be wide ranging, ambiguous and cover multiple topics within one response. There is always a level of subjectivity in interpretation of free text comments.
For easier interpretation, thematic codes are grouped within high-level themes, highlighted in light blue in Table 4. Where appropriate, supplementary context has been added to the themes.
Table 4: Are there any impacts that an increase in the speed limit for goods vehicles exceeding 7.5 tonnes on single and dual carriageways that you consider to be incorrect? Please provide as much detail and evidence as you can to support this
The feedback to this question is provided in order of theme frequency.
Table 4a. Road safety theme
|
Sub theme |
Sub theme total |
|---|---|
|
Increasing HGV limit would result in reduced need to overtake |
252 |
|
Perception that non-motorised users are not frequent users of dual (and single) carriageways |
246 |
|
Increasing HGV limit would increase collisions |
203 |
|
Drivers would not comply with change in speed limits |
181 |
|
Increasing HGV limit would increase driver frustration |
166 |
|
Increasing HGV limit would increase stopping distance |
88 |
|
Lowering national speed limit would increase driver frustration |
80 |
|
Modern vehicles are safe travelling at higher speeds |
79 |
|
Increasing HGV limit would have no impact on safety / collisions |
65 |
|
HGV drivers have higher skill level |
36 |
|
Increasing HGV limit would decrease collisions |
29 |
|
More consideration should be given to different vehicle classes |
28 |
|
Increasing HGV limit would negatively impact safety of non-motorised users |
23 |
|
Comments about cyclist behaviour and safety |
21 |
|
Proposals would have no impact on non-motorised user safety |
18 |
|
Lowering national speed limit would increase collisions |
14 |
|
Comments about pedestrian behaviour and safety |
13 |
|
Increasing HGV limit will increase concentration |
9 |
|
Lowering national speed limit would reduce concentration and lead to fatigue |
9 |
|
Road worthiness of vehicles |
9 |
|
Lowering national speed limit would have no impact on collisions |
7 |
|
Increasing HGV speed limit could increase wear and damage to HGV vehicles |
4 |
|
Lowering national speed limit would have positive impact on driver behaviour |
4 |
|
Lowering national speed limit would positively impact non-motorised users |
1 |
|
Road safety |
1,585 total |
Table 4b. General theme
|
Sub theme |
Sub theme total |
|---|---|
|
General support for increasing HGV limit |
157 |
|
General opposition to increasing HGV limit |
140 |
|
Criticism of the Scottish Government |
61 |
|
Scottish Government should direct resources to road maintenance instead |
43 |
|
General opposition to reducing the national speed limit |
37 |
|
Scottish Government should dual major roads instead of changing speed limits |
31 |
|
Concern about the cost of implementing the proposals |
10 |
|
Scottish Government should direct resources elsewhere instead |
7 |
|
Scottish Government should invest in improving public transport and dedicated active travel infrastructure instead |
3 |
|
General |
489 total |
Table 4c. Traffic and transport theme
|
Sub theme |
Sub theme total |
|---|---|
|
Increasing HGV limit would positively impact journey times |
105 |
|
Speed limits should be bespoke to specific road design and conditions |
100 |
|
Suggestion to improve road infrastructure / design |
51 |
|
Increasing HGV limit would negatively impact journey times |
39 |
|
Speed limits should be consistent across the UK |
36 |
|
Increasing HGV limit could cause more wear on roads |
29 |
|
Suggestion for road infrastructure or rules for HGVs travelling at higher speeds |
20 |
|
Lowering the national speed limit would negatively impact journey times |
16 |
|
Suggestion to reduce amount of freight transported by road |
16 |
|
Suggestion to improve signage on roads |
7 |
|
Public transport in rural areas is lacking as an alternative to driving |
5 |
|
Lowering national speed limit would negatively impact journey times for businesses |
4 |
|
Lowering national speed limit would have no impact on journey times |
2 |
|
Reducing national speed limit could reduce wear on roads |
2 |
|
Lowering national speed limit could increase wear on roads |
1 |
|
Traffic and transport |
433 total |
Table 4d. Consultation theme
|
Sub theme |
Sub theme total |
|---|---|
|
Criticism of the survey questions |
141 |
|
Criticism of the evidence provided for the proposals |
108 |
|
Request for further information on the proposals |
19 |
|
General criticism of consultation |
16 |
|
Criticism of the consultation as having a predetermined outcome |
11 |
|
Criticism of the consultation materials |
10 |
|
Consultation |
305 total |
Table 4e. Enforcement theme
|
Sub theme |
Sub theme total |
|---|---|
|
Suggest alternative speed limit proposal |
75 |
|
Concern that key issue is a minority of dangerous drivers, not the speed limit itself |
67 |
|
Suggestion relating to driver education |
43 |
|
Increased police presence would be necessary to enforce change in speed limits |
24 |
|
Comments relating to vehicle technology |
20 |
|
Increase enforcement (non-specific suggestion) |
13 |
|
Suggestion for tougher penalties for speeding and dangerous driving |
13 |
|
More speed cameras would be needed to enforce a lowered national speed limit |
9 |
|
Reducing the national speed limit would be difficult to enforce |
6 |
|
Suggestion relating to promotion of good driving practice |
2 |
|
Decrease enforcement (non-specific suggestion) |
1 |
|
Suggestion to remove speed cameras |
1 |
|
Suggestions relating to insurance or financial incentives |
1 |
|
Enforcement |
276 total |
Table 4f. Environment theme
|
Sub theme |
Sub theme total |
|---|---|
|
Increasing HGV limit would lead to decrease in fuel efficiency / negative climate change impact |
37 |
|
Increasing HGV limit would have no impact on climate change |
34 |
|
Increasing HGV limit would lead to increase in fuel efficiency / positive climate change impact |
30 |
|
Increasing HGV limit would worsen air quality |
16 |
|
Increasing HGV limit would lead to more noise |
14 |
|
Reducing NSL would lead to decrease in fuel efficiency / negative climate change impact |
11 |
|
Increasing HGV limit would improve air quality |
9 |
|
Increasing HGV limit would lead to less noise |
8 |
|
Reducing NSL would have no impact on climate change |
7 |
|
Reducing NSL would worsen air quality |
7 |
|
Proposals will have no impact on noise |
4 |
|
Other suggestions relating to climate change |
4 |
|
Reducing NSL would have no impact on air quality |
3 |
|
Reducing NSL would improve air quality |
1 |
|
Reducing NSL would lead to increased fuel efficiency |
1 |
|
Reducing NSL would lead to more noise |
1 |
|
Environment |
187 total |
Table 4g. Socioeconomic theme
|
Sub theme |
Sub theme total |
|---|---|
|
Increasing HGV limit would positively impact Scotland's economy |
33 |
|
Reducing national speed limit would have a disproportionate impact on people who need to travel long distances |
13 |
|
Concern about driving ability of non-locals |
8 |
|
Proposals would positively impact quality of life |
7 |
|
Reducing national speed limit would negatively impact Scotland's economy |
7 |
|
Proposals would have no impact on quality of life |
3 |
|
Proposals would negatively impact quality of life |
3 |
|
Reducing national speed limit would have negative impact on tourism |
3 |
|
Socioeconomic |
77 total |
Speed Enforcement and Speed Limit Compliance
Question 14 asked respondents if they thought that motorists generally comply with the current national speed limit on single carriageway roads. 19,515 respondents provided a valid response to this question. The results are shown in Figure 10.

As shown in Figure 10, 80% of respondents (15,610) thought motorists generally comply with the current national speed limit most of the time. 18% of respondents thought motorists rarely comply with the current national speed limit (3,428) and 2% of respondents (377) thought motorists always comply. 1% of respondents (100) were unsure.
Of those that responded to this question (19,515), 132 responded as organisations. Of these organisations, 72% (95) thought motorists generally comply with the current national speed limit most of the time. 20% of respondents thought motorists rarely comply with the current national speed limit (27) and 5% of respondents (6) thought motorists always comply. 3% of respondents (4) were unsure.
Question 15 asked respondents whether current speed enforcement measures should remain in place for road safety if the national speed limit on single carriageways was reduced. 19,392 respondents provided a valid response to this question. The results are shown in Figure 11.

As shown in Figure 11, 51% of respondents (9,794) thought current speed enforcement measures should not remain in place if the national speed limit was reduced. 34% of respondents (6,680) thought current enforcement measures should be maintained, and 15% of respondents (2,918) were unsure.
Of those that responded to this question (19,392), 135 responded as organisations. Of these organisations, 41% (56) thought current speed enforcement measures should not remain in place if the national speed limit was reduced. 50% of respondents (67) thought current enforcement measures should be maintained, and 9% of respondents (12) were unsure.
Question 16 was an open question and asked respondents what additional measures they thought the Scottish Government could take to encourage compliance with a lower national speed limit on single carriageway roads.
11,633 respondents responded to this question. Most respondents commented more freely on the proposals, rather than specifically answering the stated question.
Table 5: What additional measures could the Scottish Government take to encourage compliance with a lower national speed limit on single carriageways? Please detail below.
The feedback to this question is provided in order of theme frequency.
Table 5a. Enforcement theme
|
Sub theme |
Sub theme total |
|---|---|
|
Increased police presence would be necessary to enforce change in speed limits |
1,436 |
|
More speed cameras would be needed to enforce a lowered national speed limit |
1,035 |
|
Suggestion relating to driver education |
891 |
|
Suggest alternative speed limit proposal |
499 |
|
Suggestion for tougher penalties for speeding and dangerous driving |
496 |
|
Concern that key issue is a minority of dangerous drivers, not the speed limit itself |
462 |
|
Increase enforcement (non-specific suggestion) |
404 |
|
Reducing the national speed limit would be difficult to enforce |
296 |
|
Suggestion relating to promotion of good driving practice |
232 |
|
Comments relating to vehicle technology |
169 |
|
Suggestions relating to insurance or financial incentives |
130 |
|
Suggestion to remove speed cameras |
129 |
|
Decrease enforcement (non-specific suggestion) |
50 |
|
Enforcement |
6,814 total |
Table 5b. General theme
|
Sub theme |
Sub theme total |
|---|---|
|
General opposition to reducing the national speed limit |
2814 |
|
Criticism of the Scottish Government |
998 |
|
Scottish Government should direct resources to road maintenance instead |
678 |
|
Scottish Government should dual major roads instead of changing speed limits |
504 |
|
Scottish Government should direct resources elsewhere instead |
281 |
|
Concern about the cost of implementing the proposals |
197 |
|
Scottish Government should invest in improving public transport and dedicated active travel infrastructure instead |
74 |
|
General support for increasing HGV limit |
60 |
|
General opposition to increasing HGV limit |
28 |
|
General support for reducing the national speed limit |
13 |
|
General |
5,647 total |
Table 5c. Road Safety theme
|
Sub theme |
Sub theme total |
|---|---|
|
Drivers would not comply with change in speed limits |
787 |
|
Lowering national speed limit would increase driver frustration |
693 |
|
Modern vehicles are safe travelling at higher speeds |
263 |
|
Lowering national speed limit would increase collisions |
89 |
|
Lowering national speed limit would have no impact on collisions |
86 |
|
Comments about cyclist behaviour and safety |
56 |
|
Lowering national speed limit would reduce concentration and lead to fatigue |
52 |
|
More consideration should be given to different vehicle classes |
29 |
|
Comments about pedestrian behaviour and safety |
25 |
|
Increasing HGV limit would result in reduced need to overtake |
23 |
|
Road worthiness of vehicles |
18 |
|
Perception that non-motorised users are not frequent users of dual (and single) carriageways |
17 |
|
Increasing HGV limit would increase collisions |
10 |
|
Increasing HGV limit would increase driver frustration |
8 |
|
HGV drivers have higher skill level |
3 |
|
Lowering national speed limit would decrease collisions |
3 |
|
Proposals would have no impact on non-motorised user safety |
3 |
|
Increasing HGV limit would have no impact on safety / collisions |
2 |
|
Increasing HGV limit would increase stopping distance |
2 |
|
Lowering national speed limit could increase wear and damage to cars |
2 |
|
Lowering national speed limit would have positive impact on driver behaviour |
2 |
|
Increasing HGV limit would decrease collisions |
1 |
|
Increasing HGV limit would increase concentration |
1 |
|
Increasing HGV limit would negatively impact safety of non-motorised users |
1 |
|
Road safety |
2,176 total |
Table 5d. Traffic and transport theme
|
Sub theme |
Sub theme total |
|---|---|
|
Speed limits should be bespoke to specific road design and conditions |
542 |
|
Suggestion to improve road infrastructure / design |
507 |
|
Suggestion to improve signage on roads |
237 |
|
Lowering the national speed limit would negatively impact journey times |
146 |
|
Public transport in rural areas is lacking as an alternative to driving |
100 |
|
Speed limits should be consistent across the UK |
59 |
|
Suggestion for road infrastructure or rules for HGVs travelling at higher speeds |
20 |
|
Lowering national speed limit would negatively impact journey times for businesses |
17 |
|
Suggestion to reduce amount of freight transported by road |
7 |
|
Increasing HGV limit would positively impact journey times |
6 |
|
Lowering national speed limit would negatively impact emergency services and response vehicles |
6 |
|
Reducing national speed limit could reduce wear on roads |
3 |
|
Lowering national speed limit would have no impact on journey times |
1 |
|
Traffic and transport |
1,651 total |
Table 5e. Consultation theme
|
Sub theme |
Sub theme total |
|---|---|
|
Criticism of the consultation as having a predetermined outcome |
162 |
|
Criticism of the evidence provided for the proposals |
125 |
|
Criticism of the survey questions |
115 |
|
General criticism of consultation |
59 |
|
Request for further information on the proposals |
38 |
|
Criticism of the consultation materials |
11 |
|
Criticism of the consultation promotion |
7 |
|
Criticism of the consultation events |
1 |
|
Consultation |
518 total |
Table 5f. Socioeconomic theme
|
Sub theme |
Sub theme total |
|---|---|
|
Reducing national speed limit would have a disproportionate impact on people who need to travel long distances |
187 |
|
Proposals would negatively impact quality of life |
73 |
|
Concern about driving ability of non-locals |
52 |
|
Reducing national speed limit would negatively impact Scotland's economy |
45 |
|
Reducing national speed limit would have negative impact on tourism |
12 |
|
Increasing HGV limit would positively impact Scotland's economy |
1 |
|
Socioeconomic |
370 total |
Table 5g. Environment theme
|
Sub theme |
Sub theme total |
|---|---|
|
Reducing national speed limit would lead to decrease in fuel efficiency / negative climate change impact |
56 |
|
Reducing national speed limit would worsen air quality |
11 |
|
Reducing national speed limit would have no impact on climate change |
6 |
|
Increasing HGV limit would lead to decrease in fuel efficiency / negative climate change impact |
3 |
|
Reducing national speed limit would lead to increase in fuel efficiency / positive climate change impact |
3 |
|
Reducing national speed limit would have no impact on air quality |
2 |
|
Reducing national speed limit would lead to more noise |
2 |
|
Other suggestions relating to climate change |
2 |
|
Reducing national speed limit would improve air quality |
1 |
|
Environment |
86 total |
Behavioural impact
This section of the questionnaire aimed to understand if a reduction in the national speed limit on single carriageway roads would impact people’s travel behaviours.
Question 17 asked if a reduction in the national speed limit would encourage respondents to use active travel options. 19,499 respondents provided a valid response to this question. The results are shown in Figure 12.

As shown in Figure 12, 90% of respondents were either very unlikely (79%; 15,387) or unlikely (11%; 2,075) to use active travel options if the national speed limit was reduced on single carriageways. 6% of respondents (1,172) were neither likely or unlikely to use active travel options. 2% of respondents (312) were likely, whilst 2% of respondents were very likely (360). 1% of respondents (193) were unsure.
Question 18 asked if a reduction in the national speed limit would affect respondents’ use of public transport options.
12,290 respondents provided a valid response to this question. The results are shown in Figure 13.
(The questionnaire was updated on 9 December 2024 at 14:40 to include an “I don’t use public transport” option to this question. Figure 13 shows the breakdown of responses following this change. The chart showing responses received prior to this change can be viewed in Appendix I)

As shown in Figure 13, 56% of respondents (6,851) don’t use public transport. 26% (3,219) of respondents would use public transport the same amount if the national speed limit on single carriageway roads was reduced. 15% of respondents (1,783) would use public transport less often and 1% (103) would use it more often. 3% of respondents (334) were unsure.
Of the 5,439 respondents who used public transport, 59% (3,219) would use it the same and 33% of respondents (1,783) would use it less often if the national speed limit on single carriageways was reduced, 2% of respondents (103) would use it more often, and 6% (334) were unsure.
Question 19 asked if a reduction in the national speed limit would impact respondents’ driving frequency. 19,499 respondents provided a valid response to this question. The results are shown in Figure 14.

As shown in Figure 14, 85% of respondents (16,566) said that a reduction in the national speed limit on single carriageway roads would not change their driving frequency. 10% (1,977) of respondents would drive more if the national speed limit was reduced. 2% of respondents (476) were unsure and 2% of respondents (448) would drive less under the proposed changes. Less than 1% of respondents (29) don’t drive.
(The questionnaire was updated on 9 December 2024 at 14:40 to include an “I don’t drive” option to this question. Less than 1% of respondents selected this option, so the data for this question has not been split as the additional option did not significantly change the data gathered. All changes made to the questionnaire are recorded in Appendix I. )
About respondents
The final section of the questionnaire asked respondents questions about themselves.
Question 22 asked respondents if they were responding to the consultation as an individual or organisation. The results are shown in Figure 15.

19,535 respondents provided a valid answer to this question. 99% (19,399) of respondents were individuals, and 1% of respondents (136) stated that they were responding on behalf of organisations.
Question 25 asked respondents which age category they were within. 19,360 respondents provided a valid response to this question. The results are shown in Figure 16.

As shown in Figure 16, less than 1% of respondents (65) were aged 18 or under; 1% of respondents (259) were aged between 19 to 21 years old; 16% of respondents (3,018) were aged between 22 to 34 years old; 19% of respondents (3,597) were aged between 35 to 44 years old; 22% of respondents (4,237) were aged between 45 to 54 years old; 13% of respondents (2,603) were aged between 55 to 59 years old and 29% of respondents (5,581) were aged 60 years old or older.
Question 26 asked respondents if they consider themselves to live in an urban or rural location. 19,407 respondents provided a valid response to this question. The results are shown in Figure 17.

As shown in Figure 17, 68% of respondents (13,197) considered themselves to live in a rural area, and 32% of respondents (6,210) in an urban area.
Question 27 asked respondents what mode of transport they most frequently use on single carriageway and dual carriageway roads with a national speed limit.
19,418 respondents provided a valid response to this question. Respondents were permitted to select multiple options to this question. The results are shown in Figure 18.

As shown in Figure 18, 94% of respondents (18,315) selected ‘car driver’
Question 28 asked respondents what their most frequent reason for driving on single and dual carriageway roads is. 19,374 respondents provided a valid response to this question. The results are shown in Figure 19.

As shown in Figure 19, 47% of respondents (9,056) chose “all of the above”. 29% of respondents (5,526) said they use single and dual carriageways most frequently for personal/leisure, 17% of respondents (3,269) selected for commuting to work/education and 8% of respondents (1,459) selected for business. Less than 1% of respondents (64) said that they don’t drive.
5 respondents provided multiple options to this question in the hardcopy version of the questionnaire. These responses were not included in the above graph as the question was not a multiple-choice question.
Question 29 asked respondents what social media platforms they would most likely use to receive road safety information. Respondents were able to choose multiple options in response to this question. 18,642 respondents provided a valid response to this question. The results are shown in Figure 20.

As shown in Figure 20, 52% of respondents (9,677) use Facebook; 40% of respondents (7,526) use no social media platforms to receive road safety information; 11% of respondents (2,029) use Instagram; 11% of respondents (1,994) use X (formerly Twitter); 5% of respondents (912) use TikTok and 4% of respondents (720) use other platforms.
Those who selected the “other” option were able to specify their answer in an open text box.
(Due to a processing error, the open text box related to the “other” option was not initially present in the online questionnaire form. This was added in an update on 9 December 2024 at 14:40. Details of changes to the questionnaire can be viewed in Appendix I.)
Other social media platforms mentioned by respondents included BlueSky and YouTube.
Many respondents also stated they get their road safety information from other non-social media sources, including news outlets, the Government and Scottish Government websites, road safety and navigation apps (AA, RAC, Waze and Google Maps), road safety organisations (IAM and RoSPA), radio and TV.
Unstructured email responses
45 unstructured emails were received as responses to the consultation (20 from organisations and 25 from individuals).
Unstructured email responses were coded using the same code frame developed from the open text data received in response to the structured questionnaire. Table 6 outlines the themes that arose from these responses.
Table 6: themes from coding of unstructured email responses
The feedback to this question is provided in order of theme frequency.
Table 6a. Road safety theme
|
Sub theme |
Sub theme total |
|---|---|
|
Lowering national speed limit would increase driver frustration |
20 |
|
Drivers would not comply with change in speed limits |
13 |
|
Lowering national speed limit would increase collisions |
7 |
|
Increasing HGV limit would result in reduced need to overtake |
7 |
|
Lowering national speed limit would decrease collisions |
7 |
|
Modern vehicles are safe travelling at higher speeds |
6 |
|
Increasing HGV limit would increase driver frustration |
4 |
|
Lowering national speed limit would have no impact on collisions |
4 |
|
Lowering national speed limit would reduce concentration and lead to fatigue |
4 |
|
Increasing HGV limit would have no impact on safety / collisions |
2 |
|
Increasing HGV limit would negatively impact safety of non-motorised users |
2 |
|
Lowering national speed limit would positively impact non-motorised users |
2 |
|
Comments about pedestrian behaviour and safety |
2 |
|
Increasing HGV limit would decrease collisions |
1 |
|
Increasing HGV limit would increase concentration |
1 |
|
Increasing HGV limit would increase stopping distance |
1 |
|
Lowering NSL would increase collisions |
1 |
|
Perception that non-motorised users are not frequent users of dual (and single) carriageways |
1 |
|
Road worthiness of vehicles |
1 |
|
Road safety |
86 total |
Table 6b. Traffic and transport theme
|
Sub theme |
Sub theme total |
|---|---|
|
Speed limits should be bespoke to specific road design and conditions |
22 |
|
Lowering the national speed limit would negatively impact journey times |
11 |
|
Suggestion to improve road infrastructure / design |
7 |
|
Lowering national speed limit would negatively impact journey times for businesses |
6 |
|
Speed limits should be consistent across the UK |
6 |
|
Suggestion to improve signage on roads |
5 |
|
Public transport in rural areas is lacking as an alternative to driving |
4 |
|
Increasing HGV limit would positively impact journey times |
3 |
|
Increasing HGV limit could cause more wear on roads |
1 |
|
Increasing HGV limit would negatively impact journey times |
1 |
|
Lowering national speed limit would negatively impact emergency services and response vehicles |
1 |
|
Suggestion to reduce amount of freight transported by road |
1 |
|
Traffic and transport |
68 total |
Table 6c. Enforcement theme
|
Sub theme |
Sub theme total |
|---|---|
|
Suggestion relating to driver education |
14 |
|
Concern that key issue is a minority of dangerous drivers, not the speed limit itself |
10 |
|
Decrease enforcement (non-specific suggestion) |
1 |
|
Suggestion relating to promotion of good driving practice |
4 |
|
Increase enforcement (non-specific suggestion) |
9 |
|
Increased police presence would be necessary to enforce change in speed limits |
6 |
|
More speed cameras would be needed to enforce a lowered national speed limit |
6 |
|
Reducing the national speed limit would be difficult to enforce |
3 |
|
Suggestion to remove speed cameras |
1 |
|
Suggest alternative speed limit proposal |
5 |
|
Suggestions relating to insurance or financial incentives |
2 |
|
Suggestion for tougher penalties for speeding and dangerous driving |
2 |
|
Comments relating to vehicle technology |
2 |
|
Enforcement |
65 total |
Table 6d. General theme
|
Sub theme |
Sub theme total |
|---|---|
|
General opposition to reducing the national speed limit |
14 |
|
Criticism of the Scottish Government |
8 |
|
General support for increasing HGV limit |
8 |
|
Scottish Government should direct resources to road maintenance instead |
8 |
|
General support for reducing the national speed limit |
7 |
|
General opposition to increasing HGV limit |
6 |
|
Concern about the cost of implementing the proposals |
4 |
|
Scottish Government should dual major roads instead of changing speed limits |
4 |
|
General |
59 total |
Table 6e. Consultation theme
|
Sub theme |
Sub theme total |
|---|---|
|
Criticism of the evidence provided for the proposals |
13 |
|
Request for further information on the proposals |
5 |
|
Criticism of the survey questions |
4 |
|
General criticism of consultation |
4 |
|
Criticism of the consultation as having a predetermined outcome |
3 |
|
Criticism of the consultation materials |
3 |
|
Criticism of the consultation promotion |
3 |
|
Positive feedback on the consultation process |
3 |
|
Criticism of the consultation events |
1 |
|
Consultation |
39 total |
Table 6f. Socioeconomic theme
|
Sub theme |
Sub theme total |
|---|---|
|
Reducing national speed limit would have a disproportionate impact on people who need to travel long distances |
13 |
|
Reducing national speed limit would negatively impact Scotland's economy |
6 |
|
Increasing HGV limit would positively impact Scotland's economy |
5 |
|
Proposals would negatively impact quality of life |
4 |
|
Reducing national speed limit would have negative impact on tourism |
4 |
|
Concern about driving ability of non-locals |
3 |
|
Socioeconomic |
35 total |
Table 6g. Environment theme
|
Sub theme |
Sub theme total |
|---|---|
|
Reducing national speed limit would lead to decrease in fuel efficiency / negative climate change impact |
5 |
|
Increasing HGV limit would lead to more noise |
2 |
|
Increasing HGV limit would lead to decrease in fuel efficiency / negative climate change impact |
1 |
|
Environment |
8 total |