Background Context
This section outlines the background context of the assessment corridor and covers the following topics:
- Assessment Corridor
- Socio-Economic Context
- Location of Key Services
- Existing Road Network
- Traffic Data
- Accident Locations and Severity
- Active Travel Provision
- Public Transport Provision
For the purposes of this Strategic Assessment, a high-level overview is given to provide the existing context. Further detail on this and other existing conditions will be outlined in the A75 Springholm and Crocketford Improvements Design Manual for Roads and Bridges (DMRB) Stage 1 Scheme Assessment Report.
Assessment Corridor
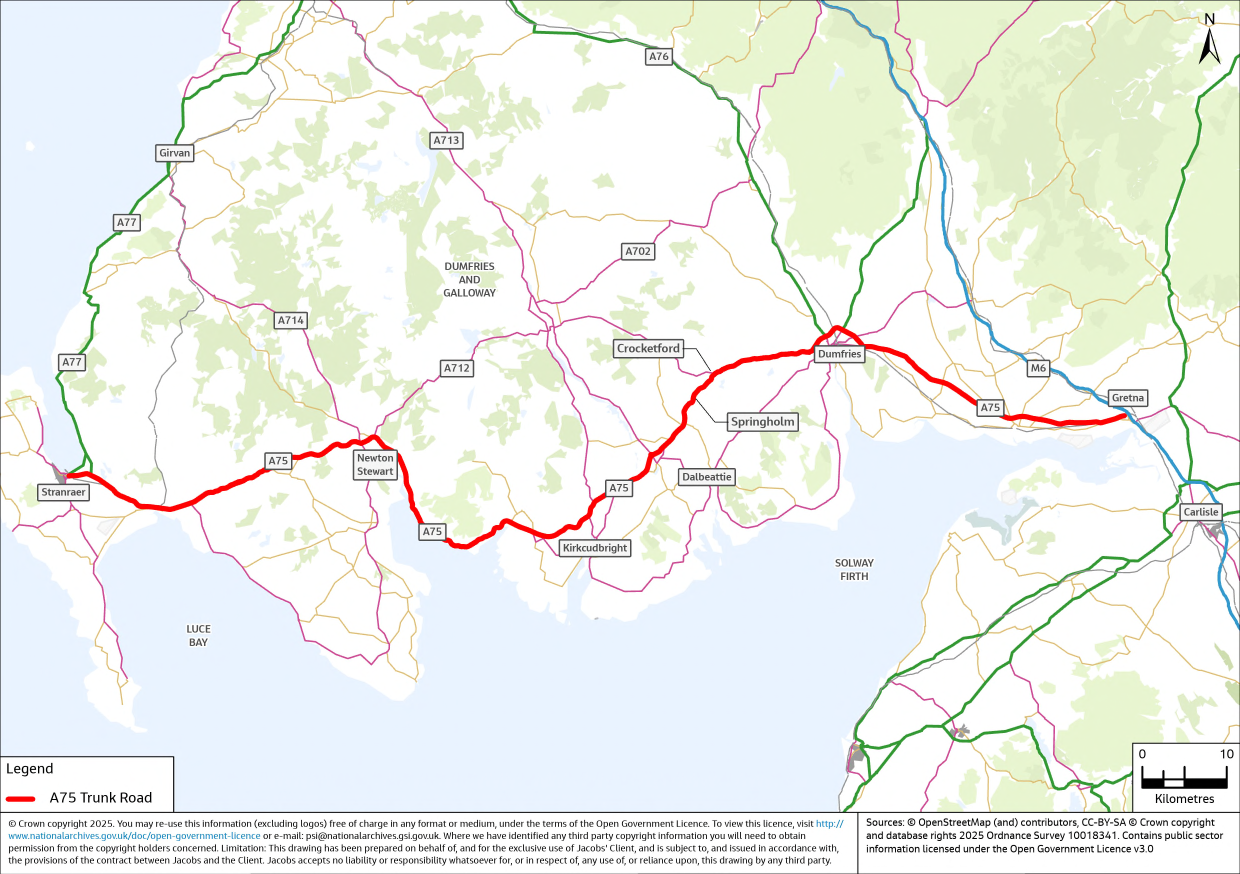
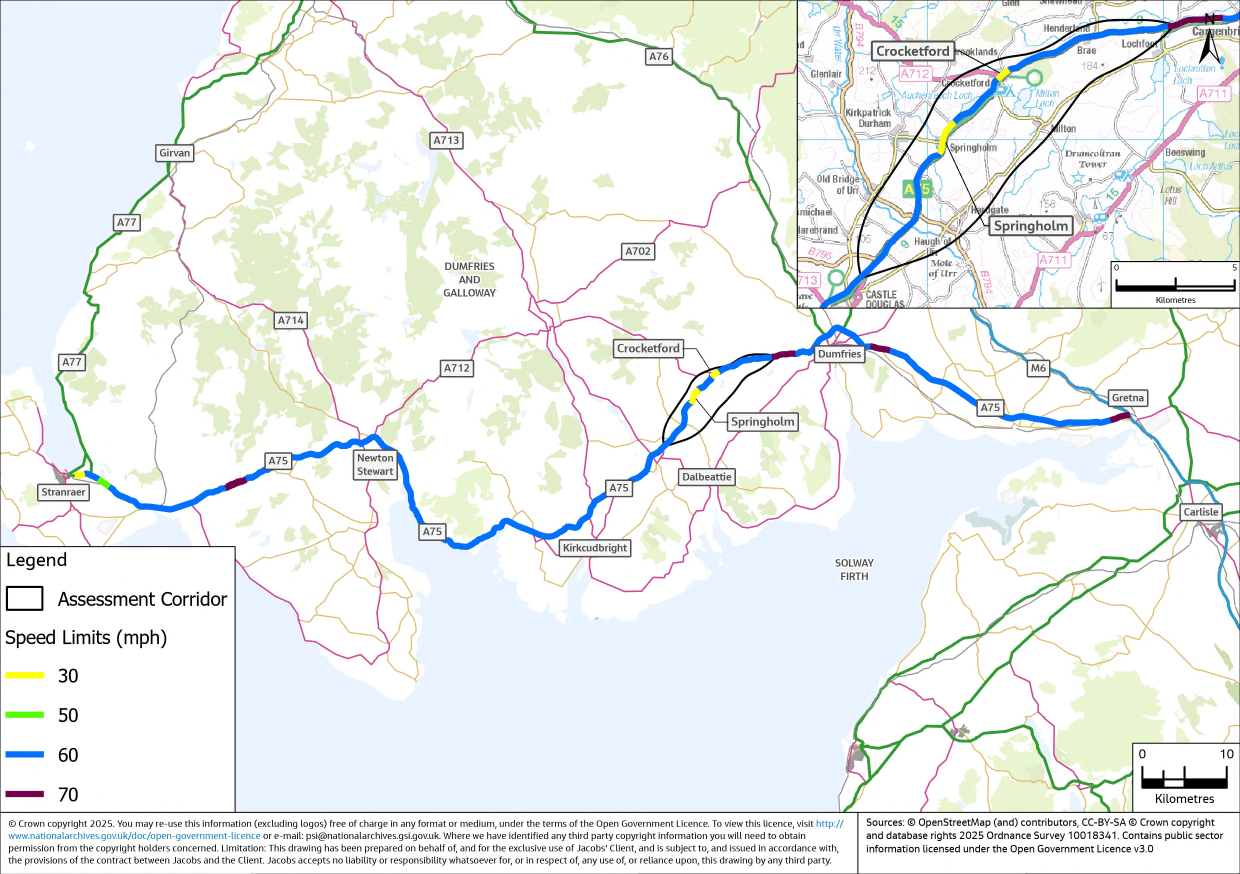
The A75 Trunk Road serves as a primary road in South West Scotland, spanning approximately 159 kilometres connecting Stranraer in the west to Gretna in the east as shown in Figure 2‑1. The A75 Trunk Road plays a vital role in local, regional and national connectivity, linking the ferry ports at Cairnryan near Stranraer with the A74(M) motorway at Gretna.
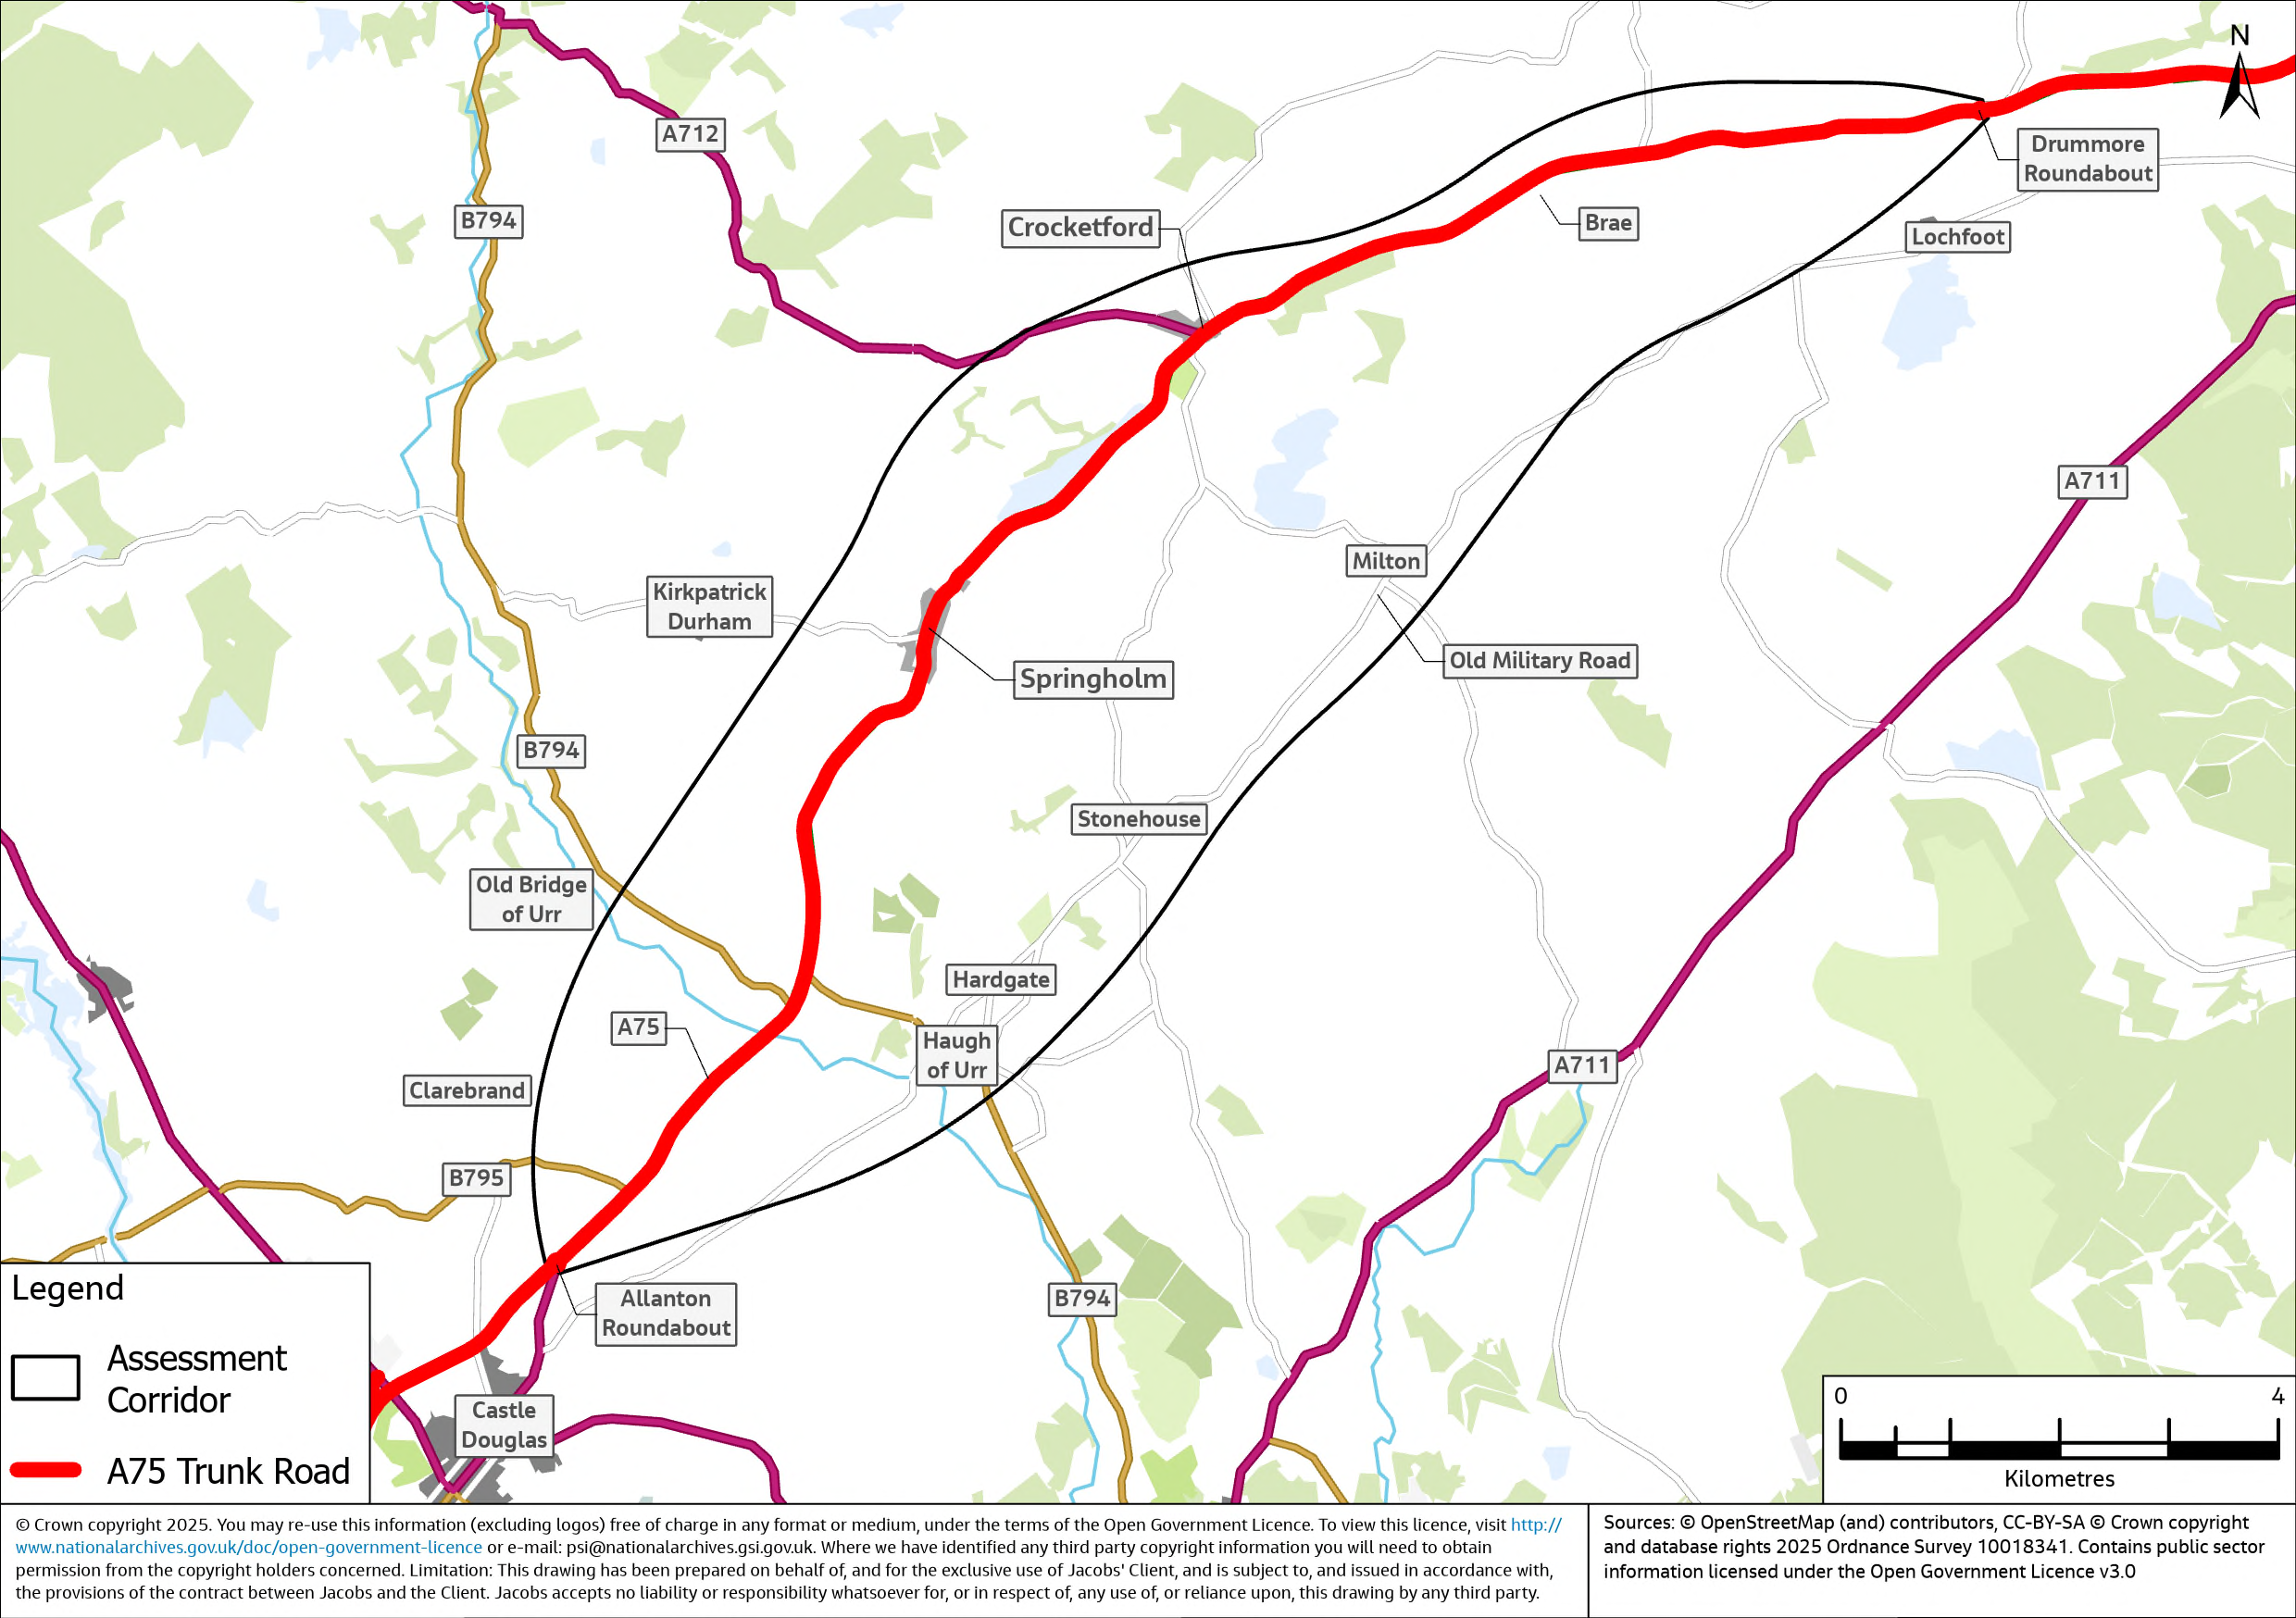
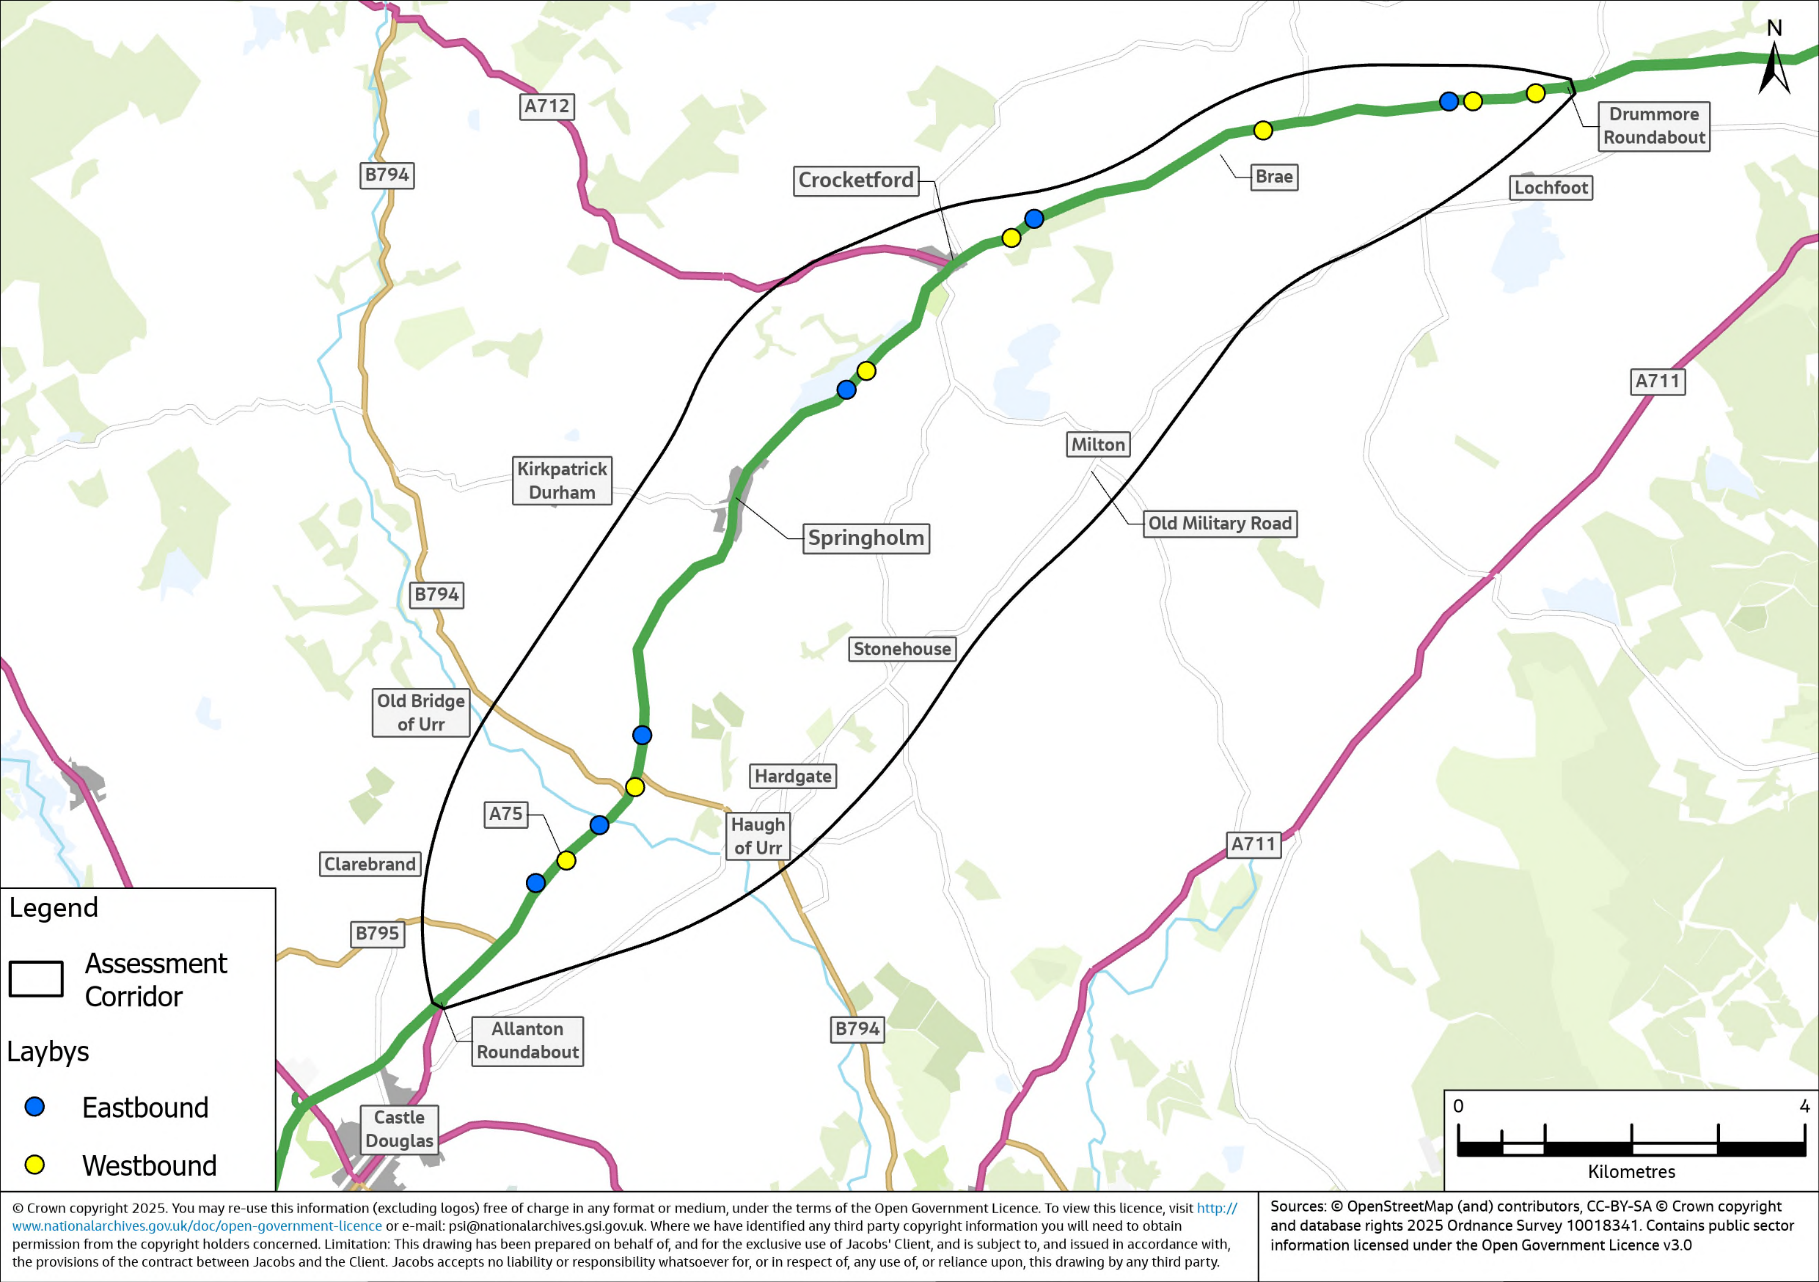
The Assessment Corridor for the proposed scheme, as shown in Figure 2‑2, has been defined by considering existing constraints and potential improvement strategies through which road alignments could be developed to realign the existing A75 around Springholm and Crocketford, taking account of relevant road design standards in the DMRB. The assessment corridor extends from Allanton Roundabout in the west to Drummore Roundabout in the east, encompassing approximately 19km of the A75 and the communities of Springholm and Crocketford, where the existing A75 passes directly through the two villages.
In addition to the two roundabouts, the assessment corridor encompasses several junctions where the A75 intersects with other roads. In terms of A and B roads, the A712 Maiden Row near Crocketford is a minor road that connects to the A75 via a priority junction. Similarly, the B794 Corsock is a minor road that intersects the A75 at a priority junction, leading north to the Old Bridge of Urr. The B794 Haugh Road, another minor road, also joins the A75 at a priority junction and leads south to the Old Haugh of Urr.
There are a number of minor junctions and accesses including ten junctions with C roads or unclassified roads, and several other minor accesses serving commercial, private, residential and agricultural purposes that connect to the A75 Trunk Road.
Socio-Economic Context
As far as possible the statistics, results, and data presented within this section are based on the defined Scotland Census finest level of detail. Where this has not been possible other data is presented at either a Scotland Census data zone or local authority level.
Population
Analysis of the 2022 Scotland Census data shows that Crocketford and Springholm have populations of 310 and 542 respectively, as shown in Table 2‑1. Collectively, the village population is approximately 46% of the total assessment corridor population of 1,834. The remaining population comprises residents from other villages such as Haugh of Urr, as well as those living in more rural areas or communities.
|
Settlement |
Population |
|
Crocketford |
310 |
|
Springholm |
542 |
|
Others within Assessment Corridor |
982 |
The South West Scotland Transport Study - Initial Appraisal: Case for Change (SWSTS), published in 2020, examined the rationale for improving transportation infrastructure in the South West region. It focused on road, rail, public transport, and active travel mode options along strategic corridors, including the A75. Demographically, the SWSTS notes that the region has a larger proportion of older residents, and a smaller working-age population compared to Scotland as a whole.
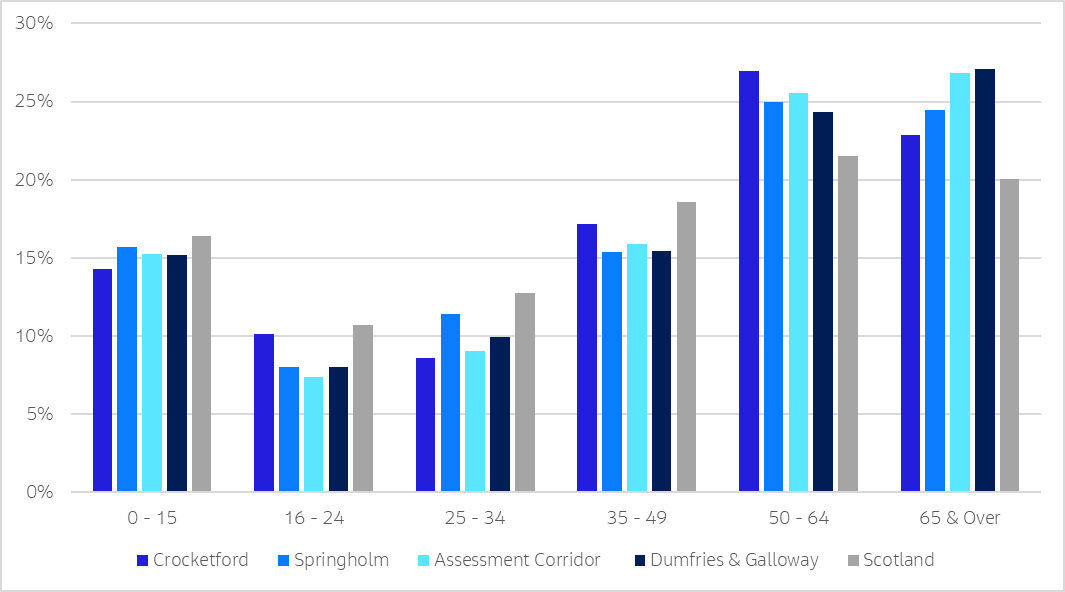
The 2022 Scotland Census data , shown in Figure 2‑3, confirms that the assessment corridor has an older population. Both the assessment corridor area and Dumfries and Galloway have 27% of their population aged 65 and over, notably higher than Scotland's 20%. The contrast is more pronounced when considering the combined 50-64 and 65 & over age groups, which account for 53% of the assessment corridor population and 51% of Dumfries and Galloway, compared to just 42% for Scotland overall.
Conversely, the age group 16-64, representing most of the working age population, is proportionally smaller in the assessment corridor and Dumfries and Galloway. The assessment corridor has 58% of the population in this age range, comparable with Dumfries and Galloway (57%), but both lower than the Scotland average (65%).
This age profile, combined with the area’s rural nature, places additional demands on healthcare, public transport, and other services typically required by an elderly population, as noted in the SWSTS.
Travel To Work Mode Share
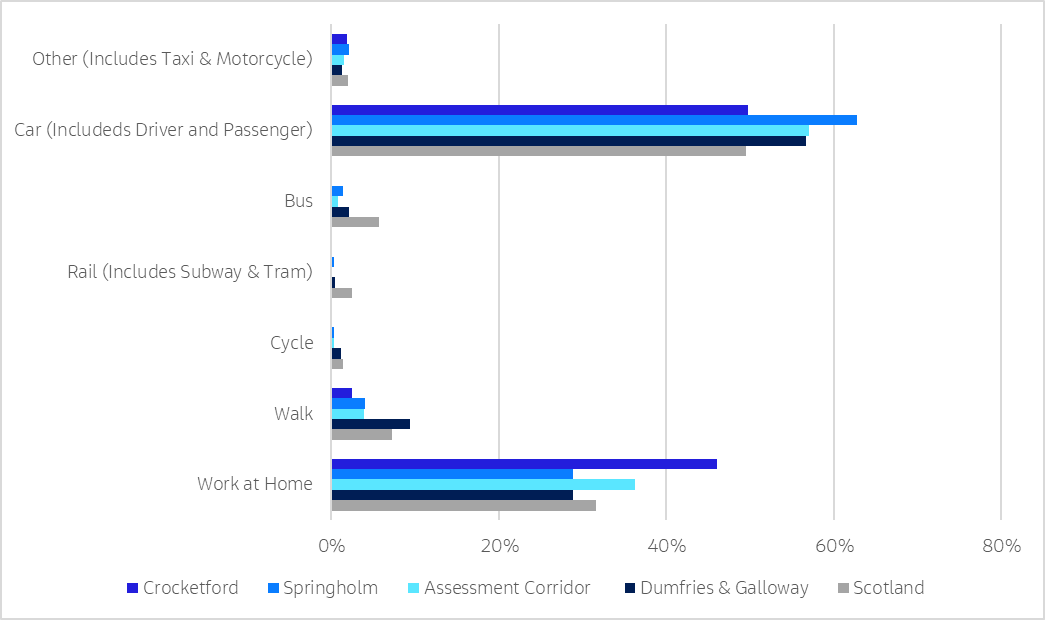
The method of travel to work mode share data from the 2022 Scotland Census is shown in Figure 2‑4. Springholm has the highest car usage at 63%, significantly greater than the national average (49%). Car usage in Crocketford is 50% and in line with the national average. The assessment corridor car use is approximately 57%, which is equal to the Dumfries and Galloway car use mode share. Crocketford has a higher percentage of people working from home (46%) compared to the Scottish average of 32%, whereas this is only 29% in Springholm. The assessment corridor demonstrates a work-from-home rate of 36%, therefore, higher than the national average.
The data also highlights a significant difference in public transport and active travel usage between the villages in the assessment corridor compared with the wider regional and national averages. Crocketford and Springholm show minimal use of public transport (0% and 1% respectively) compared to Dumfries and Galloway (2%) and across Scotland (6%). Both villages also have lower rates of active travel modes compared to the regional and national averages. The mode share of walking to work in the villages is 2% in Crocketford and 4% in Springholm, compared to 9% for Dumfries and Galloway and 7% for Scotland. For cycling, the mode share is 0% for both villages, slightly below both Dumfries and Galloway and Scotland (both 1%).
The low levels of public transport and active travel mode share, and the reliance on private car in the two villages, are exacerbated by a number of key services being located elsewhere and is likely to be related to the limited accessibility to these services by public transport and active travel.
It is important to note that the 2022 Scotland Census data was collected after the majority of COVID-19 pandemic restrictions were lifted, which likely had a substantial impact on travel patterns. The high percentage of people working from home in some areas may reflect the response to pandemic-related restrictions and rapid shifts in work culture. However, as return-to-office policies are implemented, there may be a resurgence in travel to a physical workplace over time.
Comparing the 2022 Scotland Census data with pre-pandemic figures (from 2011 Scotland Census data), the work-from-home rate for Crocketford has increased from 35% to 46%, whilst Scotland's overall rate nearly tripled from 11% to 32%. Despite the significant rise in remote working, car usage decreased less severely in Crocketford (from 57% to 50%) and Springholm (from 67% to 63%), compared to a more substantial decrease from 62% to 49% nationally. This suggests that whilst the COVID-19 pandemic dramatically altered work locations, it had a less pronounced effect on car dependency in Springholm and Crocketford specifically.
Vehicle Availability
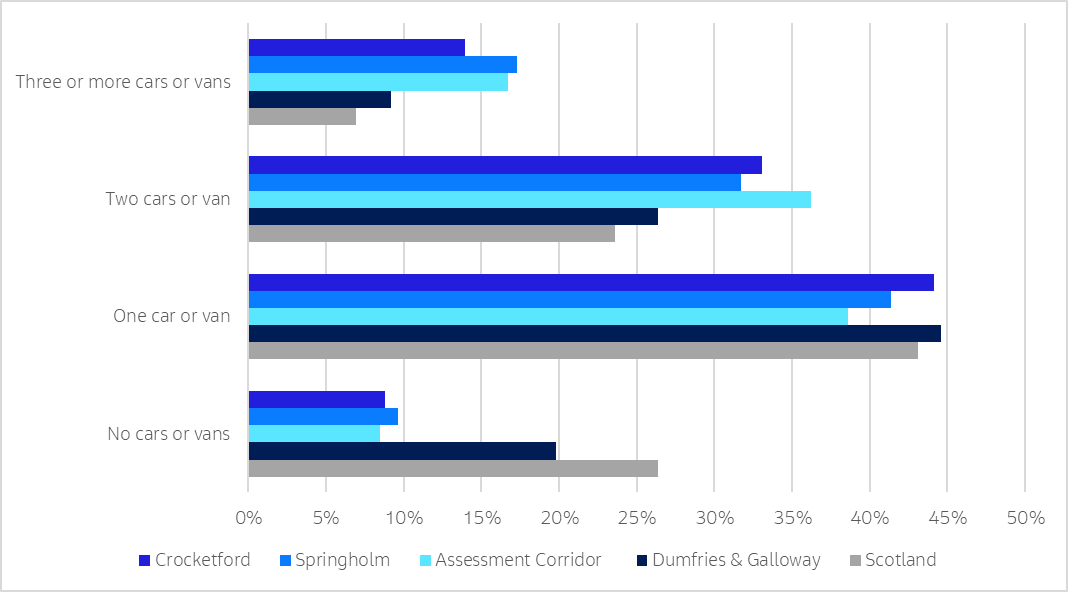
Limited access to services correlates strongly with higher vehicle accessibility in Crocketford and Springholm, as shown by the 2022 Scotland Census data in Figure 2‑5. These rural communities show a higher proportion of multi-car or van households compared to both the regional and national averages. Specifically, 47% of households in Crocketford and 49% in Springholm have two or more cars or vans available, significantly exceeding the equivalent figure for Dumfries and Galloway (35%) and Scotland overall (31%). Moreover, the percentage of households with access to three or more cars or vans in both Crocketford (14%) and Springholm (17%) is notably higher than the Dumfries and Galloway region (9%) and national (7%) averages.
This pattern of high car ownership in areas with more limited accessibility to services strongly suggests a reliance on private vehicles for residents to meet their daily needs and access essential services.
Education
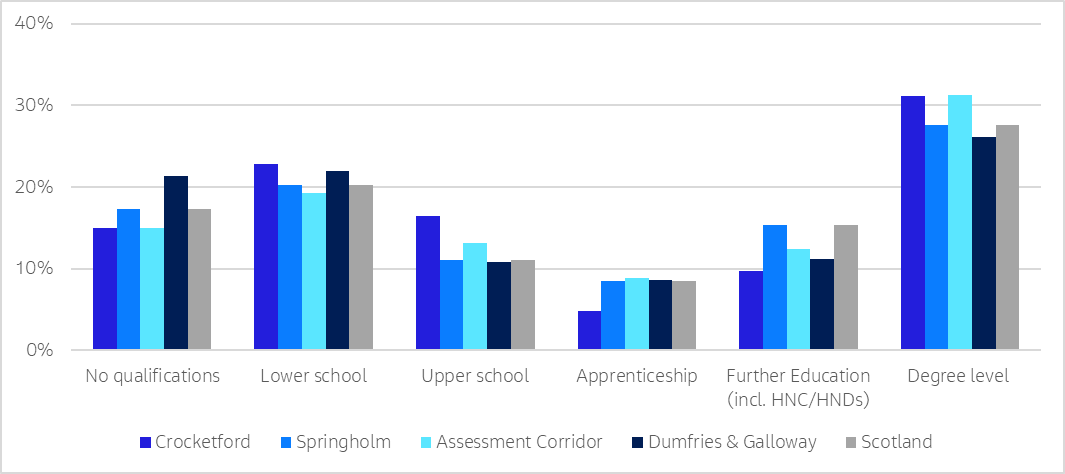
Figure 2‑6 illustrates 2022 Scotland Census data for the highest level of qualification achieved. The data shows that Crocketford and the whole assessment corridor area have slightly higher percentages of degree-level education (31%) compared to the national average (28%), while Springholm matches the national average.
The percentage of individuals with no qualifications ranges from 15% to 21% across all areas. Crocketford and the assessment corridor have the lowest proportion (15%) of people with no qualification, slightly less than the national average of 17% and Springholm (17%). The Dumfries and Galloway region has the highest proportion of people with no qualifications at 21%.
Scottish Index of Multiple Deprivation (SIMD)
The Scottish Index of Multiple Deprivation (SIMD) shows the socio-economic variation experienced across the assessment corridor as of 2020. The overall SIMD rank of an area is dependent on multiple domains, including income, employment, health, education, housing, geographic access and crime. Whilst it is a combination of these domains that defines the overall SIMD rank, each can be interrogated individually to determine specific domains of strength and weakness of an area. Figure 2‑7 illustrates the overall SIMD decile ranking of data zones within the study area.
The assessment corridor encompasses five data zones, which fall within the 5th to the 8 th decile of the SIMD across Scotland (where one is most deprived and ten least deprived), indicating a moderate to good level of socio-economic status across much of the assessment corridor. Haugh of Urr has the highest ranking of 8, while Crocketford and the Springholm/Kirkpatrick Durham area have the lowest ranking of 5, representing the most deprived data zones in the assessment corridor. No data zone within the assessment corridor falls within the top 20% most deprived across Scotland.
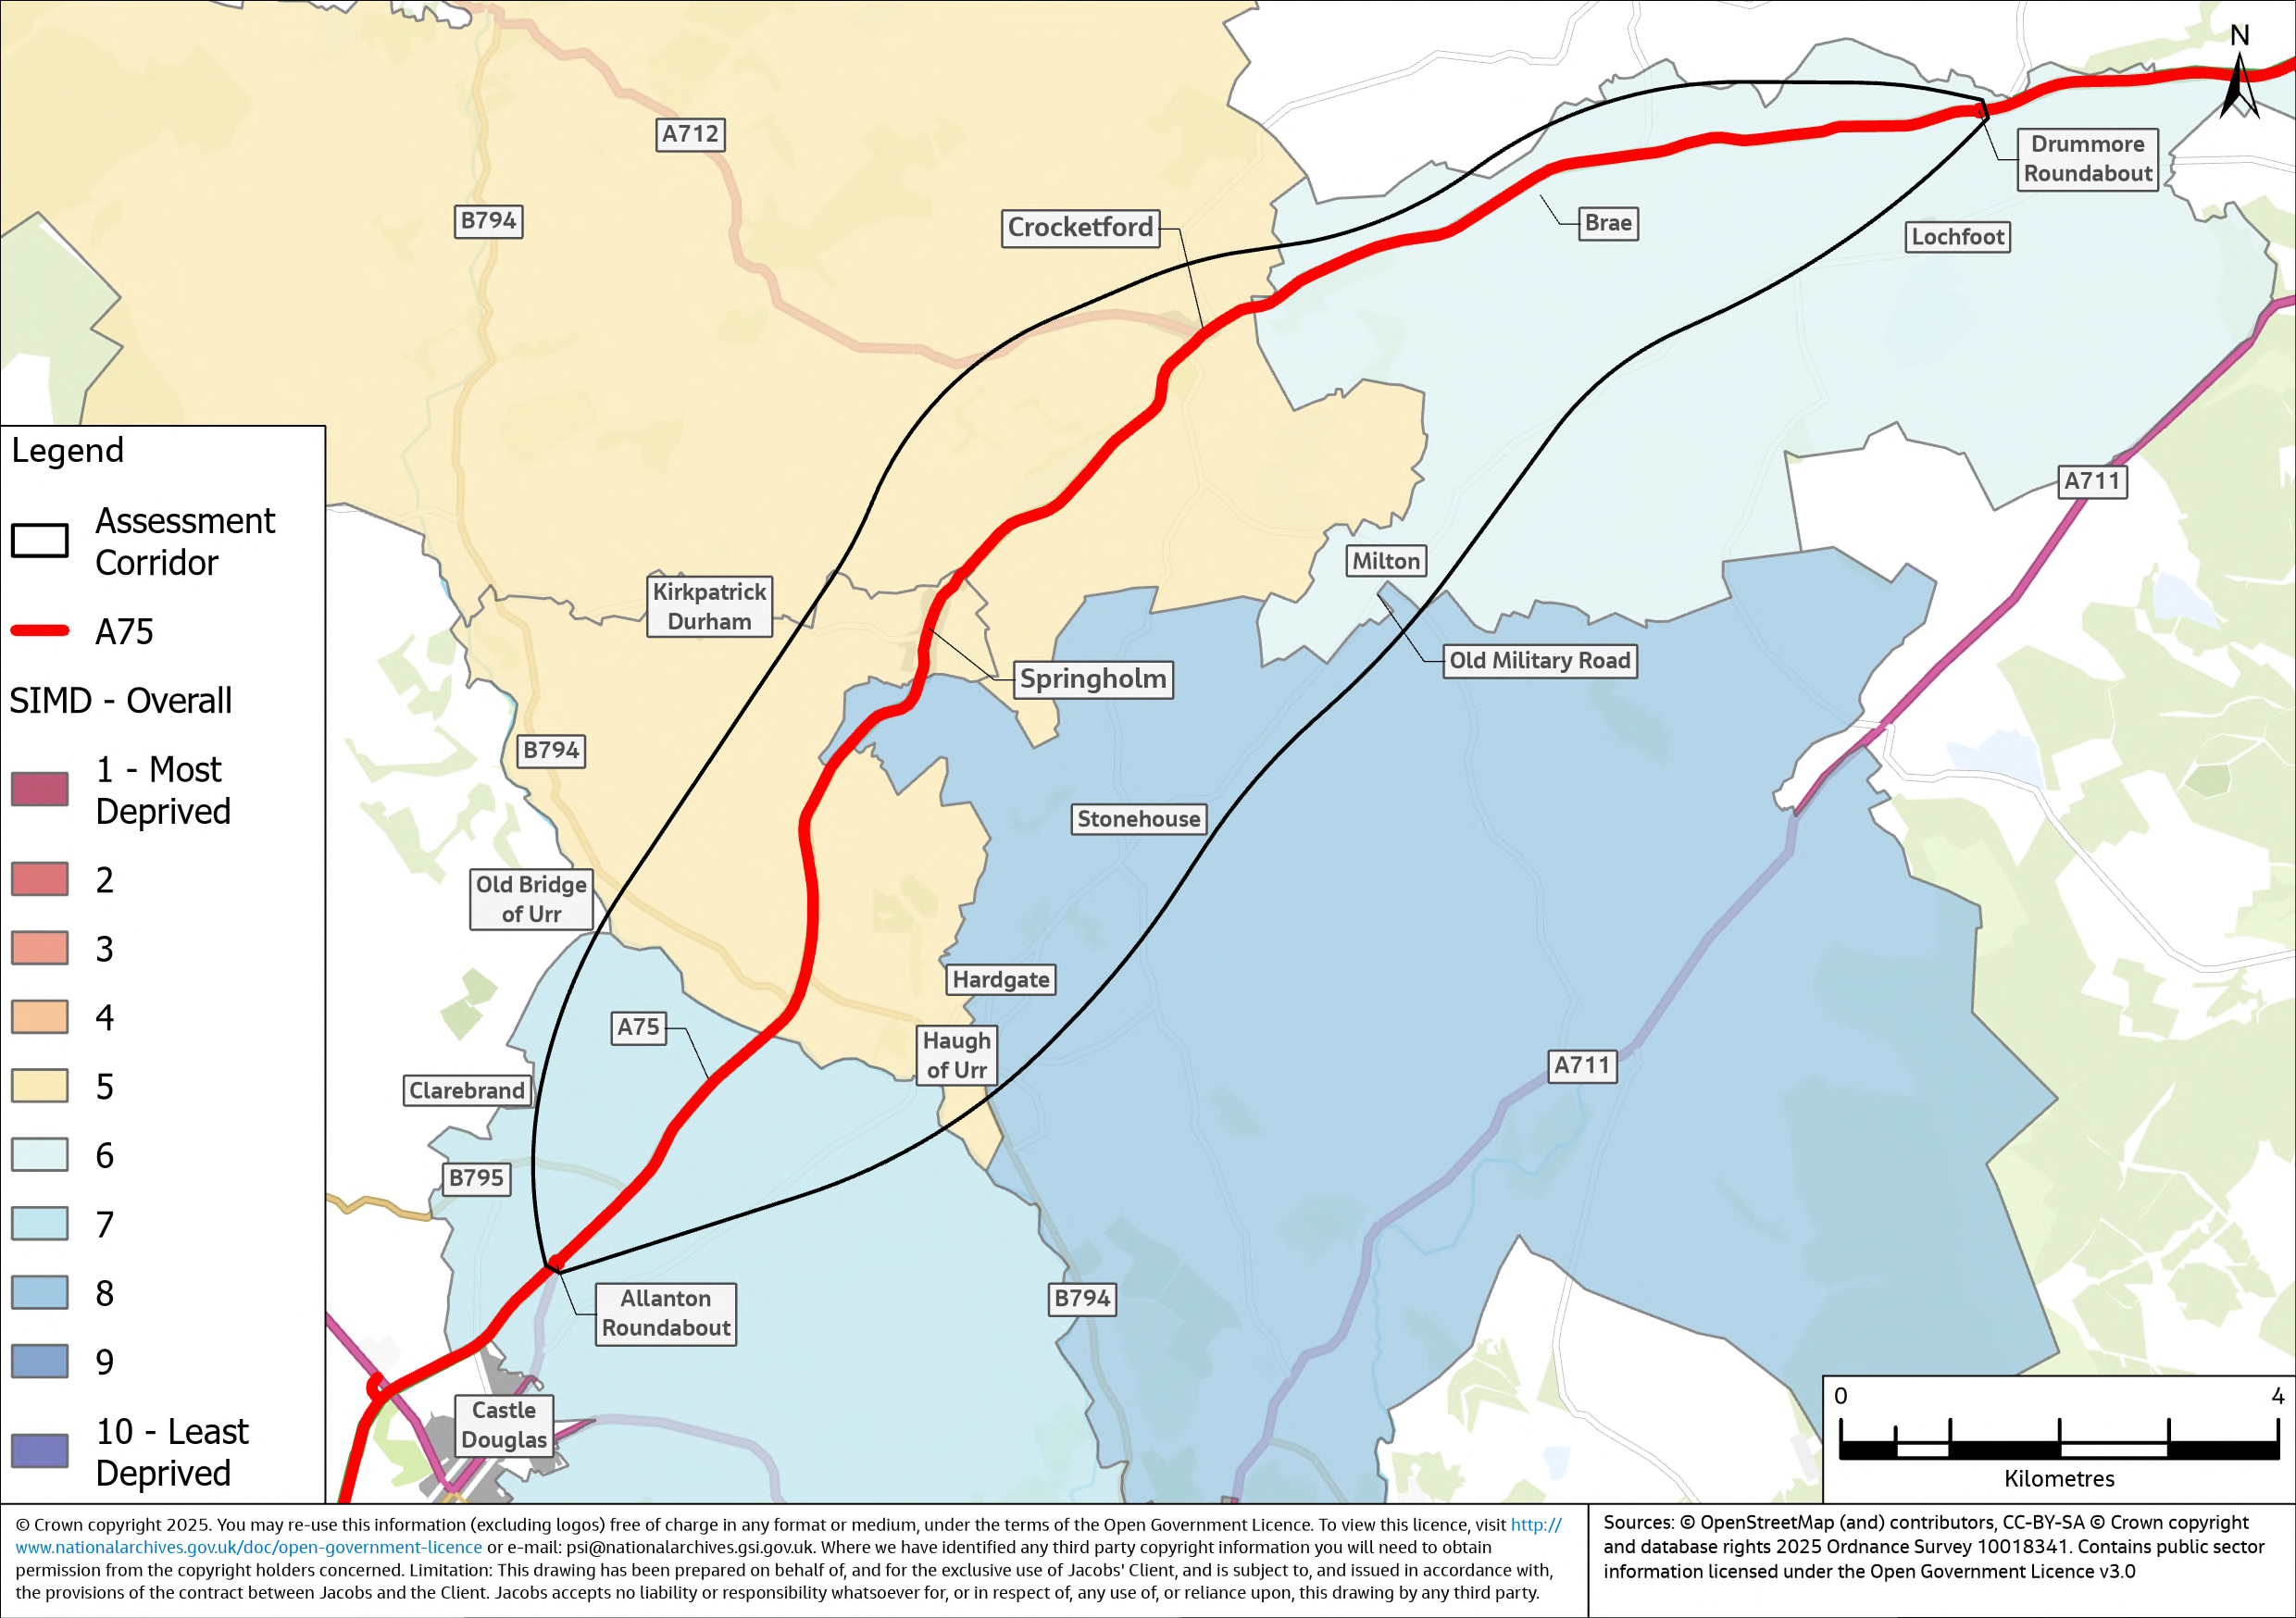
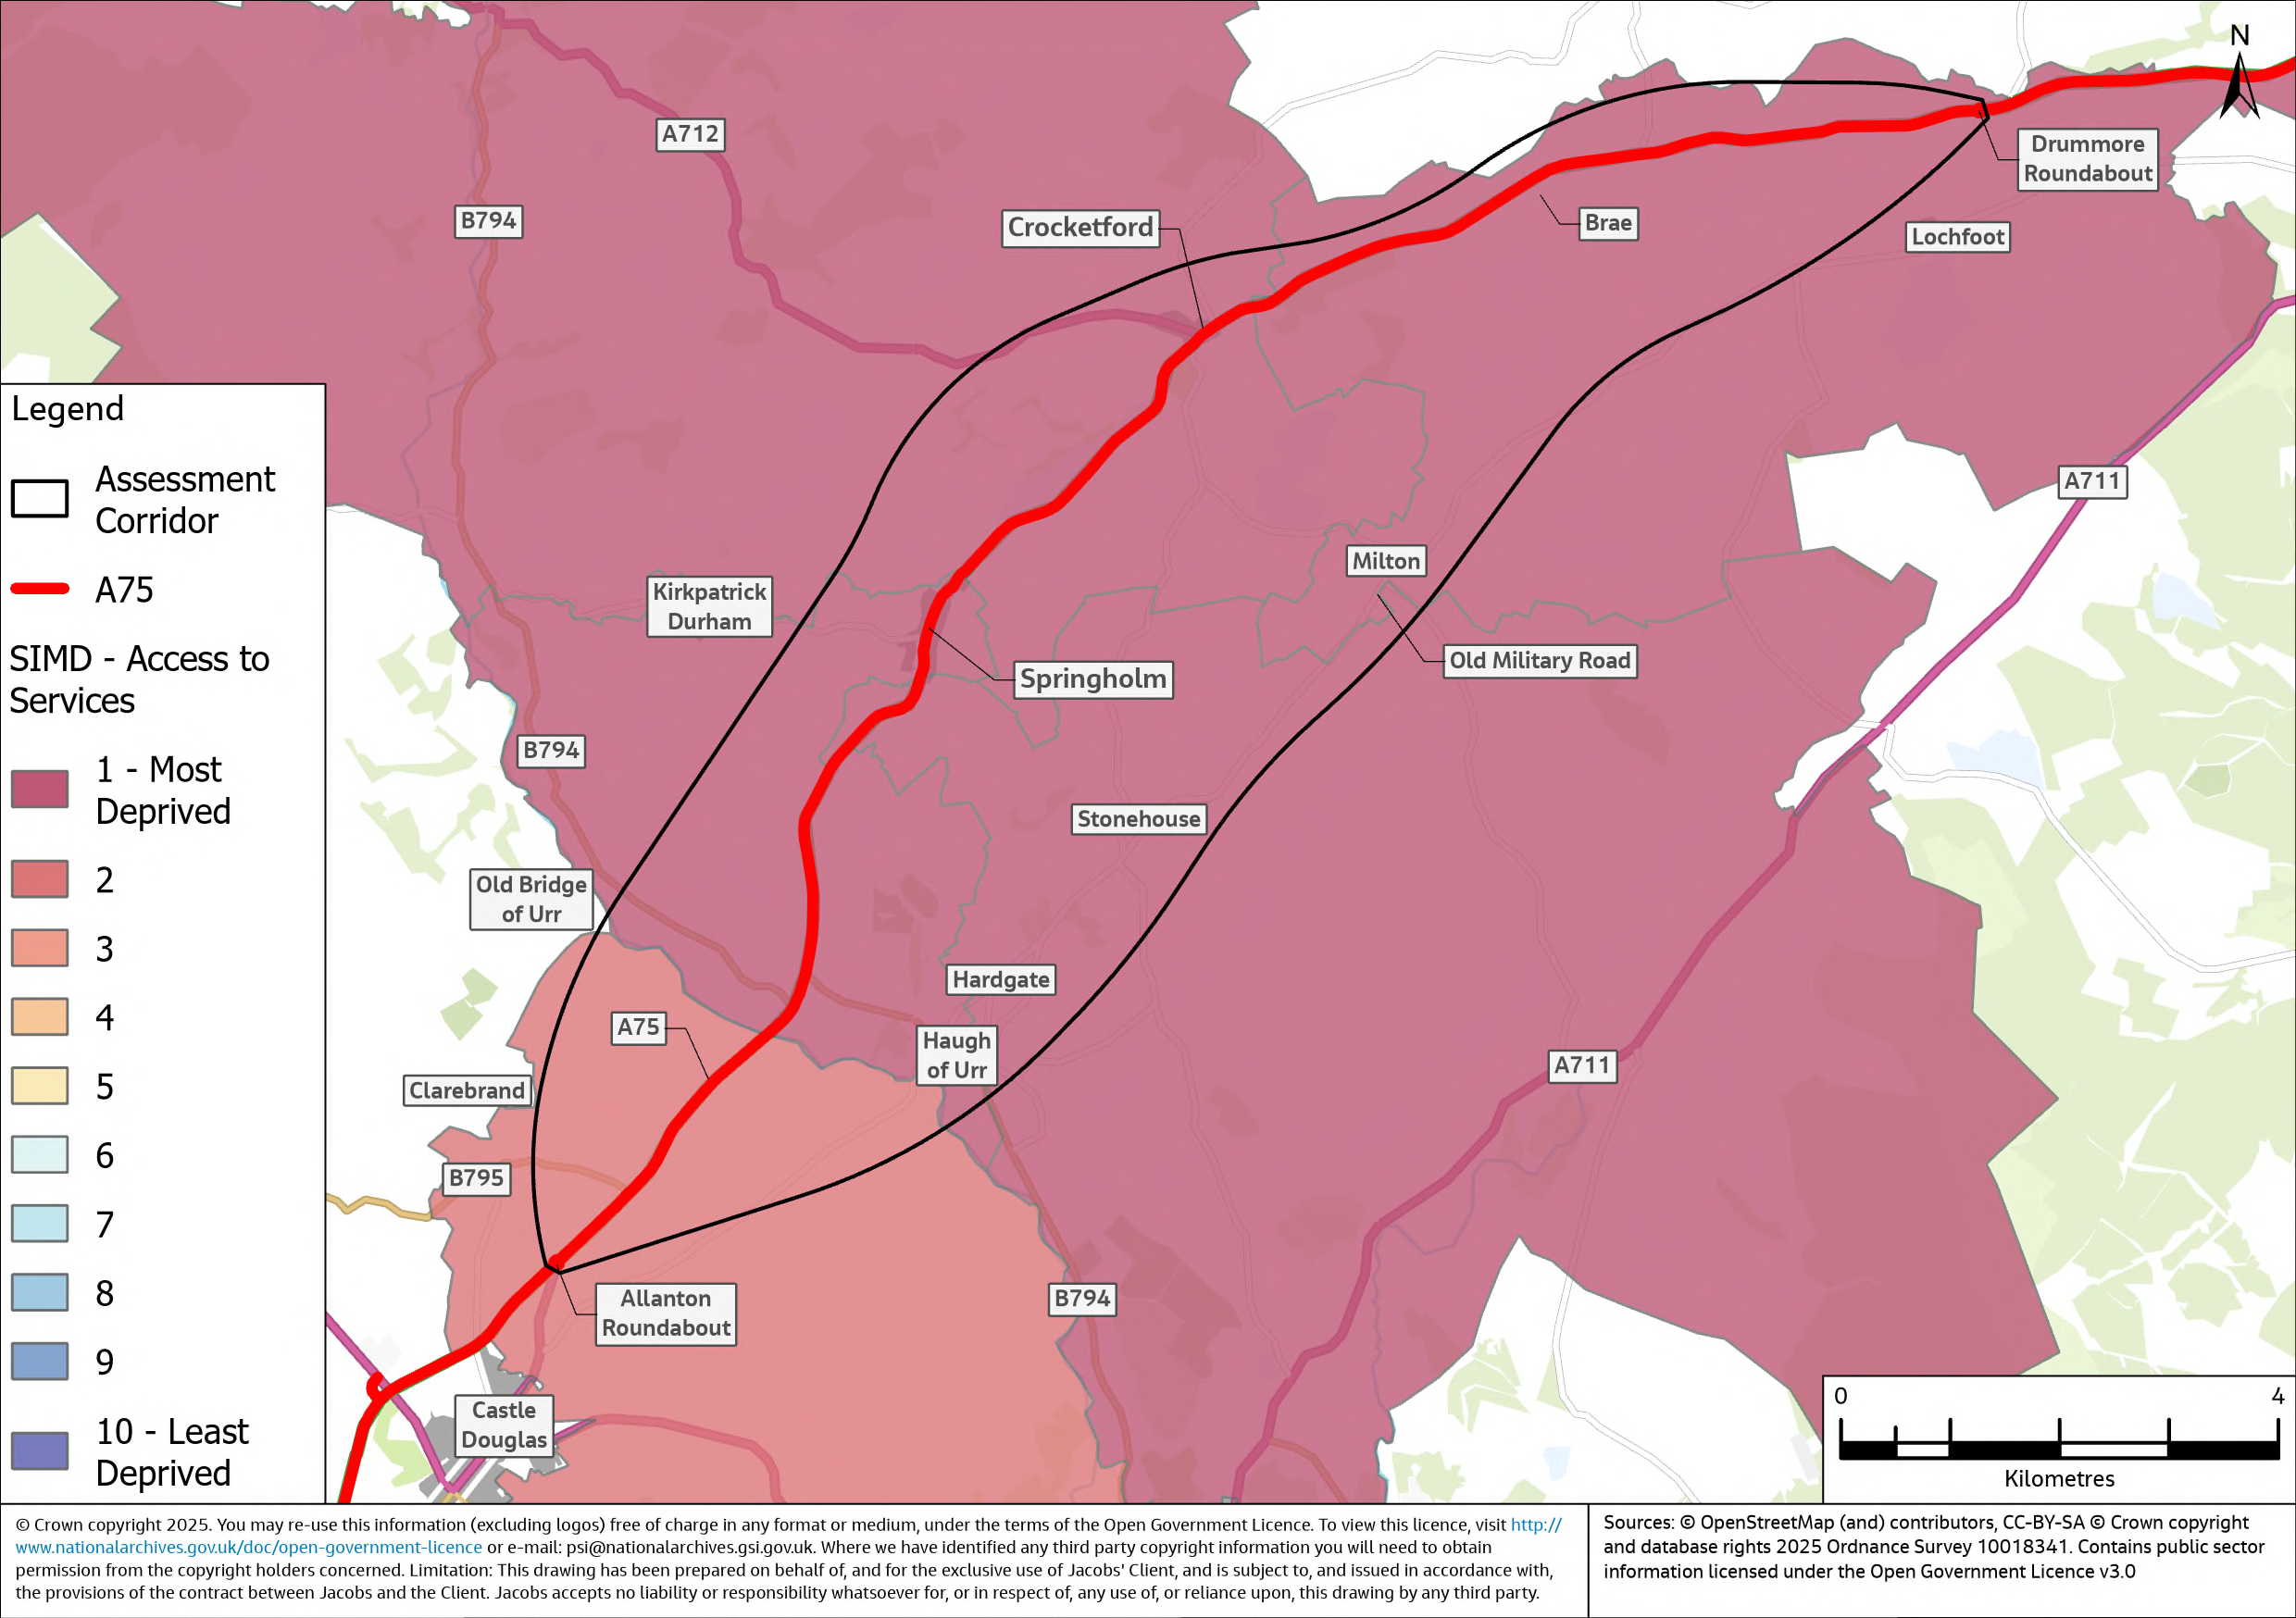
Figure 2‑8 presents the SIMD Geographic Access Indicator domain scores for data zones included within the assessment corridor. The geographic access domain within SIMD refers to the ability of residents to reach a number of key services, with sub-domains for public transport journeys and journeys by private car. It evaluates the ability for residents to reach key services such as health facilities, educational institutions, retail centres, fuel stations, and post offices.
The majority of data zones (four out of five) have a ranking of 1 for the Geographic Access domain, indicating very poor access to services. This is true for the data zones encompassing the settlements of Crocketford and Springholm, as well as Haugh of Urr, Milton and Kirkpatrick Durham, as well as the surrounding rural areas. The sole exception is the zone east of Castle Douglas, which has a slightly better ranking of 2; however, this still suggests poor access to services, albeit marginally better than the other data zones within the assessment corridor.
Digital Connectivity
Table 2‑2 shows the average percentage of households that receive Superfast Broadband (SFBB) and Ultrafast Broadband (UFBB) according to Ofcom data for 2024 across Springholm and Crocketford in the assessment corridor, compared to Dumfries and Galloway and Scotland overall. SFBB is defined as speeds of 30Mbps or greater, while UFBB refers to speeds of 300Mbps or greater. SFBB availability is 92% for households within the assessment corridor boundary, with Crocketford at 99% and Springholm at 100% specifically. UFBB availability is significantly limited, with 11% in Crocketford and 2% in Springholm. While the assessment corridor shows 39% UFBB coverage overall, there is variation between the 12 output areas (OAs), with five OAs having less than 20% availability but the other seven having approximately 40-80% coverage.
|
Area |
SFBB (30mbps) availability (% premises) |
UFBB (300Mbps) availability (% premises) |
|
Crocketford |
99% |
11% |
|
Springholm |
100% |
2% |
|
Assessment Corridor |
92% |
39% |
|
Dumfries and Galloway |
93% |
34% |
|
Scotland |
96% |
77% |
Economy & Labour Market
A review of the SWSTS indicated an above-average dependence on the public sector for employment in the region compared to Scotland as a whole. Figure 2‑9 illustrates the percentage distribution of industry sectors for the assessment corridor, Dumfries and Galloway, and across Scotland. This data is derived from the Business Register and Employment Survey (BRES) 2023 and is based on employment location. Due to the geographic representation of BRES data, for the purpose of this analysis, the most relevant 2011 Scotland Census data zones have been selected to represent the assessment corridor, allowing for a more localised comparison with regional and national figures.
Education is the dominant employer within the assessment corridor, accounting for 44% of employment. This figure is markedly higher than both the Dumfries and Galloway region and Scotland, where Education represents only approximately 8% of employment in each case. The high proportion of education employment is largely due to one data zone in particular representing the region east of Crocketford and encompassing the A75 Trunk Road and the settlements of Lochfoot and Milton. In this data zone, 600 people were employed in ‘Other Education’, which significantly alters the averages for the assessment corridor.
The second largest sector within the assessment corridor is Human Health & Social Work, comprising 14% of employment. This is slightly below the regional figure of 17% and the national figure of 16%. Agriculture, Forestry & Fishing is more prominent in the assessment corridor (8%) compared to the national average (3%), but less than the regional figure for Dumfries and Galloway (14%). In contrast, several sectors are notably underrepresented within the assessment corridor, including for example the IT, Finance & Real Estate sector, which accounts for just 1% of employment in the assessment corridor but approximately 8% across Scotland.
This employment distribution corroborates the SWSTS findings, highlighting a pronounced focus on public sector employment within the assessment corridor, particularly in the Education sector.
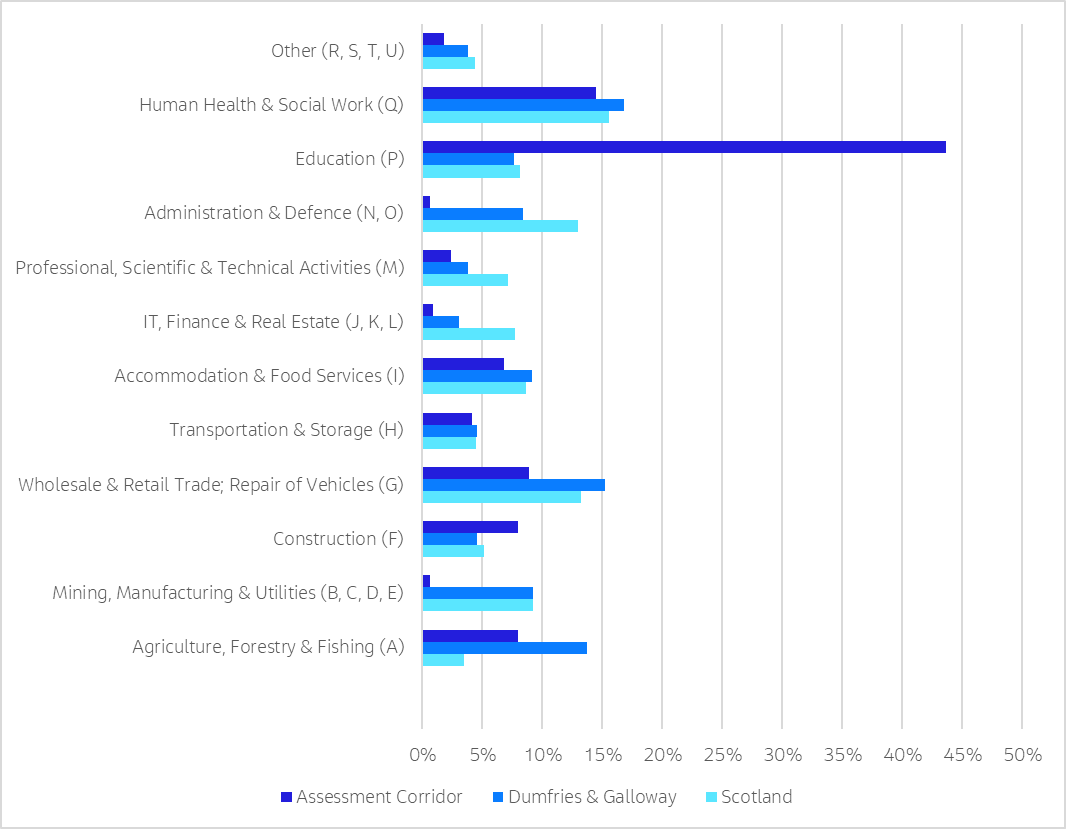
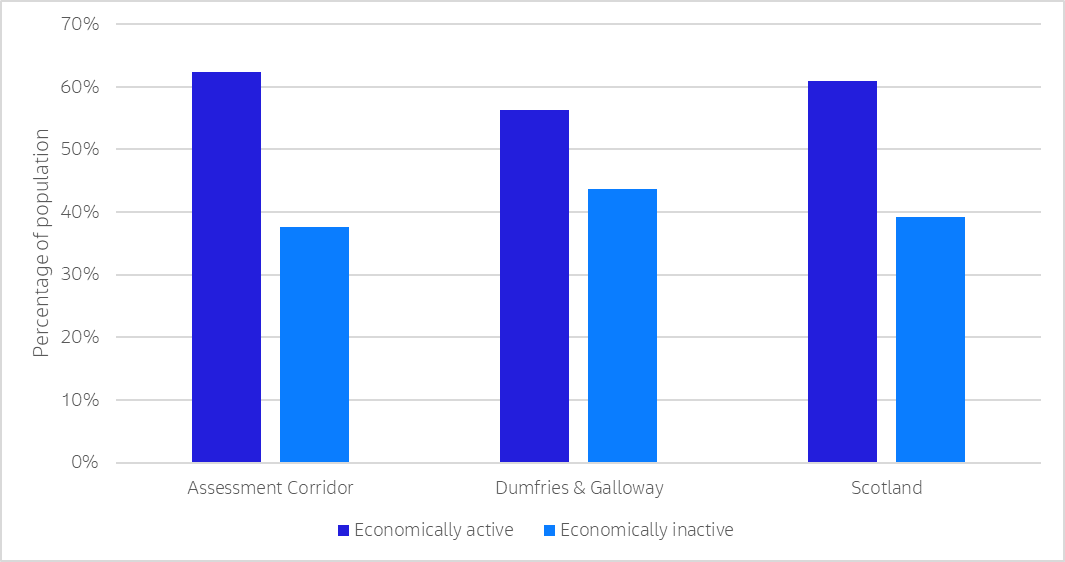
Figure 2‑10 presents 2022 Scotland Census data comparing the economic activity of individuals within the assessment corridor to the Dumfries and Galloway region and Scotland averages. Economic activity refers to individuals aged 16 and over who were working or seeking work in the week preceding the Census. The data classifies individuals into two main categories: economically active (including full-time and part-time employees, self-employed individuals, and those unemployed but seeking work) and economically inactive (comprising retirees, students, homemakers, individuals with long-term illnesses or disabilities, and others not participating in the labour market).
The assessment corridor area has an economic activity rate of 62%, which is largely in line with the national average (61%), but greater than Dumfries and Galloway (56%).
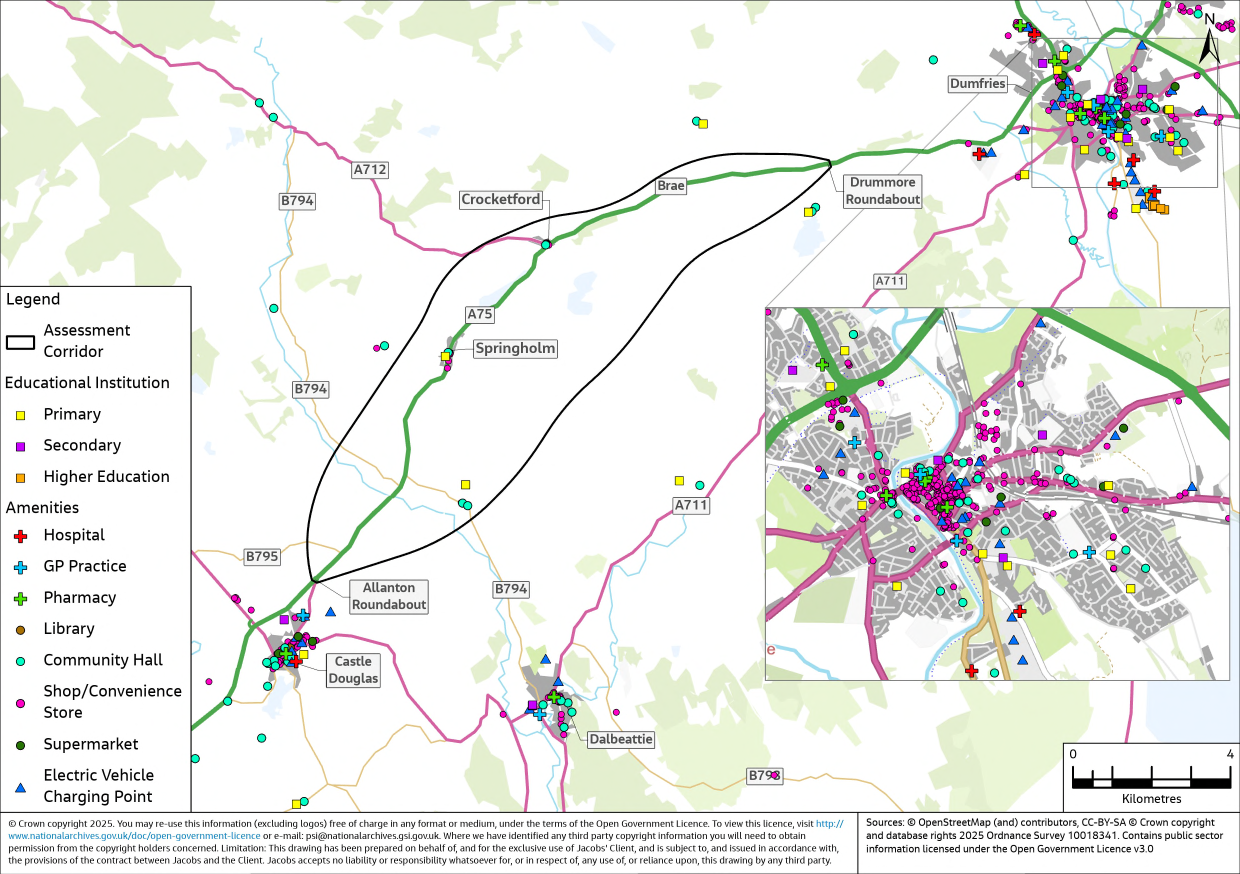
Location of Key Services
A review of key services and amenities within the assessment corridor has been undertaken, to identify the locations of the nearest healthcare facilities, education, electric vehicle (EV) charging points, retail stores, and any other notable community facilities (e.g. libraries and community buildings).
Within the assessment corridor, the villages themselves have some limited services. Springholm has a local Primary School, a village hall and a small convenience store and Crocketford has a village hall, a small convenience store and a hotel. There is also a further hotel with restaurant and pub facilities situated between the two villages. Within the Assessment corridor there are no GPs, pharmacies, Secondary Schools or electric vehicle charging points. The nearest Accident and Emergency Services department is located within the Dumfries and Galloway Royal Infirmary, Dumfries. Outside of the assessment corridor there are various GP and pharmacy services, located in Dumfries, Castle Douglas and Dalbeattie. In terms of education, the closest Secondary School is in Castle Douglas. The closest electric vehicle charging points are located in Castle Douglas, at Garden Hill Primary Care Centre, and Market Street Car Park in the town centre.
Dumfries is the nearest town which has a variety of services and community facilities including leisure facilities, large retail parks and further education at the Dumfries and Galloway College. Table 2‑3 notes the nearest facility, of various types, to both Springholm and Crocketford. Figure 2‑11 highlights the lack of key services in Springholm and Crocketford, evidencing that to access the majority of services Springholm and Crocketford residents must travel to Dumfries or Castle Douglas.
|
Facility Type |
Location |
|
Primary School |
Springholm Primary School, Springholm |
|
Secondary School |
Castle Douglas High School, Castle Douglas |
|
Further Education (College or University) |
Dumfries and Galloway College, Dumfries |
|
Healthcare – GP |
Garden Hill Primary Care Centre, Castle Douglas |
|
Healthcare – Pharmacy |
Garden Hill Primary Care Centre, Castle Douglas |
|
Hospital (Emergency Services Department) |
Dumfries and Galloway Royal Infirmary, Dumfries |
|
Grocery Store (Convenience Store) |
Springholm Shop, Springholm Crocketford Shop, Crocketford |
|
Grocery Store (Large Supermarket) |
Tesco Superstore, Castle Douglas |
|
Electric Vehicle Charging Point |
Garden Hill Primary Care Centre, Castle Douglas |
|
Library |
Castle Douglas Library, Castle Douglas |
Existing Road Network
This section summarises the existing road network, reviewing the road standard across the assessment corridor and the wider A75 as well as reviewing speed limits, traffic controls and provision of laybys and rest areas.
Road Standard
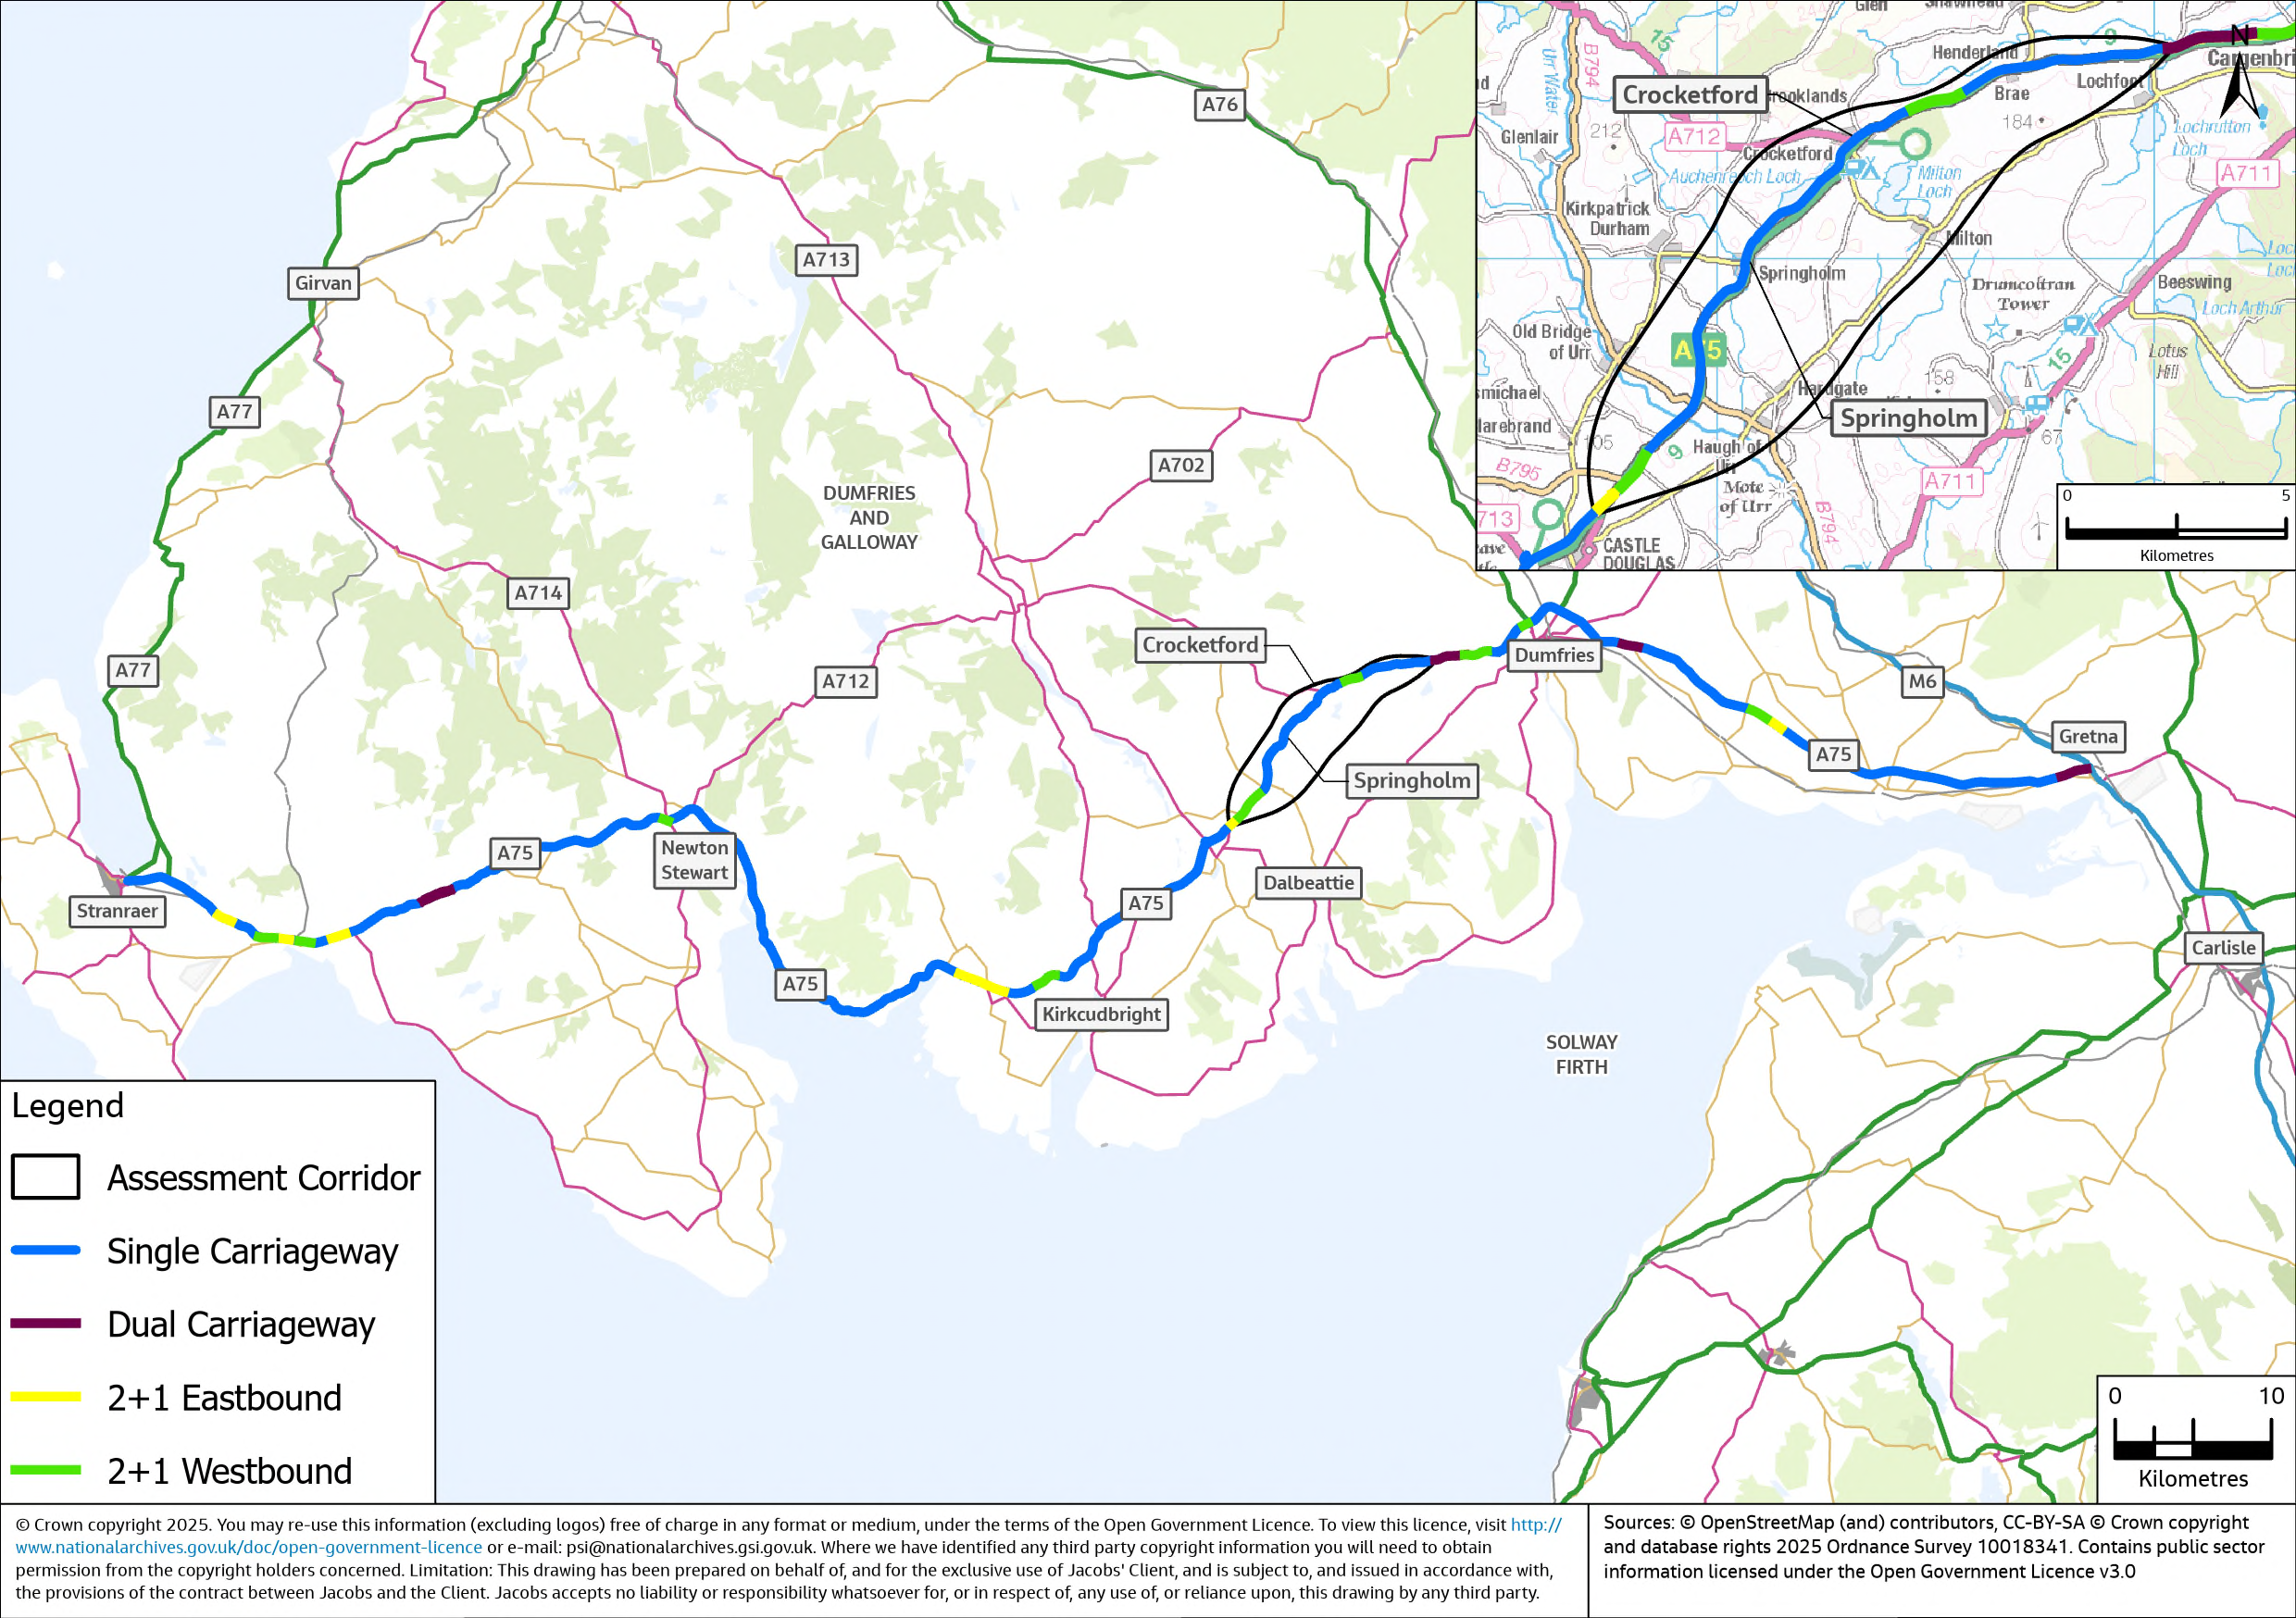
Within the assessment corridor, the A75 is primarily single carriageway with three overtaking lane sections (WS2+1 which consists of two lanes of travel in one direction and a single lane in the opposite direction). One of these is located in the eastbound direction from Allanton Roundabout and two of these overtaking lanes are located in the westbound direction, one on the westbound approach to the Allanton Roundabout and one on the westbound approach to Crocketford, approximately 1.85km north of the town. In total, there are 15 WS2+1 as well as five dual carriageway sections along the A75 Trunk Road between Stranraer and Gretna, as illustrated in Figure 2‑12.
In August 1997, A Route Action Plan Study for the A75 was commissioned by the then Scottish Office to review existing conditions and bring together options for improvements. The Route Action Plan examined the baseline condition on the A75 between Stranraer and Gretna and indicated that the width of the single carriageway varies between 6.8 metres and 7.3 metres, with few sections featuring visible hardstrips.
Speed Limit and Traffic Controls
Within the assessment corridor, the A75 is subject to the national speed limit of 60mph, reducing to 30mph on the approaches to and through the villages of Springholm and Crocketford, as highlighted in Figure 2‑13. Speed management schemes are in place in Springholm and Crocketford, which include speed limit gateway features, road markings and vehicle activated speed indication signs. In addition, the traffic signal controls on entry and exit to Springholm are speed activated and switch to red if approaching vehicles are detected exceeding the 30mph speed limit. In addition to the speed activated signals, signal-controlled pedestrian crossings are located north of Victoria Street, leading to Springholm Primary School and to the east of the A712 Maiden Row junction in Crocketford.
Outwith the assessment corridor, the remainder of the A75 operates under the national speed limit for single carriageway (60mph) and dual carriageway (70mph) roads except at the section of the route where a 50mph speed limit is in operation where the A75 passes adjacent to the village of Castle Kennedy. At its westernmost extent, the speed limit is reduced to 30mph again through Stranraer.
Lay-bys and Rest Areas
Figure 2‑14 highlights the 13 lay-bys within the assessment corridor; six in the eastbound direction and seven in the westbound direction which serve the following functions: provide safe stopping areas for drivers traveling in either direction, offer emergency refuge areas and facilitate short-term parking for maintenance vehicles or emergency services. No formal HGV or large vehicle rest areas were identified in the assessment corridor.
Traffic Data
Annual Average Daily Traffic (AADT) flows along the existing A75 have been determined using Automatic Traffic Counter (ATC) data obtained from Transport Scotland’s National Traffic Data System. The assessment corridor contains two permanent ATC sites. Additionally, there are three ATC sites situated outside the assessment corridor edges; one east of Drummore Roundabout, another east of Garroch Roundabout and the third south of Allanton Roundabout. There are varying degrees of reliability at each site and therefore the most representative months and year has been selected for analysis.
The ATC located in Crocketford (JTC00375) recorded 64% coverage for 2024, missing data for most of January and from September through to the end of December. As the months missing data include the typically lowest traffic volumes, it was determined that the AADT flow recorded for 2024 would not be representative of typical conditions. Consequently, 2023 data has been utilised as the next best year with sufficient coverage to be representative of AADT. The 2023 AADT at the site in Crocketford was 9,300. The most reliable data is reported from a counter situated 2km south of Springholm (ATC115321), which achieved 100% coverage for 2024 and recorded an AADT of 9,000.
Based on the most recent available data, the estimated daily traffic flow ranges from approximately 6,200 (south of Allanton Roundabout, near Castle Douglas) – 16,000 (east of Garroch Roundabout, near Dumfries) vehicles. Traffic levels generally drop from Garroch Roundabout towards Allanton Roundabout throughout the assessment corridor from east to west. The range of AADT flows recorded is shown in Table 2‑4.
|
A75 Section |
AADT (rounded to nearest 100) |
|
A75 south of Allanton Roundabout (Castle Douglas) (2024) |
6,200 |
|
A75 South of Springholm (2024) |
9,000 |
|
A75 Crocketford (2023) |
9,300 |
|
A75 east of Drummore Roundabout (2024) |
10,700 |
|
A75 east of Garroch Roundabout (2024) |
16,000 |
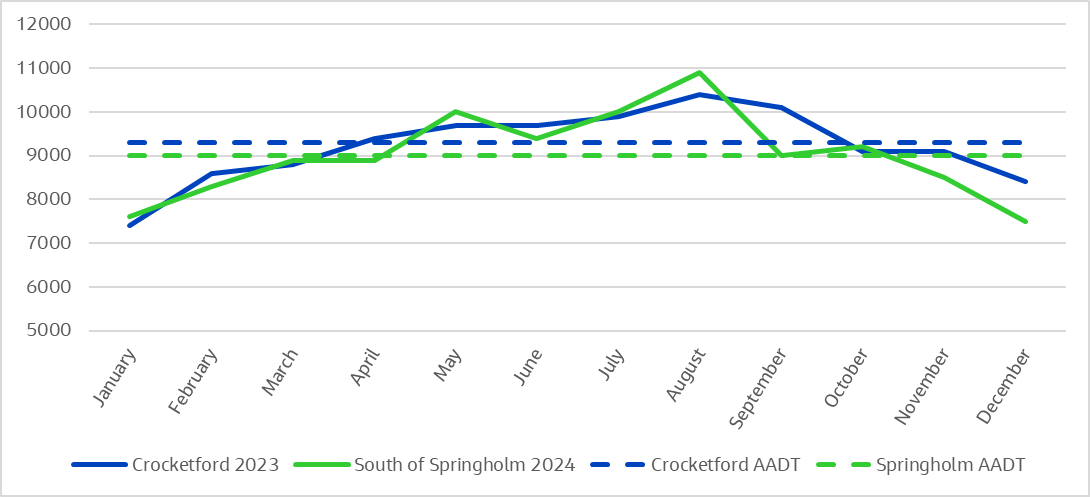
AADT flows for the period 2012-2024 show that the two counter locations near the villages saw, on average, AADT flows of approximately 9,000 over the 13-year period. However, AADT flows in Crocketford in 2024 were higher than historic years analysed (excluding COVID-19 impacted years of 2020 and 2021) and flows south of Springholm were typical of historic years (excluding COVID-19 impacted years).
Analysis of AADT flows in Springholm in 2024 and Crocketford in 2023 show that a typical weekday morning peak occurs at 08:00, which is followed by relatively consistent traffic volumes throughout the day until the evening peak is observed between 15:00 and 18:00. Weekend traffic volumes demonstrate a different pattern, with a slower build-up and peak occurring later, around 11:00. Figure 2‑15 illustrates the average daily traffic volume south of Springholm and in Crocketford, based on data from ATC115321 and JTC00375 respectively.
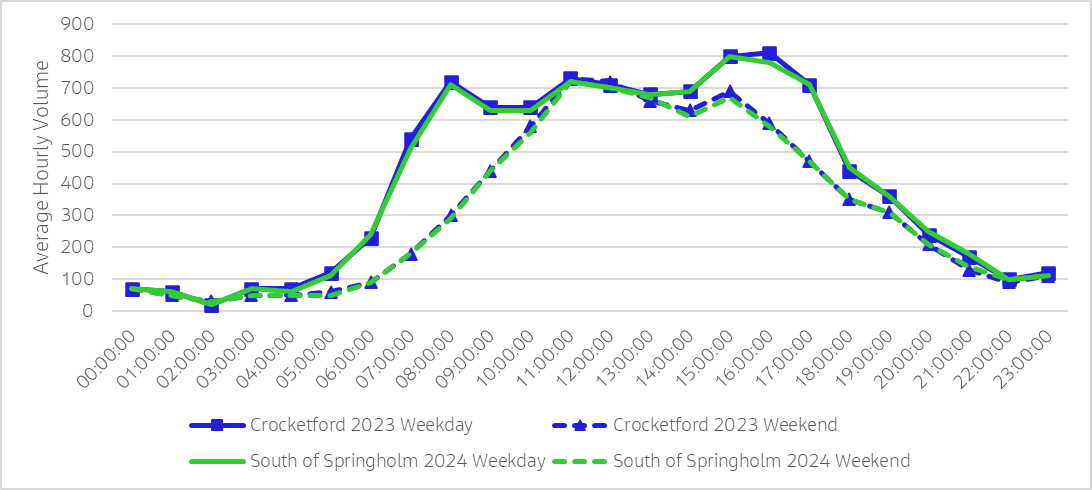
Further to this, Figure 2‑16 illustrates the average daily traffic volume by month recorded at the Crocketford and South of Springholm traffic counters, using the most recent year with complete data. Monthly traffic volume trends suggest seasonal traffic patterns on the A75, with noticeably higher volumes during summer. August consistently recording the highest traffic volumes at both locations. Springholm experiences a peak of 10,900 vehicles in August, while Crocketford reaches 10,400, representing increases of 21% and 12% over the respective AADTs of 9,000 and 9,300. These summer peaks likely reflect increased tourism and holiday travel in the region, in particular to travelling to Northern Ireland. Conversely, winter months, particularly December and January, show the lowest traffic volumes, with Springholm's January count of 7,600 and Crocketford's 7,100.
The counters also report information on flows by vehicle class and speed, as seen in Table 2‑5. Not all years of the 13-year period have data available, therefore the most recent year with data has been used to report baseline speed and vehicle class statistics. The Heavy Goods Vehicles (HGVs) as a percentage of total vehicles was between 12% and 16%, and speeds were approximately 52 miles per hour on the A75 south of Springholm, and between 25 and 28mph within Crocketford. Again, there were marginal differences in speed and percentage HGV between directions.
|
Location |
Eastbound |
Westbound |
|
Daily Percentage HGV-South of Springholm (2024) |
14% |
13% |
|
Daily Percentage HGV-Crocketford (2019) |
16% |
16% |
|
Mean Speed (mph)-South of Springholm (2024) |
53 |
52 |
|
Mean Speed (mph)-Crocketford (2019) |
25 |
28 |
Analysis of journey time has been evaluated using data collected from INRIX for the A75 assessment corridor showing that the average journey times, for both eastbound and westbound traffic, were approximately 16 and 15 minutes during weekdays and weekends respectively. Further analysis of daily journey times for 2024 on a monthly basis show that despite an increase in AADT during summer months there does not appear to be any significant adverse impact on journey times between Castle Douglas and Dumfries.
When incidents or planned maintenance occur on the A75, the recommended diversion routes are often via minor roads that pass through small villages and can result in significantly longer journey distances and increased travel times. The recommended diversion route between Garroch Loaning (Dumfries) and Haugh of Urr Road End (South of Springholm), the main diversion route within the assessment corridor, is approximately 28km, adding an additional 9km of distance travelled compared to the A75 itself. The longest recommended diversion route for the A75 is for a closure between Cardoness Castle Junction (Gatehouse of Fleet) and Calgow Junction (Newton Stewart). This diversion adds approximately 105km to the journey for both eastbound and westbound traffic compared to the A75.
Accident Locations and Severity
This section summarises road accidents that occurred on the A75 between Stranraer and Gretna over the period 2012 to 2024. Accident data, disaggregated by severity, is also shown for select five-year periods as can be seen in Figure 2‑17. Note that for Figure 2‑17, Serious includes accidents that were classified as Very Serious, Moderately Serious and Less Serious for 2019 onwards.
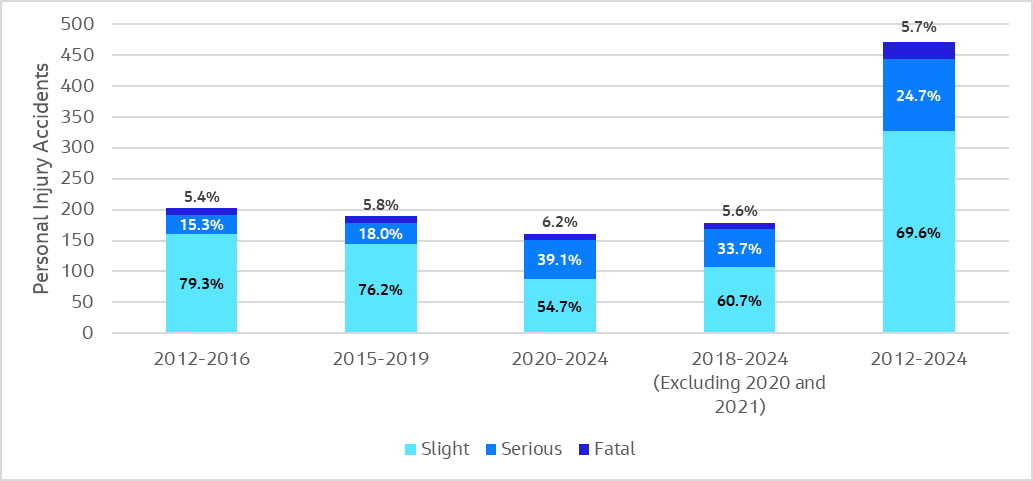
Accident data analysis shows that over the full 2012 to 2024 period 5.7%, 24.7% and 69.9% of accidents were recorded as fatal, serious and slight respectively. Disaggregating into five-year periods shows the same trends in terms of accident severity between the 2012 to 2016 period and the 2015 to 2019 period with a very similar proportion of fatal accidents, albeit with some variation in the proportion of accidents that are serious or slight. Over the period 2020 to 2024 inclusive a different trend in accident severity is evident particularly for serious and slight accidents. Given the change in travel patterns recorded throughout the COVID-19 pandemic and the considerable reduction in vehicles travelling on the road network, accidents and the associated severities recorded over this period may not be representative of the accident characteristics on the A75. Therefore, data was also analysed for the period 2018 to 2024 excluding 2020 and 2021 (where travel was impacted by COVID-19) to identify the severity proportions excluding the COVID-19 affected years.
As Figure 2‑17 shows, the proportion of fatal accidents remains very similar across all the periods analysed, varying by less than 1%. However, the proportion of accidents that were recorded as serious was significantly higher in both the 2020 to 2024 period and the 2018 to 2024 period (excluding 2020 and 2021) at approximately 39% and 34% respectively, compared to the earlier time periods. Similarly, the proportion of slight accidents recorded in the 2020 to 2024 period and the 2018 to 2024 period (excluding 2020 and 2021) is significantly lower at between approximately 55% and 61%, than the proportions analysed for the earlier time periods analysed. It appears, therefore, that whilst accident data was likely affected by the COVID-19 pandemic, the analysis also indicates that there may be inherent differences in severity rates when comparing the more recent data to the older periods data.
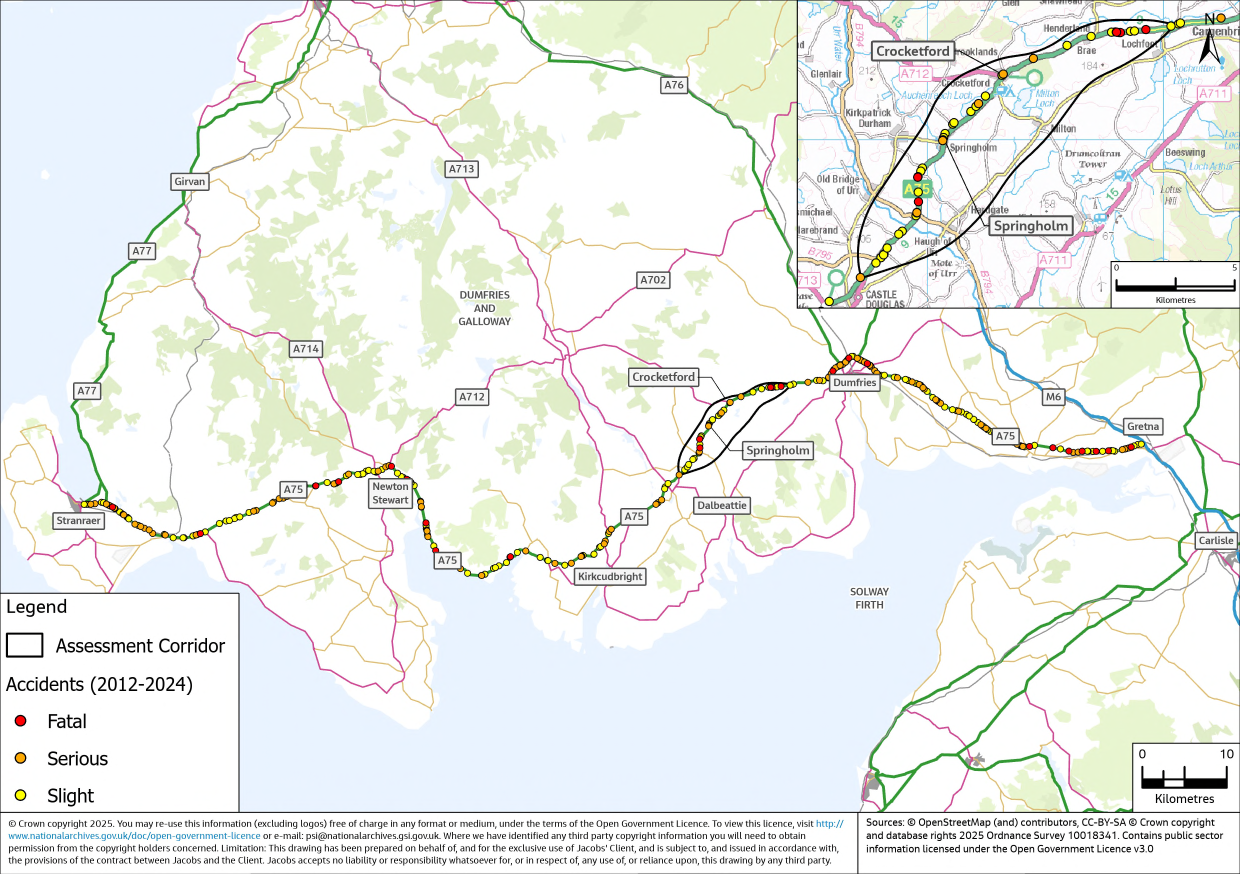
The locations of accidents on the A75 including within the immediate vicinity of the assessment corridor between the period 2012 to 2024 (excluding 2020 and 2021) can be seen in Figure 2‑18.
Accident rates have also been calculated for the full A75 route between Gretna (to/from the A74(M) Slip Road) and Stranraer (to/from the A75/A77 Innermessan junction), as well as for Crocketford and Springholm. These rates have been compared to the national rates for built-up and non-built-up areas, with built-up rates compared to Crocketford and Springholm, and non-built-up rates used for the full A75 route.
Table 2‑6 and Table 2‑7 provide the accident rates for the A75 and Crocketford and Springholm respectively, as well as the national rates. Accident rates are expressed in Personal Injury Accidents (PIA) per Million Vehicle Kilometres (MvKM). This metric allows for a standardised comparison of accident frequencies across different road sections and national averages, taking into account both the number of PIAs and the volume of traffic on each road segment (note: the national accident rate is only currently available to the end of 2023; however, this does not materially impact the comparison ratio shown). Figures pre and post COVID-19 have also been included, with the post COVID-19 figures representing a shorter time period that may not fully reflect long-term trends.
|
Period |
A75 Accident Rate (PIA/MvKM) |
National Accident Rate - Non-Built Up (PIA/MvKM) |
Local/National Accident Rate Ratio |
|
2012-2024 |
0.085 |
0.080 |
1.1 |
|
2012-2024 (Excluding 2020-2021) |
0.088 |
0.085 |
1.0 |
|
2012-2019 (Pre-COVID) |
0.091 |
0.093 |
1.0 |
|
2018-2024 (Excluding 2020-2021) |
0.079 |
0.064 |
1.2 |
|
2022-2024 (Post-COVID) |
0.084 |
0.055 |
1.5 |
The A75's accident ratio for the entire 2012-2024 period is 1.1 times the national rate, with 0.085 PIA/MvKM compared to the national 0.08 PIA/MvKM. In the pre COVID-19 period (2012-2019), the ratio was 1.0, indicating parity with the national rate. However, the period of 2022 to 2024, after the travel restrictions imposed during COVID-19 pandemic were lifted (post COVID-19) shows a marked increase, with the ratio rising to 1.5. The most recent years (2018-2024, excluding 2020-2021) demonstrate a ratio of 1.3, though it's important to note this doesn't represent a full 5-year assessment period.
|
Period |
Crocketford Accident Rate (PIA/MvKM) |
Springholm Accident Rate (PIA/MvKM) |
National Accident Rate - Built Up (PIA/MvKM) |
Crocketford/ National Accident Rate Ratio |
Springholm/ National Accident Rate Ratio |
|
2012-2024 |
0.096 |
0.086 |
0.134 |
0.7 |
0.6 |
|
2012-2024 (Excluding 2020-2021) |
0.111 |
0.099 |
0.147 |
0.8 |
0.7 |
|
2012-2019 (Pre-COVID) |
0.077 |
0.082 |
0.167 |
0.5 |
0.5 |
|
2018-2024 (Excluding 2020-2021) |
0.119 |
0.087 |
0.077 |
1.5 |
1.1 |
|
2022-2024 (Post-COVID) |
0.194 |
0.146 |
0.065 |
3.0 |
2.2 |
The long-term trend (2012-2024) shows both villages with lower accident rates than the national average (0.134 PIA/MvKM), with Crocketford at 0.096 PIA/MvKM (ratio 0.7) and Springholm at 0.086 PIA/MvKM (ratio 0.6). This trend persists even when excluding COVID-19 affected years.
However, recent years show a shift. For 2018-2024 (excluding COVID-19 years), both villages exceed the national average. The period of 2022 to 2024, after the travel restrictions imposed during COVID-19 pandemic were lifted (post COVID-19) shows the highest rates, with Crocketford at 0.194 PIA/MvKM (ratio 3.0) and Springholm at 0.146 PIA/MvKM (ratio 2.2), compared to the national rate of 0.065 PIA/MvKM. However, this shorter timeframe may not indicate a long-term trend.
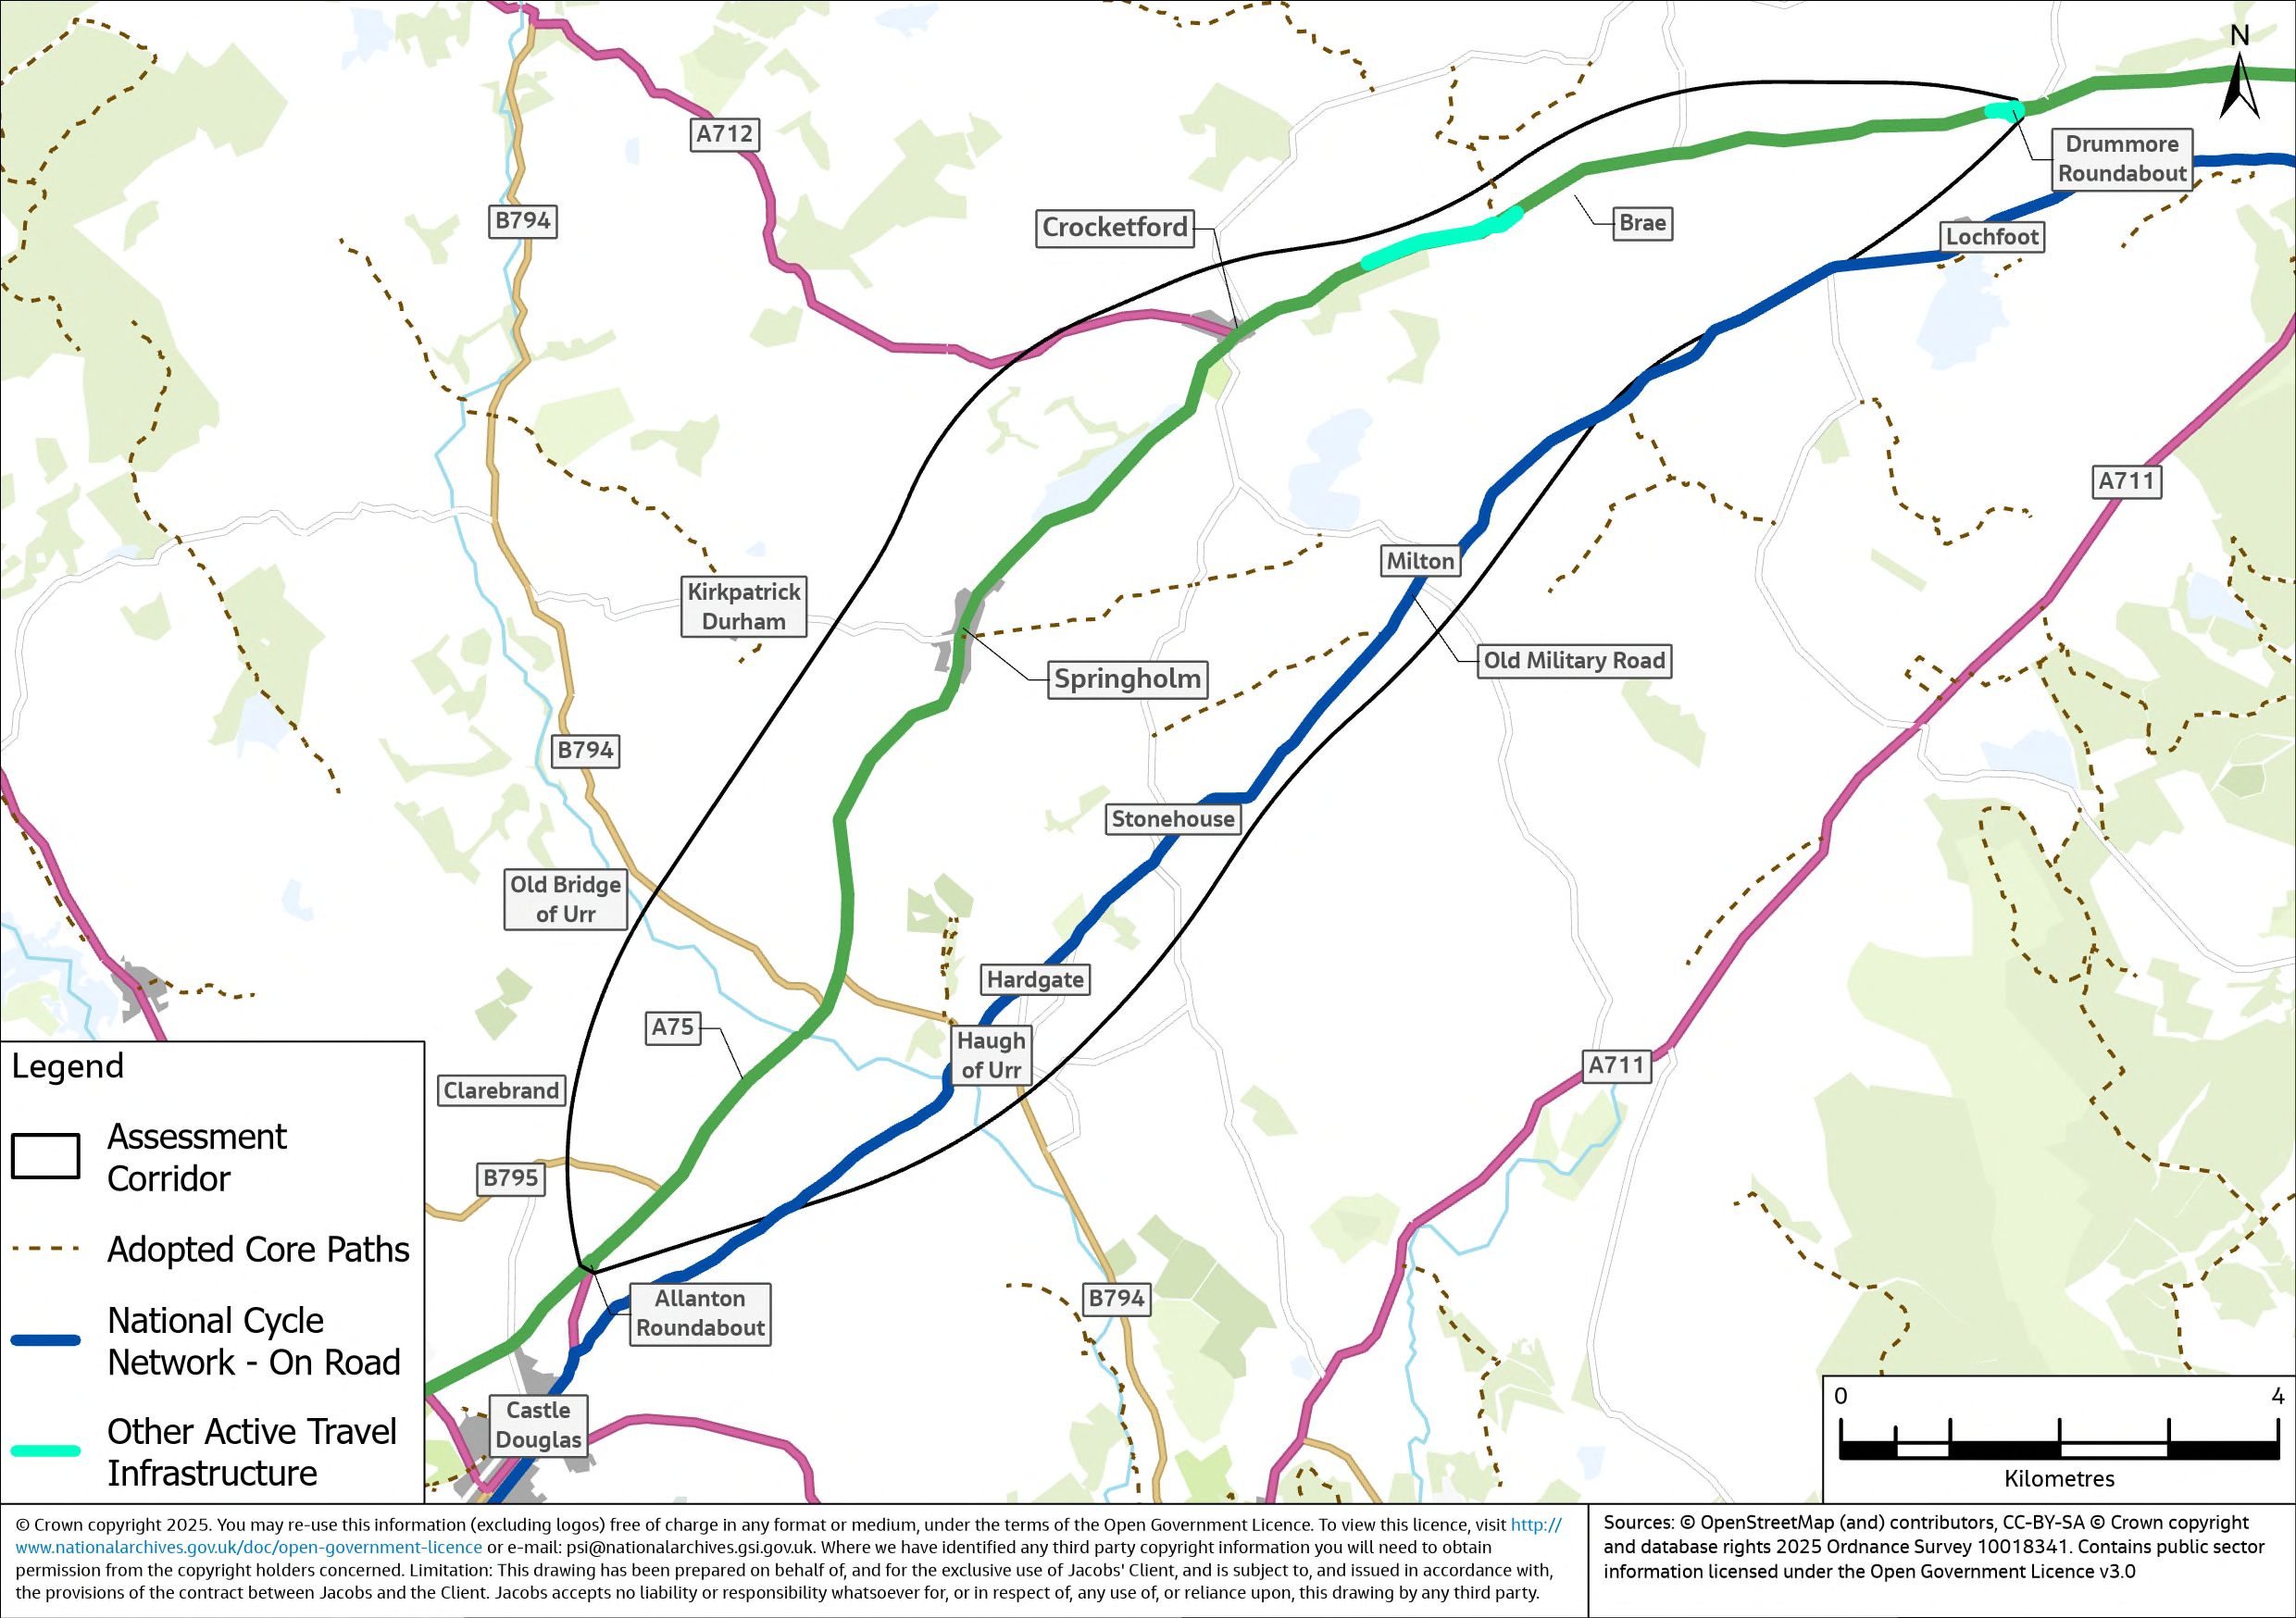
Active Travel Provision
This section summarises the existing active travel provision of relevance to the assessment corridor. There are sections of two National Cycle Network (NCN) routes in Southwest Scotland: NCN Route 7 and NCN Route 83. NCN Route 7, which connects Newton Stewart to Dumfries and generally runs parallel to the A75 between Castle Douglas and Dumfries, along Old Military Road. The provision is largely on road with some off road, traffic free provision in the towns. Beyond the assessment corridor, NCN Route 7 connects with Route 83 in Newton Stewart with onward connection to Stranraer, as well as further connections in the east beyond Gretna and into the north of England.
The assessment corridor and the wider area also encompasses various core paths promoted by Dumfries and Galloway Council.
A dedicated shared-use path has been implemented to facilitate active travel modes on the westbound approach to Crocketford, running parallel to the climbing lane. This infrastructure is an exception as the majority of provision within the assessment corridor is on road and thus shared with general traffic.
Figure 2‑19 shows National Cycle Network routes, core paths and other active travel infrastructure in the assessment corridor.
Public Transport Provision
Bus Network
There are several bus services in operation in the settlements along the A75 corridor. The A75 route between Stranraer and Dumfries is covered by the Stagecoach West Scotland 500 bus service, stopping at most of the towns and villages along the route including Springholm and Crocketford. To traverse the entire A75 corridor, passengers must connect to the service 79 bus at Dumfries to continue their journey to Gretna. In addition, Stagecoach operates services 75 and 416 providing connections between Newton Stewart and Stranraer, and services 79 and 179 connecting Dumfries to Gretna and Carlisle. It should be noted that in June 2025, Stagecoach announced that it would be ending most of its services in the Dumfries and Galloway region including the 500 service which operates along the A75. At the time of writing, it is not known whether another operator will take over the routes currently operated by Stagecoach, which came to an end in August 2025.
Public transport services in the assessment corridor and surrounding regional area are provided by multiple operators. McCalls Coaches and Dumfries and Galloway Council offer services that serve both Springholm and Crocketford. Houston Coaches also operates in the region; however, their routes do not include stops in either Springholm or Crocketford. The 502 and 503 services operated by McCalls stop in both Springholm and Crocketford and provide connections between Dumfries and Castle Douglas. Dumfries and Galloway Council operate service number 555 which stop in both Springholm and Crocketford, running between Dumfries and Castle Douglas / Kirkcudbright.
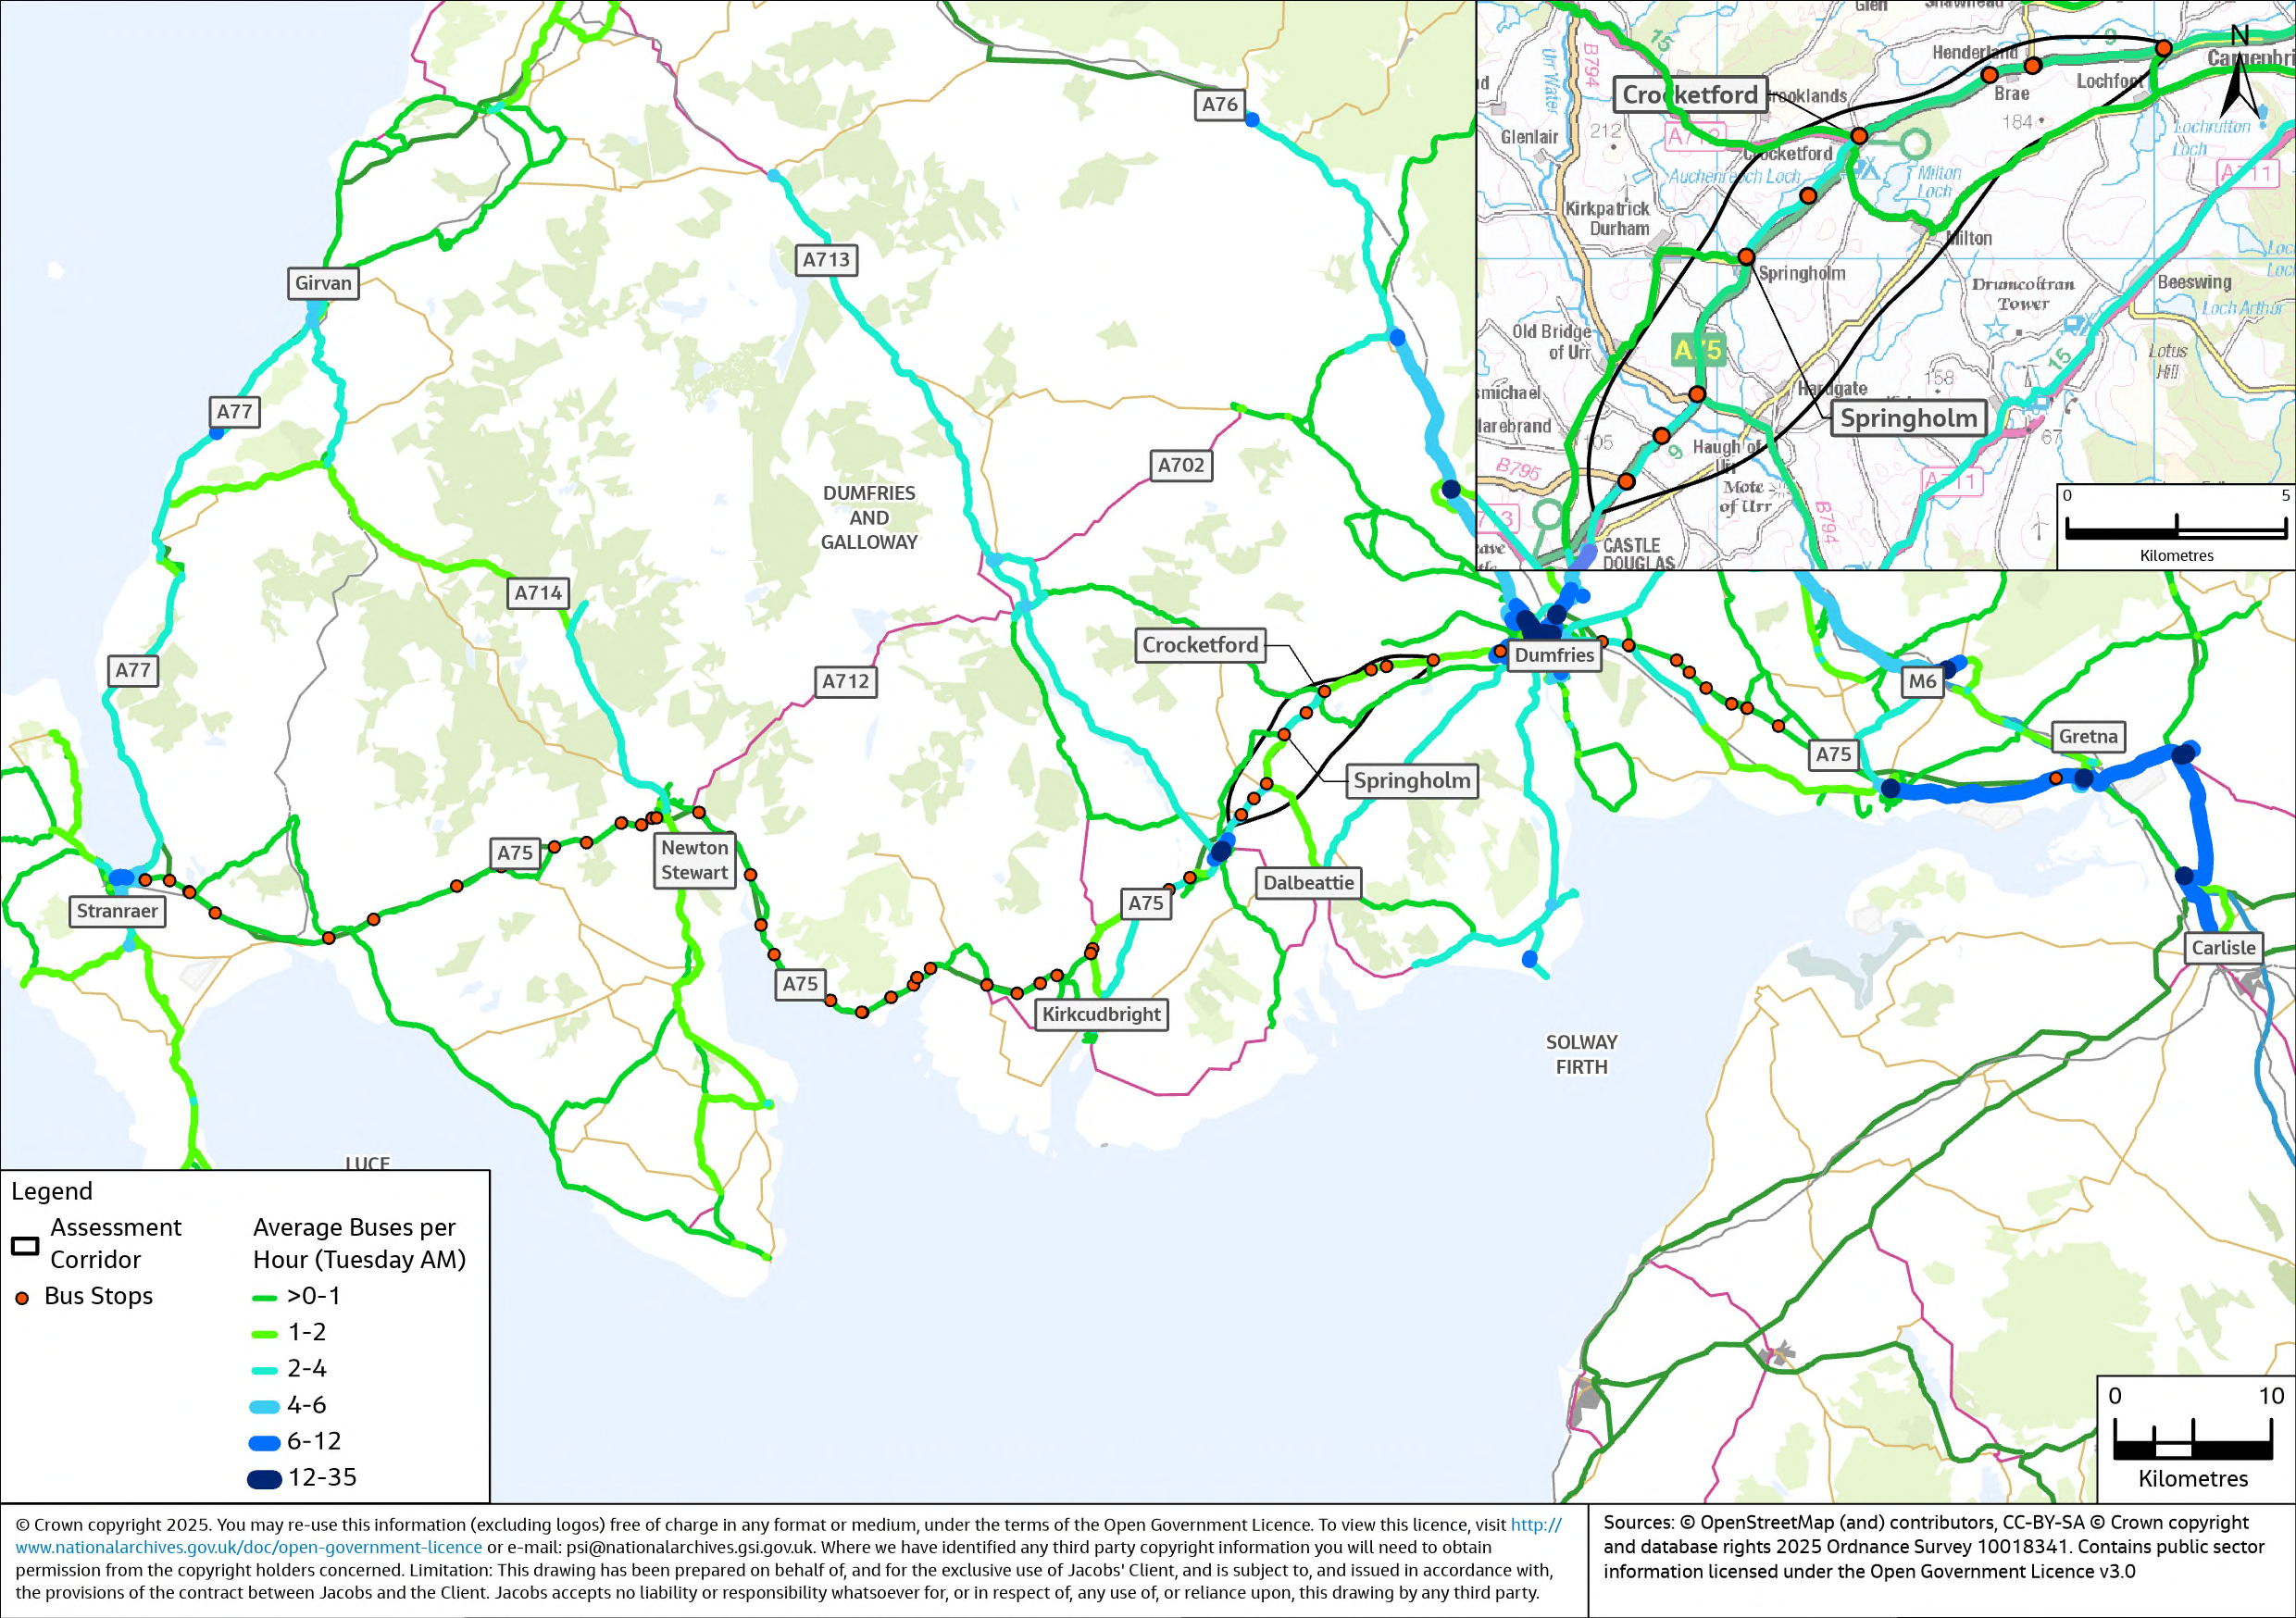
Table 2‑8 provides a summary of the bus services that operate within the assessment corridor along with their approximate weekday frequency. Figure 2‑20 presents the average number of buses per hour that travel in the region and along the A75, based on information collated for bus operation in May 2025.
| Service No. | Route | Operator | Approx. Frequency |
|---|---|---|---|
|
75 |
Stranraer – Newton Stewart |
Stagecoach West Scotland |
2 per day (Monday-Friday) |
|
79 |
Dumfries - Annan - Gretna - Carlisle / Annan - Gretna - Carlisle |
Stagecoach West Scotland |
27 per day (Monday-Friday) |
|
179 |
Dumfries - Annan - Gretna - Carlisle / Annan - Gretna - Carlisle |
Stagecoach West Scotland |
5 per day (Monday-Saturday) |
|
373 |
Dumfries - Terregles - Shawhead |
Houstons Coaches |
5 per day (Monday-Saturday) |
|
379 |
Annan - Gretna |
Houstons Coaches |
5 per day (Monday-Friday) |
|
385 |
Dumfries - Carrutherstown - Dalton - Annan |
McCalls Coaches |
7 per day (Monday-Saturday) |
|
416 |
Newton Stewart - Stranraer |
Stagecoach West Scotland |
4 per day (Monday-Friday) |
|
500 |
Dumfries - Stranraer |
Stagecoach West Scotland |
6 per day (Monday-Friday) |
|
502 |
Dumfries - Castle Douglas |
McCalls Coaches |
5 per day (Monday-Saturday) |
|
502 A |
Kirkcudbright - Castle Douglas |
McCalls Coaches |
12 per day (Monday-Saturday) |
|
503 |
Dumfries - Springholm - Castle Douglas |
McCalls Coaches |
8 per day (Monday-Saturday) |
|
555 |
Dumfries - Castle Douglas / Dumfries - Kirkcudbright |
Dumfries and Galloway Council Buses |
2 per day (Monday-Friday) |
Ferry Services
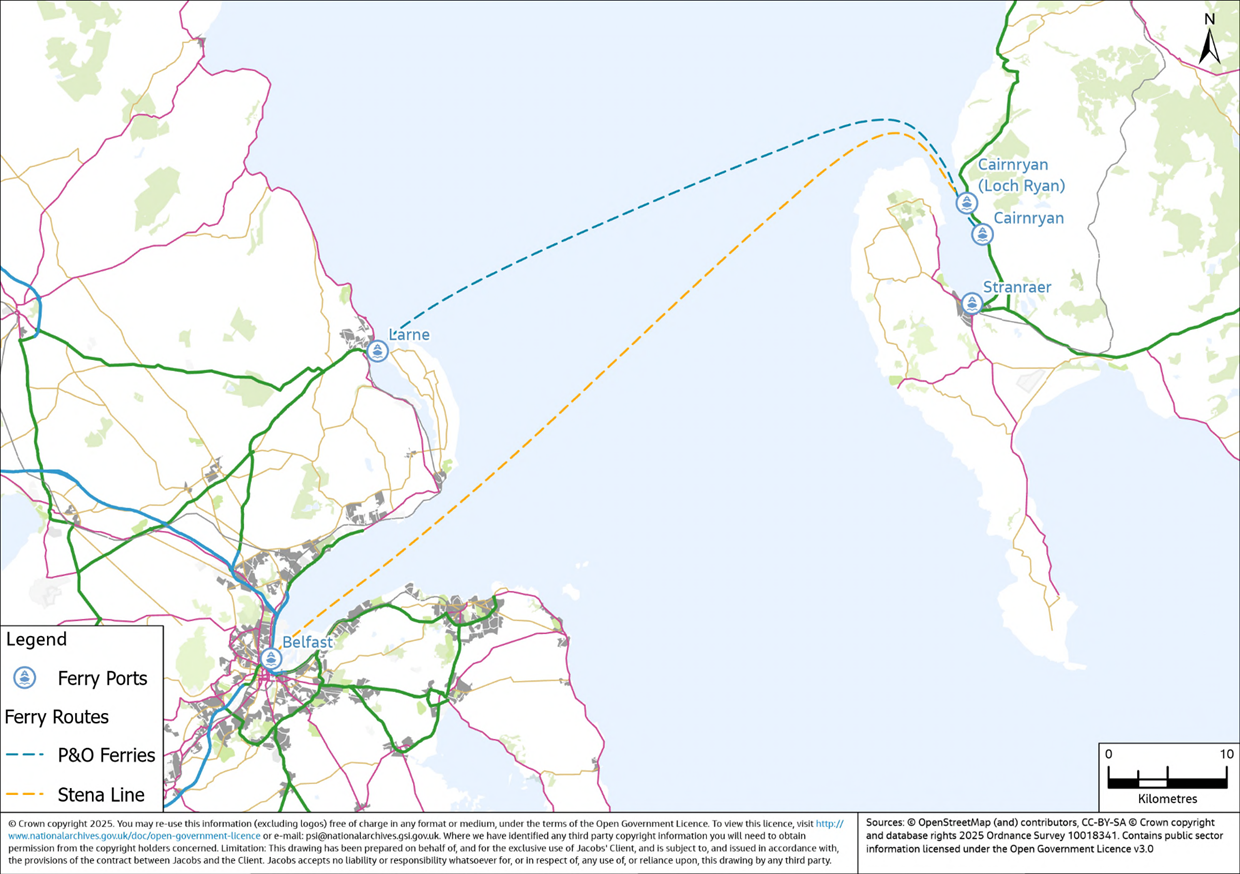
This section outlines the current ferry services and routes operating from the ports at Cairnryan (including Loch Ryan Port, 1.5 miles North of Cairnryan Port), based on information collated on services available as of May 2025. Two commercial operators, P&O Ferries and Stena Line, provide services, each with distinct schedules as follows:
- P&O Ferries offers a route between Cairnryan Port and Larne, located about 20 miles north of Belfast. The crossing time is approximately two hours. During the week from Tuesday to Friday there are six departures from Cairnryan, with a reduced schedule of five departures on Mondays and Saturdays and four on Sundays. P&O Ferries initiates its service at 04:00 with the last ferry embarking at 23:59.
- Stena Line operates between Loch Ryan Port and Belfast, with a crossing time of around 2 hours and 15 minutes. The Stena Line ferry service commences its daily operations with the first departure at 03:30, continuing throughout the day until the final crossing at 23:30. The schedule includes six departures from Loch Ryan from Tuesday to Friday, five on Saturdays and Mondays, and four on Sundays.
On a typical weekday, there are a total of 12 arrivals and 12 departures each day to and from the ports at Cairnryan. Figure 2‑21 shows ferry routes between ports at Cairnryan and Belfast and Larne in Northern Ireland.
Ferry and Bus Integration
A review of the ferry timetable against available bus services has been undertaken, comparing ferry departure and arrival times to the nearest available connecting bus service that allows onward travel, as detailed in Table 2‑9 and Table 2‑10. Note that for onward travel to destinations along the A75, a separate connection to another bus service is required in Stranraer. The following criteria were applied when determining viable connections:
- Arriving Ferries: A connection is considered valid if the bus departure time falls within one hour of the ferry arrival time.
- Departing Ferries: Bus services are only deemed as viable connections if they align with the specified check-in times stated by ferry companies, ensuring passengers can meet the ferry operators' requirements. Stena Line passengers must check in at least 30 minutes before the scheduled departure time and P&O passengers are required to check in 60 minutes before the scheduled departure time.
|
Ferry Company |
Daily Ferry Arrivals |
Connecting Services 358/360/60 (Cairnryan - Ayr) |
Connecting Services 358/360/60 (Cairnryan - Stranraer) |
Connecting Services 923 (Cairnryan - Ayr/Glasgow) |
|
Stena Line |
6 |
0 |
0 |
3 |
|
P&O Ferries |
6 |
0 |
0 |
0 |
|
Ferry Company |
Daily Ferry Departures |
Connecting Services 358/360/60 (Ayr - Cairnryan) |
Connecting Services 358/360/60 (Stranraer - Cairnryan) |
Connecting Services 923 (Ayr/Glasgow - Cairnryan) |
|
Stena Line |
6 |
0 |
0 |
3 |
|
P&O Ferries |
6 |
4 |
0 |
0 |