Transport and Travel in Scotland 2015 - 27 September 2016
8. New Questions and Analysis
This section contains analysis and findings from new questions added to the Scottish Household Survey questionnaire in recent years and from experimental analysis conducted on existing data.
New estimates of awareness and uptake of sustainable transport policies, including car clubs, electric vehicles, cycle hire schemes and fuel efficient driving schemes can be found in the accompanying tables 46 and 47. [Tables 46 and 47]
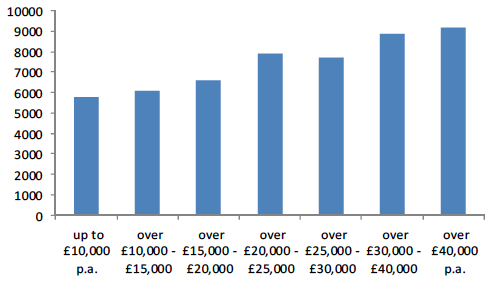
A new question was asked of car-owning respondents in the SHS in 2015 about total miles driven in the previous year – results can be found in table 48. This shows that on average, car-owning adults drove 8,000 miles in the previous year. Men tended to have driven more than women, with men driving 9,600 miles and women 6,300 miles on average. Self-employed people drove the most, with an average of 11,000 miles compared to 9,600 for full-time employees and 6,400 for part-time employees. Car mileage increased with income and was higher for rural areas. [Table 48]
Figure 5: Average (mean) distance driven in miles in the last year by annual household income, 2015
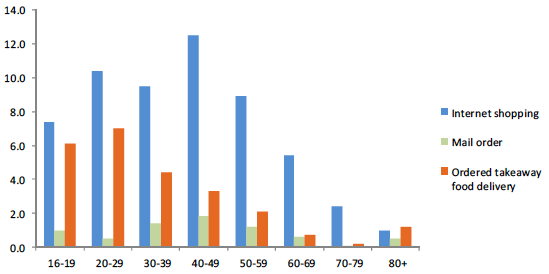
A new set of questions was asked around the use of ordering services, which asked if respondents had used supermarket delivery, internet shopping, mail order, ordered goods by phone or ordered takeaway food the previous day. Internet shopping was the most commonly used, being used by 8.5% of respondents the previous day, with takeaway food the second most common service, being used by 3.3% of respondents the previous day. The other types of delivery services had been used by around 1 percent of respondents the previous day. Further demographic breakdowns for these can be found in table TD17. Of those who used these services, only 18 percent said that this impacted on the number of journeys they made. [Table TD17]
Figure 6: Percentage of respondents who had used ordering services the previous day by age, 2015
Following an exploratory project using data from the Scottish Household Survey Travel Diary, experimental tables of annualised estimates of personal travel (trips per person per year and distance per person per year) by mode for a variety of journey lengths and demographic categories have been provided alongside the travel diary tables. These are experimental data based on a one-day travel diary and as such the absolute figures likely represent an undercount of the total volume of trips made and distance travelled by Scottish residents. We would welcome any comments or suggestions around the use of these data. [Tables can be found in the Travel Diary Excel workbook]
8. Statistical Tables
SHS Transport And Travel Tables
Table SUM1 Summary of Scottish Household Survey results
Table SUM2 Summary of Transport in Scotland
Table 1 People aged 17 or over –full driving licence: 2004-2015
Table 2 Amount spent of fuel in the past month: 2004-2015
Table 3 Frequency of walking in the previous seven days: 2004–2015
Table 3a Frequency of cycling in the previous seven days: 2004–2015
Table 4 Adults views on satisfaction* of public transport: 2010-2015
Table 5 Possession of a concessionary fare pass: 2004-2015
Table 7 Employed adults not working from home -usual method of travel to work: 2015
Table 8 Effects of traffic congestion on travel to work journey: 2007-2015
Table 10 How random adult usually travelled to work a year ago by current main mode of travel: 2008-2015
Table 10a Reason for changing mode of travel to work: 2012-2015
Table 11 Car sharing journeys to work: 2009-2015
Table 13 Employed adults method of travel to work and whether they could use public transport: 2015
Table 14 Reasons why public transport is not used for travel to work: 2008-2015
Table 15 School children in full-time education, usual method of travel: 2015
Table 16 Reasons for transport choice to children's full time education establishment: 2004-2015
Table 17 Reasons why public transport is not used by school children: 2004-2015
Table 18 Households with bicycles available for private use: 2015
Table 19 People aged 17+ that hold a full driving licence: 2015
Table 20 People aged 17+, frequency of driving: 2015
Table 21 Part driving/parking journeys: 2009-2015
Table 22 Mode of transport used in conjunction with driving by where parked: 2009-2015
Table 25a Frequency of walking in the previous seven days: 2015
Table 25b Frequency of cycling in the previous seven days:2015
Table 26 Reasons why do not cycle to work: 2009-2015
Table 28 Adults use of local bus and train services, in the past month: 2015
Table 29 Adults (16+) who have used the bus in the previous month, views on their local bus services: 2015
Table 30 Adults (16+) who have used the train in the previous month, views on their local train services: 2015
Table 31 Possession of concessionary fare pass for all adults aged 16+: 2015
Table 32 Possession of concessionary fare pass for all adults aged 60+: 2015
Table 33 Access to services that respondents thought were very or fairly convenient: 2015
Table 37a & 37b Whether taken flights for leisure in the last 12 months: 2012-2015
Table 38 & 38b Whether taken flights for business in the last 12 months: 2012-2015
Table 39 Reasons for choosing flying within the UK over other modes of transport: 2012-2015
Table 40 Ferry use, journey purpose and reasons for choosing mode: 2012-2015
Table 41 In general, What discourages you from using buses more often than you do?: 2012-2015
Table 42 & 42a In general, What discourages you from using trains more often than you do?: 2012-2015
Table 43 In general, What discourages you from walking more often than you do?: 2012-2015
Table 44 Purpose of train journeys: 2012-2015
Table 45 Difficulties experienced when changing between public transport: 2015
Table 46 Awareness of sustainable transport policies, 2015
Table 47 Uptake of sustainable transport policies (of those who were aware of the policy), 2015
Table 48 Annual car mileage (those who own a car which they use for transport), 2015
SHS Travel Diary Tables
Table TD1 Percentage of adults travelling on previous day: 2004-2015
Table TD2 Percentage of journeys made by main mode of travel: 2004-2015
Table TD2a Percentage of journeys by main mode of travel and distance: 2015
Table TD2b Percentage of stages by main mode of travel: 2004-2015
Table TD2c NEW - Multi Stage journeys
Table TD3 Percentage of journeys made by purpose of travel: 2004-2015
Table TD4 Percentage of journeys made by distance of travel: 2004-2015
Table TD4a Percentage of journeys made by distance and main mode of travel: 2015
Table TD5 Distance summary statistics: 2004-2015
Table TD5a Distance summary statistics by mode of transport: 2015
Table TD6 Percentage of journeys made by duration of journey: 2004-2015
Table TD7 Percentage of journeys made by start time of journey: 2004-2015
Table TD8 Percentage of journeys made by day of travel: 2004-2015
Table TD9 Percentage of car stages by car occupancy: 2004-2015
Table TD10 Percentage of car/van stages delayed by congestion: 2004-2015
Table TD10a Reason for congestion for car/van stages: 2013-2015
Table TD11 Percentage of bus stages where passenger experienced delay: 2004-2015
Table TD12 Percentage of driver stages where delay experienced by amount of delay: 2015
Table TD13 Percentage of journeys originating in each council area by destination council area: 2004-2015 (combined)
Table TD14 Percentage of journeys ending in each council area by area of origin: 2004-2015 (combined)
Table TD15 Percentage of employed people resident in each council area by council area of workplace: 2004-2015 (combined)
Table TD16 Percentage of employed people in each council area by council area of residence: 2004-2015 (combined)
Table TD17 Use of ordering services the previous day, 2015
Annex A Road network distance
Table A 95% confidence limits for estimates, based on SHS sub-samples sizes
Tables TD2a to TD5a Distance estimates calculated using road network
Table TD3 Uncorrected historical series presented for continuity
Experimental data tables – annualised estimates of personal travel
Local Authority Analysis of SHS Data
Local Authority tables will be published online at http://bit.ly/TATIS2014-LA
1. The apparent year-to-year fluctuations in some of the figures may be due to sampling variability.
2. Employed adults (aged 16+) not working from home
3. The Travel diary methodology changed in 2007 and in 2012, creating a break in the time series.
4. From 2012 Q4 the question was changed to ask about access to cars / vans instead of just cars.
| 2004 | 2005 | 2006 | 2007 | 2008 | 2009 | 2010 | 2011 | 2012 | 2013 | 2014 | 2015 | |
|---|---|---|---|---|---|---|---|---|---|---|---|---|
| column percentages | ||||||||||||
| Modal share of all journeys 3 | ||||||||||||
| Walking | 15.3 | 13.5 | 13.6 | 22.0 | 22.2 | 21.8 | 22.0 | 22.1 | 26.0 | 23.3 | 25.0 | 21.6 |
| Driver car/van | 52.7 | 54.6 | 54.5 | 50.2 | 49.8 | 51.0 | 51.1 | 49.9 | 48.3 | 50.0 | 48.1 | 49.7 |
| Passenger car/van | 15.8 | 15.4 | 15.4 | 13.4 | 13.8 | 13.3 | 14.3 | 13.1 | 12.7 | 13.6 | 13.0 | 13.3 |
| Bicycle | 0.8 | 0.9 | 0.9 | 0.7 | 1.0 | 0.9 | 0.8 | 1.3 | 1.2 | 1.0 | 1.4 | 1.2 |
| Bus | 10.3 | 10.4 | 11.2 | 9.3 | 9.1 | 8.6 | 8.7 | 9.1 | 8.1 | 8.5 | 8.6 | 9.5 |
| Taxi/minicab | 1.9 | 2.2 | 1.6 | 1.5 | 1.5 | 1.4 | 0.8 | 1.3 | 1.3 | 1.6 | 1.2 | 1.3 |
| Rail | 1.7 | 1.9 | 1.8 | 1.7 | 1.6 | 1.9 | 1.4 | 2.0 | 1.8 | 1.7 | 2.1 | 1.7 |
| Other | 1.4 | 1.2 | 0.9 | 1.1 | 1.0 | 1.0 | 1.0 | 1.2 | 0.7 | 0.3 | 0.6 | 0.6 |
| Sample size (=100%) | 27,120 | 24,660 | 25,220 | 20,520 | 20,450 | 18,680 | 16,300 | 17,590 | 19,740 | 20,180 | 19,930 | 18,710 |
| Place of work | ||||||||||||
| Works from home | 9.0 | 11.1 | 10.7 | 11.2 | 10.0 | 11.4 | 10.1 | 10.6 | 13.2 | 13.3 | 13.1 | 14.1 |
| Does not work from home | 91.0 | 88.9 | 89.3 | 88.8 | 90.0 | 88.6 | 89.9 | 89.4 | 86.8 | 86.7 | 86.9 | 85.9 |
| Sample size (=100%) | 7,060 | 6,840 | 6,850 | 5,890 | 6,090 | 6,100 | 5,860 | 6,190 | 4,730 | 4,850 | 4,810 | 4,670 |
| Travel to work 2 | ||||||||||||
| Walking | 12.7 | 12.7 | 13.8 | 11.9 | 12.5 | 12.3 | 13.4 | 12.9 | 13.6 | 12.9 | 12.9 | 13.6 |
| Car or Van | 67.0 | 67.4 | 66.8 | 68.0 | 66.0 | 67.0 | 67.3 | 66.6 | 67.3 | 66.2 | 67.7 | 65.9 |
| Driver | 58.9 | 59.8 | 59.8 | 61.3 | 59.9 | 60.7 | 61.0 | 59.1 | 61.4 | 60.6 | 61.6 | 60.3 |
| Passenger | 8.1 | 7.5 | 7.0 | 6.7 | 6.1 | 6.4 | 6.3 | 7.5 | 6.0 | 5.6 | 6.0 | 5.6 |
| Bicycle | 1.9 | 1.6 | 2.0 | 1.7 | 2.3 | 2.4 | 2.3 | 2.0 | 2.0 | 2.5 | 2.6 | 2.2 |
| Bus | 12.7 | 12.1 | 11.8 | 12.7 | 12.1 | 12.1 | 10.8 | 12.0 | 10.1 | 11.3 | 10.2 | 11.2 |
| Rail, including underground | 3.5 | 3.9 | 3.6 | 3.5 | 4.3 | 3.9 | 3.6 | 3.9 | 4.3 | 4.0 | 4.2 | 4.4 |
| Other | 2.3 | 2.3 | 2.0 | 2.3 | 2.7 | 2.3 | 2.7 | 2.6 | 2.6 | 3.1 | 2.5 | 2.7 |
| Sample size (=100%) | 6,360 | 6,040 | 6,070 | 5,180 | 5,440 | 5,370 | 5,220 | 5,510 | 4,100 | 4,160 | 4,130 | 3,950 |
| % Public and Active Travel (National Indicator 48) | 30.7 | 30.4 | 31.2 | 29.7 | 31.2 | 30.7 | 30.1 | 30.8 | 30.1 | 30.7 | 29.8 | 31.4 |
| Travel to school | ||||||||||||
| Walking | 51.2 | 52.5 | 51.1 | 52.8 | 48.8 | 50.0 | 49.7 | 50.6 | 51.4 | 51.7 | 51.2 | 48.8 |
| Car or Van | 21.6 | 21.0 | 21.7 | 21.9 | 23.6 | 24.4 | 23.0 | 23.4 | 24.1 | 24.4 | 24.5 | 25.8 |
| Bicycle | 1.0 | 0.6 | 0.9 | 0.8 | 1.5 | 1.0 | 1.4 | 1.4 | 0.8 | 1.2 | 1.7 | 1.2 |
| Bus (school or service) | 23.6 | 23.6 | 23.7 | 21.9 | 23.9 | 22.0 | 23.9 | 21.7 | 21.1 | 19.9 | 20.3 | 21.0 |
| School bus | 16.9 | 16.5 | 17.0 | 14.8 | 16.5 | 16.0 | 16.1 | 15.1 | 14.9 | 14.5 | 14.5 | 15.3 |
| Service bus | 6.7 | 7.1 | 6.7 | 7.1 | 7.3 | 5.9 | 7.8 | 6.6 | 6.2 | 5.4 | 5.8 | 5.7 |
| Rail, including underground | 0.9 | 0.7 | 1.2 | 0.9 | 0.7 | 0.7 | 0.3 | 0.7 | 0.4 | 0.6 | 0.7 | 1.1 |
| Other | 1.8 | 1.6 | 1.3 | 1.7 | 1.5 | 1.8 | 1.7 | 2.2 | 2.2 | 2.2 | 1.7 | 2.1 |
| Sample size (=100%) | 3,350 | 3,270 | 3,240 | 2,520 | 2,750 | 2,880 | 2,680 | 2,720 | 1,920 | 1,980 | 1,980 | 1,880 |
| Household access to car4 / bike | ||||||||||||
| No car | 33.8 | 31.7 | 32.0 | 30.3 | 30.2 | 30.7 | 30.3 | 30.1 | 31.0 | 30.2 | 30.8 | 30.0 |
| One car | 43.0 | 44.5 | 43.7 | 44.3 | 43.9 | 43.7 | 44.0 | 44.5 | 43.0 | 44.0 | 43.3 | 43.3 |
| Two Cars | 19.9 | 20.5 | 20.5 | 21.4 | 21.9 | 21.5 | 21.6 | 21.0 | 21.3 | 21.3 | 21.1 | 21.7 |
| Three or more cars | 3.4 | 3.3 | 3.8 | 4.0 | 4.0 | 4.2 | 4.1 | 4.4 | 4.7 | 4.6 | 4.7 | 5.1 |
| One or more cars | 66.3 | 68.3 | 68.0 | 69.7 | 69.8 | 69.3 | 69.7 | 69.9 | 69.0 | 69.8 | 69.2 | 70.1 |
| Two or more cars | 23.3 | 23.8 | 24.4 | 25.3 | 25.8 | 25.6 | 25.7 | 25.4 | 26.0 | 25.8 | 25.9 | 26.8 |
| 1+ Bicycles which can be used by adults | 35.0 | 35.0 | 35.3 | 36.9 | 36.8 | 35.5 | 34.3 | 35.1 | 35.0 | 34.3 | 34.4 | 35.1 |
| Sample size | 15,940 | 15,390 | 15,620 | 13,410 | 13,820 | 14,190 | 14,210 | 14,360 | 10,640 | 10,650 | 10,630 | 10,330 |
| Driving (aged 17+) | ||||||||||||
| Those with a full driving licence | ||||||||||||
| Male | 75.8 | 75.7 | 75.5 | 75.8 | 76.0 | 76.2 | 75.6 | 75.6 | 75.6 | 76.0 | 75.8 | 73.4 |
| Female | 56.9 | 56.4 | 58.0 | 59.2 | 59.9 | 60.6 | 60.2 | 59.8 | 61.6 | 61.4 | 61.8 | 63.1 |
| All | 65.8 | 65.6 | 66.4 | 67.0 | 67.6 | 68.0 | 67.6 | 67.3 | 68.3 | 68.4 | 68.5 | 68.0 |
| Frequency of driving | ||||||||||||
| Every day | 41.4 | 41.8 | 40.9 | 45.2 | 44.9 | 43.4 | 41.4 | 40.7 | 42.0 | 41.9 | 40.9 | 40.9 |
| At least three times a week | 11.2 | 11.2 | 11.6 | 10.0 | 10.4 | 11.9 | 12.8 | 13.3 | 13.1 | 13.3 | 13.9 | 14.5 |
| Once or twice a week | 5.7 | 5.8 | 6.7 | 5.1 | 5.6 | 5.6 | 6.0 | 6.2 | 6.0 | 5.6 | 5.9 | 5.9 |
| At least 2-3 times a month | 0.8 | 0.8 | 1.0 | 0.9 | 1.0 | 0.9 | 0.9 | 0.9 | 0.8 | 1.0 | 0.9 | 0.8 |
| At least once a month | 0.6 | 0.5 | 0.5 | 0.6 | 0.4 | 0.4 | 0.4 | 0.4 | 0.3 | 0.5 | 0.7 | 0.5 |
| Less than once a month | 1.6 | 1.4 | 1.4 | 1.7 | 1.3 | 1.6 | 1.8 | 1.7 | 1.7 | 1.6 | 1.8 | 1.4 |
| Holds full licence, never drives | 4.5 | 4.1 | 4.4 | 3.5 | 4.0 | 4.2 | 4.3 | 4.1 | 4.5 | 4.5 | 4.3 | 4 |
| Does not have a full driving licence | 34.2 | 34.4 | 33.6 | 33.0 | 32.4 | 32.0 | 32.4 | 32.7 | 31.7 | 31.6 | 31.5 | 32 |
| Sample size (=100%) | 14,660 | 13,970 | 14,080 | 12,150 | 12,260 | 12,450 | 12,360 | 12,800 | 9,830 | 9,840 | 9,720 | 9,340 |
| Percentage of car / van stages delayed by traffic congestion | ||||||||||||
| National Indicator 4 | 11.9 | 11.6 | 12.7 | 14.4 | 13.1 | 11.0 | 10.5 | 11.2 | 9.9 | 9.7 | 11.7 | 12.5 |
| Sample size (=100%) | 14,460 | 13,780 | 14,010 | 9,260 | 9,320 | 8,680 | 7,580 | 8,310 | 9,830 | 10,200 | 9,820 | 9,315 |
| Frequency of use of local bus/train service (aged 16+) | ||||||||||||
| Bus service | ||||||||||||
| Every day or almost every day | 11.1 | 11.9 | 12.0 | 12.3 | 12.6 | 11.3 | 11.0 | 11.1 | 9.3 | 11.3 | 9.7 | 11.7 |
| 2 or 3 times per week | 11.2 | 11.6 | 11.7 | 11.7 | 12.2 | 11.8 | 11.7 | 12.5 | 11.0 | 11.4 | 11.3 | 11.6 |
| About once a week | 7.5 | 7.7 | 7.9 | 7.7 | 7.8 | 8.4 | 7.7 | 7.8 | 7.8 | 7.8 | 7.6 | 8.1 |
| Once or twice a month | 10.6 | 12.1 | 12.2 | 13.9 | 13.9 | 14.1 | 13.5 | 14.2 | 13.7 | 14.1 | 13.6 | 14.3 |
| Not used in the past month | 59.5 | 56.7 | 56.2 | 54.4 | 53.6 | 54.5 | 56.1 | 54.3 | 58.2 | 55.4 | 57.7 | 54.2 |
| Train service | ||||||||||||
| Every day or almost every day | 1.8 | 2.0 | 2.0 | 2.0 | 2.3 | 2.1 | 1.9 | 2.0 | 2.5 | 2.2 | 2.2 | 2.1 |
| 2 or 3 times per week | 1.6 | 1.5 | 1.6 | 1.8 | 2.0 | 2.1 | 1.9 | 2.2 | 2.4 | 2.5 | 2.1 | 2.5 |
| About once a week | 2.7 | 2.6 | 2.8 | 3.2 | 3.2 | 3.7 | 3.5 | 3.7 | 4.2 | 4.0 | 5.0 | 4.4 |
| Once or twice a month | 12.3 | 14.3 | 13.7 | 16.3 | 16.4 | 15.9 | 17.3 | 17.9 | 19.1 | 19.5 | 21.2 | 20.7 |
| Not used in the past month | 81.6 | 79.5 | 79.8 | 76.6 | 76.1 | 76.2 | 75.5 | 74.2 | 71.8 | 71.8 | 69.5 | 70.2 |
| Sample size (=100%) | 14,770 | 14,060 | 14,180 | 12,120 | 12,300 | 12,520 | 12,420 | 12,890 | 9,890 | 9,920 | 9,800 | 9,410 |
1. The apparent year-to-year fluctuations in some of the figures may be due to sampling variability.
2. Employed adults (aged 16+) not working from home
3. The Travel diary methodology changed in 2007 and in 2012, creating a break in the time series.
4. From 2012 Q4 the question was changed to ask about access to cars / vans instead of just cars.
| 2002 | 2003 | 2004 | 2005 | 2006 | 2007 | 2008 | 2009 | 2010 | 2011 | 2012 | 2013 | 2014 | 2015 | ||
|---|---|---|---|---|---|---|---|---|---|---|---|---|---|---|---|
| Vehicles Licensed | thousands | ||||||||||||||
| Private and Light Goods 1 | 2,058 | 2,104 | 2,158 | 2,231 | 2,259 | 2,313 | 2,347 | 2,362 | 2,364 | 2,369 | 2,395 | 2,436 | 2,496 | 2,537 | |
| All Vehicles 1 | 2,330 | 2,383 | 2,448 | 2,531 | 2,564 | 2,627 | 2,665 | 2,684 | 2,685 | 2,691 | 2,717 | 2,759 | 2,821 | 2,863 | |
| New Registrations | 259 | 262 | 263 | 251 | 243 | 251 | 215 | 216 | 209 | 202 | 216 | 241 | 262 | 268 | |
| Local Bus Services2 | millions | ||||||||||||||
| Passenger Journeys (boardings)3 | 471 | 478 | 460 | 466 | 476 | 488 | 484 | 459 | 432 | 437 | 423 | 424 | 414 | 407 | |
| Vehicle Kilometres3 | 374 | 369 | 359 | 374 | 385 | 397 | 386 | 376 | 346 | 338 | 327 | 331 | 331 | .. | |
| Passenger Revenue | £ million | ||||||||||||||
| at latest year's prices3 | .. | .. | 579 | 606 | 667 | 690 | 715 | 709 | 668 | 674 | 683 | 671 | 654 | .. | |
| Freight Lifted | million tonnes | ||||||||||||||
| Road 4, 9 | 154.4 | 153.4 | 173.1 | 165.6 | 170.0 | 176.8 | 157.0 | 131.9 | 131.9 | 144.2 | 150.6 | 135.8 | 137.6 | 153.9 | |
| Rail 2 | 9.12 | 8.32 | 11.25 | 14.32 | 12.96 | 11.35 | 10.36 | 9.69 | 8.33 | 9.87 | 8.43 | .. | .. | .. | |
| Coastwise traffic | 19.2 | 19.5 | 20.5 | 25.5 | 20.6 | 22.8 | 23.3 | 19.8 | 18.0 | 16.3 | 12.5 | 11.4 | 11.8 | .. | |
| One Port traffic | 1.81 | 1.54 | 1.33 | 1.76 | 1.48 | 1.83 | 1.75 | 3.59 | 1.88 | 2.42 | 2.57 | 2.10 | 2.19 | .. | |
| Inland waterway traffic | 10.01 | 10.06 | 9.97 | 10.19 | 10.16 | 10.50 | 12.19 | 10.10 | 10.89 | 10.70 | 10.79 | 10.69 | 9.41 | .. | |
| Pipelines 5 | 28.0 | 27.7 | 27.6 | 27.6 | 27.8 | 27.5 | 27.6 | 27.6 | 27.6 | 27.8 | 28.2 | .. | .. | .. | |
| Total | 222.6 | 220.5 | 243.8 | 245.0 | 243.0 | 250.8 | 232.2 | 202.7 | 198.6 | 211.3 | 213.1 | .. | .. | .. | |
| Public Road Lengths | kilometres | ||||||||||||||
| Trunk (A and M)10 | 3,488 | 3,485 | 3,482 | 3,505 | 3,518 | 3,505 | 3,505 | 3,520 | 3,518 | 3,523 | 3,553 | 3,551 | 3,570 | .. | |
| Other Major (A and M) | 7,417 | 7,418 | 7,418 | 7,433 | 7,424 | 7,381 | 7,421 | 7,421 | 7,414 | 7,467 | 7,473 | 7,473 | 7,406 | .. | |
| Minor Roads | 43,684 | 43,657 | 43,691 | 43,909 | 44,026 | 44,300 | 44,418 | 44,591 | 44,694 | 44,769 | 44,873 | 44,938 | 45,011 | .. | |
| All Roads10, 12 | 54,589 | 54,559 | 54,590 | 54,847 | 54,968 | 55,186 | 55,344 | 55,532 | 55,626 | 55,758 | 55,898 | 55,962 | 55,987 | .. | |
| Road Traffic | million vehicle-kilometres | ||||||||||||||
| Motorways 11 | 5,730 | 5,856 | 6,094 | 6,151 | 6,433 | 6,577 | 6,683 | 6,633 | 6,503 | 6,570 | 7,140 | 7,262 | 7,421 | 7,477 | |
| A roads | 21,533 | 21,826 | 22,114 | 21,904 | 22,465 | 22,408 | 22,126 | 22,327 | 21,992 | 21,996 | 21,712 | 21,786 | 22,025 | 22,395 | |
| All roads (incl. B, C, uncl.) | 41,535 | 42,038 | 42,705 | 42,718 | 44,119 | 44,666 | 44,470 | 44,219 | 43,488 | 43,390 | 43,549 | 43,840 | 44,839 | 45,374 | |
| Reported Road Accident Casualties 10 | |||||||||||||||
| Killed | 304 | 336 | 308 | 286 | 314 | 281 | 270 | 216 | 208 | 185 | 178 | 172 | 203 | 162 | |
| Killed and Serious | 3,533 | 3,293 | 3,074 | 2,952 | 2,949 | 2,666 | 2,845 | 2,503 | 2,177 | 2,065 | 2,157 | 1,843 | 1,907 | 1,759 | |
| All (Killed, Serious, Slight) | 19,275 | 18,756 | 18,502 | 17,885 | 17,269 | 16,239 | 15,592 | 15,043 | 13,338 | 12,790 | 12,714 | 11,505 | 11,307 | 10,950 | |
| Passenger Rail 2,6 | millions | ||||||||||||||
| ScotRail passenger journeys 6 | 57.4 | 57.5 | 64.0 | 69.4 | 71.6 | 74.5 | 76.4 | 76.9 | 78.3 | 81 | 83.3 | 86.3 | 92.7 | 93.2 | |
| ORR data: | |||||||||||||||
| Rail journeys in/from Scotland 7 | 52.4 | 55.9 | 61.3 | 66.7 | 69.8 | 72.7 | 76.3 | 76.5 | 79.4 | 83.3 | 85.8 | 86.7 | 91.7 | .. | |
| Passenger receipts (£2014 mill) | 272.2 | 286.6 | 303.5 | 311.8 | 321.1 | 365.6 | 367.0 | 403.2 | 417.8 | 428.2 | 444.9 | 458.1 | 481.7 | .. | |
| Air Transport | thousands | ||||||||||||||
| Terminal Passengers | 19,783 | 21,084 | 22,555 | 23,795 | 24,437 | 25,132 | 24,348 | 22,496 | 20,907 | 22,065 | 22,207 | 23,250 | 24,076 | 25,507 | |
| Transport Movements | 362.6 | 367.3 | 385.6 | 408.8 | 420.6 | 428.2 | 417.1 | 382.7 | 354.4 | 366.3 | 372.1 | 376.4 | 376.2 | 376.4 | |
| thousand tonnes | |||||||||||||||
| Freight | 77.0 | 80.8 | 81.0 | 79.4 | 83.3 | 66.1 | 50.2 | 50.9 | 47.5 | 45.2 | 52.2 | 54.2 | 59.9 | .. | |
| Ferries 8 | thousands | ||||||||||||||
| Passengers | 9,971 | 10,671 | 10,837 | 10,573 | 10,589 | 10,721 | 10,014 | 10,219 | 9,990 | 9,631 | 9,698 | 9,662 | 9,679 | 9,546 | |
| Vehicles | 2,791 | 2,955 | 3,077 | 3,026 | 3,113 | 3,244 | 3,056 | 3,128 | 3,063 | 3,051 | 3,057 | 2,951 | 3,033 | 3,098 | |
| of which on routes within Scotland | |||||||||||||||
| Passengers | 7,576 | 8,034 | 8,293 | 8,327 | 8,453 | 8,516 | 8,001 | 8,272 | 8,016 | 7,773 | 7,888 | 7,831 | 7,885 | 7,816 | |
| Vehicles | 2,260 | 2,388 | 2,476 | 2,503 | 2,610 | 2,713 | 2,569 | 2,648 | 2,554 | 2,551 | 2,628 | 2,577 | 2,625 | 2,700 | |
1 DfT has revised the figures for the light goods and goods body types back to 2001. DfT does not have the underlying data to revise earlier years' figures.
2 Financial years
3 The DfT have revised figures from 2004/05 onwards as a result of methodological improvements. Figures prior to this period are not directly comparable.
See Chapter 2 for more detail. Figures from 2006 include Government support for buses which is not available for the two previous years.
4 Freight lifted in Scotland by UK-registered hauliers, regardless of whether the destination is in Scotland, elsewhere in the UK or outwith the UK.
The figures for 2004 onwards are not compatible with those for earlier years due to changes in methodology and processing system for the survey.
5 The estimated amounts of crude oil and products carried by pipelines over 50km in length. 2012 figures are provisional.
6 ScotRail introduced a new methodology which better estimates Strathclyde Zonecard journeys from 2009/10. Figures from 2003/04 onwards
present the impact of this on previously reported data to provide a more meaningful year on year comparison. Note that this has no impact on actual
journeys undertaken.
7 The Office of Rail Regulation (ORR) produce total passenger figures. These are not adjusted to reflect ScotRail's revised methdology and are therefore
not comparable with ScotRail figures. There is a series break between 2007-08 and 2008-09 due to a change in the methodology.
From 2008-09 estimates of PTE travel (zone cards) are included.
8 Services to Europe, Northern Ireland and within Scotland (Previous versions of STS only included services where data is available back to 1975, this
can still be found in Table H1).
9 Domestic freight estimates for 2006 to 2009 were revised on 27 October 2011. Data for later years has not been published by DfT.
10 Totals have been revised in 2012 to include slip roads on Trunk A roads which had previously excluded.
See Road Network chapter for more information. Data for 2012 were extracted from the database on 10 October 2013.
11 Changes in the layout of the M74/M77/M8 during 2012 are likely to have affected the traffic data for motorways.
12 Provisional
| 2005 | 2006 | 2007 | 2008 | 2009 | 2010 | 2011 | 2012 | 2013 | 2014 | 2015 | 2015 sample size | |
|---|---|---|---|---|---|---|---|---|---|---|---|---|
| cell percentages | ||||||||||||
| All aged 17+ | 65.6 | 66.4 | 67.0 | 67.6 | 68.0 | 67.6 | 67.3 | 68.3 | 68.4 | 68.5 | 68.0 | 9,340 |
| by gender: | ||||||||||||
| Male | 75.7 | 75.5 | 75.8 | 76.0 | 76.2 | 75.6 | 75.6 | 75.6 | 76.0 | 75.8 | 73.4 | 4,210 |
| Female | 56.4 | 58.0 | 59.2 | 59.9 | 60.6 | 60.2 | 59.8 | 61.6 | 61.4 | 61.8 | 63.1 | 5,130 |
| by age: | ||||||||||||
| 17-19 | 20.8 | 30.2 | 28.1 | 32.5 | 24.8 | 26.6 | 25.9 | 27.5 | 26.3 | 29.3 | 25.8 | 190 |
| 20-29 | 59.6 | 58.5 | 57.7 | 56.4 | 58.4 | 57.8 | 54.1 | 58.3 | 56.2 | 56.1 | 54.4 | 1,070 |
| 30-39 | 78.7 | 76.0 | 78.4 | 78.5 | 76.8 | 76.3 | 77.0 | 74.9 | 74.2 | 73.2 | 71.8 | 1,310 |
| 40-49 | 79.2 | 79.3 | 80.0 | 82.6 | 80.1 | 80.8 | 80.3 | 79.8 | 80.0 | 82.1 | 81.9 | 1,470 |
| 50-59 | 74.8 | 76.1 | 76.4 | 77.8 | 78.1 | 77.9 | 78.1 | 79.3 | 80.0 | 79.1 | 77.8 | 1,680 |
| 60-69 | 65.4 | 68.2 | 69.1 | 70.1 | 74.6 | 72.3 | 73.9 | 73.5 | 74.3 | 74.4 | 75.7 | 1,700 |
| 70-79 | 48.9 | 50.8 | 55.2 | 53.4 | 54.6 | 54.2 | 57.5 | 59.0 | 60.2 | 61.2 | 62.0 | 1,220 |
| 80+ | 26.6 | 28.7 | 35.4 | 30.8 | 37.4 | 36.5 | 35.4 | 37.2 | 41.2 | 39.8 | 43.1 | 700 |
| Sample size (=100%) | 13,970 | 14,080 | 12,150 | 12,270 | 12,450 | 12,360 | 12,800 | 9,830 | 9,840 | 9,720 | 9,340 | |
| 2005 | 2006 | 2007 | 2008 | 2009 | 2010 | 2011 | 2012 | 2013 | 2014 | 2015 | |
| Amount spent on fuel in the past month | column percentages | ||||||||||
|---|---|---|---|---|---|---|---|---|---|---|---|
| £1 to £19 | 3.8 | 3.1 | .. | .. | 2.7 | 2 | 1.6 | 1.1 | 1.4 | 1.2 | 1.5 |
| £20 to £39 | 15.8 | 14.6 | .. | .. | 13.8 | 11.5 | 7.5 | 7.9 | 8.2 | 7.9 | 11.1 |
| £40 to £59 | 22.7 | 21.7 | .. | .. | 20.4 | 18.3 | 14.7 | 15.3 | 15.6 | 16.9 | 19.2 |
| £60 to £99 | 24.6 | 23.8 | .. | .. | 22.9 | 20.9 | 20.3 | 21.2 | 19.9 | 21.1 | 23 |
| £100 to £149 | 17.9 | 18.6 | .. | .. | 18.9 | 20.3 | 22.6 | 19.8 | 21.2 | 22.6 | 19.9 |
| £150 and over | 15.2 | 18.2 | .. | .. | 21.3 | 27 | 33.3 | 34.7 | 33.7 | 30.3 | 25.3 |
| Median | 60 | 70 | .. | .. | 80 | 80 | 100 | 100 | 100 | 100 | 80 |
| Average | 85 | 92.1 | .. | .. | 99.6 | 112.2 | 131 | 134.5 | 128.9 | 123.7 | 109.2 |
| Sample size(=100%) | 9,690 | 9,840 | .. | .. | 9,100 | 9,100 | 9,280 | 4,580 | 7,020 | 6,900 | 6,760 |
*In 2001, the question referred to expenditure on fuel for "motor vehicles" of which around 95% were cars. From April 2003, the question refers to cars only. The question was not asked at all in 2002, 2007 and 2008 or in the first quarter of 2003.
| 2005 | 2006 | 2007 | 2008 | 2009 | 2010 | 2011 | 2012 | 2013 | 2014 | 2015 | |
|---|---|---|---|---|---|---|---|---|---|---|---|
| As a means of transport: | column percentages | ||||||||||
| None | 46.0 | 46.0 | 48.0 | 47.5 | 41.0 | 38.0 | 36.9 | 34.2 | .. | 33 | .. |
| 1-2 days | 15.3 | 15.8 | 17.9 | 17.2 | 17.5 | 18.9 | 19.1 | 19.8 | .. | 19 | .. |
| 3-5 days | 22.0 | 21.3 | 19.8 | 21.7 | 22.4 | 24.3 | 24.4 | 23.2 | .. | 26 | .. |
| 6-7 days | 16.7 | 17.0 | 14.3 | 13.6 | 19.1 | 18.8 | 19.6 | 22.7 | .. | 22 | .. |
| 1+ days | 54.0 | 54.0 | 52.0 | 52.5 | 59.0 | 62.0 | 63.1 | 65.8 | .. | 67 | .. |
| Sample size (=100%) | 6,992 | 7,111 | 6,116 | 6,197 | 6,137 | 6,178 | 6,381 | 9,841 | .. | 9,740 | .. |
| Just for pleasure: | |||||||||||
| None | 53.9 | 53.3 | 53.1 | 54.9 | 51.6 | 48.7 | 46.0 | 45.1 | .. | 42 | .. |
| 1-2 days | 16.9 | 16.5 | 17.6 | 18.4 | 19.1 | 17.7 | 18.9 | 18.9 | .. | 20 | .. |
| 3-5 days | 14.2 | 13.7 | 13.7 | 13.0 | 13.1 | 16.5 | 16.7 | 16.7 | .. | 18 | .. |
| 6-7 days | 15.1 | 16.4 | 15.5 | 13.7 | 16.1 | 17.2 | 18.5 | 19.3 | .. | 20 | .. |
| 1+ days | 46.1 | 46.7 | 46.9 | 45.1 | 48.4 | 51.3 | 54.0 | 54.9 | .. | 58 | .. |
| Sample size (=100%) | 6,990 | 7,110 | 6,120 | 6,210 | 6,120 | 6,140 | 6,370 | 9,810 | .. | 9,690 | .. |
*Only relates to journeys over a quarter of a mile. In 2005 and 2006 the question was asked of half the sample. Between 2007 and 2011 the question was asked of 1/3 of the sample. From 2012 the question is asked of the full sample every other year so no data is avaialble from the 2013 survey.
| 2005 | 2006 | 2007 | 2008 | 2009 | 2010 | 2011 | 2012 | 2013 | 2014 | 2015 | |
|---|---|---|---|---|---|---|---|---|---|---|---|
| As a means of transport: | column percentages | ||||||||||
| None | 96.9 | 96.8 | 96.8 | 96.2 | .. | .. | .. | 93.9 | .. | 93.9 | .. |
| 1-2 days | 1.3 | 1.3 | 1.7 | 1.7 | .. | .. | .. | 2.7 | .. | 2.7 | .. |
| 3-5 days | 1.3 | 1.3 | 1.1 | 1.4 | .. | .. | .. | 2.3 | .. | 2.3 | .. |
| 6-7 days | 0.5 | 0.7 | 0.4 | 0.7 | .. | .. | .. | 1.1 | .. | 1.2 | .. |
| 1+ days | 3.1 | 3.2 | 3.2 | 3.8 | .. | .. | .. | 6.1 | .. | 6.1 | .. |
| Sample size (=100%) | 7,030 | 7,110 | 6,150 | 6,230 | .. | .. | .. | 9,890 | .. | 9,800 | .. |
| Just for pleasure: | |||||||||||
| None | 95.9 | 95.5 | 95.4 | 96.2 | .. | .. | .. | 94.1 | .. | 93.9 | .. |
| 1-2 days | 2.9 | 2.8 | 3.2 | 2.8 | .. | .. | .. | 3.1 | .. | 3.5 | .. |
| 3-5 days | 0.8 | 1.1 | 1.0 | 0.9 | .. | .. | .. | 1.9 | .. | 2 | .. |
| 6-7 days | 0.4 | 0.6 | 0.3 | 0.2 | .. | .. | .. | 0.9 | .. | 0.7 | .. |
| 1+ days | 4.1 | 4.5 | 4.6 | 3.8 | .. | .. | .. | 5.9 | .. | 6 | .. |
| Sample size (=100%) | 7,030 | 7,110 | 6,150 | 6,230 | .. | .. | .. | 9,890 | .. | 9,800 | .. |
*Only relates to journeys over a quarter of a mile. In 2005 and 2006 the question was asked of half the sample. Between 2007 and 2008 the question was asked of 1/3 of the sample and was then not asked again until 2012. From 2012 the question is asked of the full sample every other year so no data is avaialble from the 2015 survey.
| 2007 | 2008 | 2009 | 2010 | 2011 | 2012 | 2013 | 2014 | 2015 | |
|---|---|---|---|---|---|---|---|---|---|
| Column percentages | |||||||||
| Very satisfied | 18.6 | 20.6 | 26.8 | 26.8 | 26.3 | 21.2 | 23.6 | 22.7 | 23.3 |
| Fairly satisfied | 50.7 | 52.2 | 48.2 | 47.5 | 49.7 | 51 | 47.5 | 52.4 | 50.4 |
| Neither satisfied nor dissatisfied | 13.8 | 12 | 10.6 | 12.1 | 9.9 | 13.8 | 12.2 | 13.5 | 12.1 |
| Fairly dissatisfied | 10.7 | 10 | 9 | 8.6 | 8.7 | 9.4 | 10.6 | 7.3 | 8.9 |
| Very dissatisfied | 6.2 | 5.2 | 5.4 | 5 | 5.4 | 4.7 | 6.1 | 4.2 | 5.4 |
| sample size† (=100%) | 8,600 | 7,740 | 8,110 | 7,590 | 8,220 | 8,330 | 8,400 | 8,480 | 8,180 |
* Excludes respondents who answered 'no opinion' in line with figures published in the SHS Annual Report and the National Indicator on improving people's perceptions of the quality of public services. Approximately 15% of all respondents answered 'no opinion' in 2007-2011.
† Sample sizes relate to those who provided an opionion on public transport only and so will differ from that reported in the SHS Annual Report.
| 2005 | 2006 | 2007 | 2008 | 2009 | 2010 | 2011 | 2012 | 2013 | 2014 | 2015 | |
|---|---|---|---|---|---|---|---|---|---|---|---|
| cell percentages | |||||||||||
| Adults aged 16+ | 23.0 | 24.5 | 23.5 | 24.5 | 26.4 | 26.6 | 26.7 | 27.0 | 26.3 | 27.0 | 27.6 |
| Adults aged 60+ | 80.2 | 82.6 | 81.5 | 84.3 | 86.7 | 87.1 | 87.5 | 88.4 | 86.4 | 87.3 | 86.9 |
| Adults aged 60-64 | 69.3 | 74.7 | 74.9 | 74.7 | 78.1 | 78.5 | 80.3 | 81.5 | 75.0 | 75.3 | 73.8 |
| Adults aged 65+ | 83.9 | 85.3 | 84.0 | 88.1 | 90.0 | 90.5 | 90.2 | 91.0 | 90.4 | 91.3 | 91.2 |
| Sample size = (100%) | 14,070 | 14,190 | 12,240 | 12,370 | 12,540 | 12,440 | 12,890 | 9,890 | 9,920 | 9,800 | 9,410 |
*Figures from 2003, relate to the period from April to December 2003, as the concessionary pass question was asked only from April. Figures from 2006, relate to April to December 2006, as a new concessionary fare scheme was introduced in April 2006. Prior to April 2006 the question only concerned off-peak concessionary passes.
Table 6: Adults with limited mobility
Following changes to the Scottish Household survey, data for Table 6 is no longer collected - Please see TATIS 2011 for the most recently produced version of the table.
| Walking | Driver | Passenger | bicycle | bus | rail | Other | Sample size (=100%) | % Public / Active (National Indicator) | |
|---|---|---|---|---|---|---|---|---|---|
| Row percentages | |||||||||
| All | 13.6 | 60.3 | 5.6 | 2.2 | 11.2 | 4.4 | 2.7 | 3,950 | 31.4 |
| by gender: | |||||||||
| Male | 11.3 | 62.1 | 5.2 | 3.4 | 9.9 | 4.4 | 3.8 | 1,830 | 28.9 |
| Female | 16.0 | 58.6 | 6.0 | 1.0 | 12.6 | 4.4 | 1.6 | 2,120 | 33.9 |
| by age: | |||||||||
| 16 - 19 | 23.2 | 42.2 | 13.1 | . | 18.7 | 2.8 | 0.0 | 50 | 44.7 |
| 20 - 29 | 18.1 | 47.5 | 7.8 | 4.0 | 14.7 | 4.4 | 3.4 | 620 | 41.2 |
| 30 - 39 | 14.2 | 60.3 | 4.8 | 2.4 | 10.8 | 5.0 | 2.5 | 900 | 32.4 |
| 40 - 49 | 10.2 | 66.0 | 3.7 | 2.1 | 9.2 | 5.6 | 3.3 | 1,010 | 27.0 |
| 50 - 59 | 11.7 | 66.1 | 6.2 | 1.3 | 9.9 | 3.2 | 1.6 | 1,010 | 26.1 |
| 60 and over | 14.2 | 63.7 | 4.3 | 0.4 | 11.6 | 2.2 | 3.6 | 370 | 28.4 |
| by current situation: | |||||||||
| Self employed | 16.2 | 73.1 | 2.1 | 2.3 | 0.7 | 3.2 | 2.5 | 180 | 22.3 |
| Employed full time | 11.2 | 61.4 | 5.5 | 2.4 | 11.3 | 5.1 | 3.1 | 2,880 | 30.0 |
| Employed part time | 21.8 | 53.7 | 6.6 | 1.5 | 12.9 | 2.2 | 1.4 | 890 | 38.3 |
| by annual net household income: | |||||||||
| up to £10,000 p.a. | 37.6 | 34.3 | 3.2 | 2.7 | 17.0 | 1.6 | 3.6 | 130 | 58.9 |
| over £10,000 - £15,000 | 24.1 | 35.9 | 10.0 | 3.3 | 20.9 | 3.6 | 2.2 | 370 | 52.0 |
| over £15,000 - £20,000 | 19.8 | 48.3 | 7.1 | 2.9 | 14.5 | 3.8 | 3.6 | 520 | 41.0 |
| over £20,000 - £25,000 | 16.2 | 56.5 | 7.2 | 1.8 | 14.1 | 3.1 | 1.1 | 470 | 35.3 |
| over £25,000 - £30,000 | 16.0 | 56.9 | 8.7 | 2.2 | 10.4 | 3.8 | 2.1 | 480 | 32.3 |
| over £30,000 - £40,000 | 10.0 | 65.5 | 5.7 | 1.6 | 10.3 | 4.4 | 2.4 | 810 | 26.4 |
| over £40,000 p.a. | 8.1 | 70.7 | 2.8 | 2.2 | 7.4 | 5.5 | 3.3 | 1,140 | 23.2 |
| by Scottish Index of Multiple Deprivation: | |||||||||
| 1 - Most Deprived | 18.6 | 46.4 | 10.9 | 1.2 | 17.1 | 4.0 | 1.8 | 620 | 40.9 |
| 2 | 18.4 | 53.4 | 6.0 | 3.4 | 11.7 | 4.3 | 2.7 | 810 | 37.8 |
| 3 | 13.2 | 61.4 | 5.9 | 1.4 | 10.2 | 5.6 | 2.3 | 900 | 30.4 |
| 4 | 10.0 | 68.7 | 3.4 | 1.8 | 8.2 | 3.8 | 4.1 | 930 | 23.8 |
| 5 - Least Deprived | 9.3 | 68.0 | 3.0 | 3.1 | 10.4 | 4.0 | 2.1 | 700 | 26.9 |
| by urban/rural: | |||||||||
| Large urban areas | 15.8 | 49.8 | 4.9 | 3.5 | 18.3 | 5.8 | 1.9 | 1200 | 43.5 |
| Other urban | 12.9 | 61.8 | 7.2 | 1.8 | 8.9 | 4.7 | 2.8 | 1350 | 28.2 |
| Small accessible towns | 11.7 | 69.9 | 3.9 | 2.7 | 6.6 | 3.9 | 1.2 | 370 | 24.9 |
| Small remote towns | 30.5 | 56.3 | 1.7 | 0.1 | 3.7 | 1.7 | 6.0 | 240 | 36.0 |
| Accessible rural | 7.1 | 75.9 | 3.6 | 0.5 | 6.5 | 2.3 | 3.9 | 420 | 16.5 |
| Remote rural | 12.2 | 70.8 | 8.7 | 0.5 | 2.3 | 0.0 | 5.4 | 370 | 15.1 |
| by number of cars: | |||||||||
| none | 40.2 | 1.5 | 8.9 | 5.9 | 34.0 | 6.3 | 3.3 | 670 | 86.3 |
| one | 13.0 | 59.7 | 7.1 | 2.4 | 10.5 | 5.0 | 2.4 | 1820 | 30.8 |
| two + | 5.0 | 81.4 | 3.1 | 0.7 | 4.0 | 3.2 | 2.7 | 1460 | 12.9 |
| Household type | |||||||||
| Single adult | 19.2 | 52.6 | 3.9 | 3.1 | 13.0 | 5.3 | 2.8 | 960 | 38.1 |
| Small adult | 15.7 | 61.1 | 5.9 | 2.7 | 10.1 | 2.7 | 1.8 | 960 | 30.3 |
| Single parent | 19.0 | 54.7 | 3.1 | 0.1 | 18.5 | 3.5 | 1.1 | 270 | 38.6 |
| Small family | 9.8 | 66.3 | 3.9 | 2.0 | 8.8 | 7.2 | 2.0 | 820 | 22.6 |
| Large family | 9.6 | 63.8 | 6.1 | 3.4 | 10.1 | 3.6 | 3.5 | 250 | 26.5 |
| Large adult | 10.3 | 57.4 | 8.9 | 1.5 | 13.5 | 3.9 | 4.5 | 380 | 29.8 |
| Older smaller | 16.6 | 60.7 | 5.8 | 0.4 | 10.9 | 2.3 | 3.4 | 320 | 31.3 |
* Those in full-time employment, part-time employment and self-employed only.
** value supressed as cell contains fewer than 5 responses
| Driver car/van | Passenger car/van | Bus | Other | All | |
|---|---|---|---|---|---|
| How often journey to work affected by traffic congestion | column percentages | ||||
| At least once a week | 39.1 | 31.7 | 43.2 | 7.3 | 31 |
| Less Often | 23.2 | 19.3 | 21.2 | 6.8 | 18.4 |
| Never | 37.7 | 49 | 35.6 | 85.9 | 50.6 |
| Sample size (=100%) | 12,040 | 1,140 | 2,440 | 5,090 | 20,714 |
| How much extra time normally allowed for journey to work | |||||
| None | 26.2 | 25 | 30.3 | 38.7 | 27.7 |
| less than 5 mins | 7.8 | 8.9 | 6.8 | 9.2 | 7.8 |
| 5-10 mins | 26.7 | 31 | 23 | 19.9 | 25.8 |
| 11-30 mins | 31.5 | 28.9 | 29.3 | 24.4 | 30.4 |
| 31-60 mins | 6 | 4.8 | 7.4 | 5.9 | 6.1 |
| more than 1 hr | 1.9 | 1.4 | 3.1 | 1.9 | 2.1 |
| Sample size (=100%) | 6,760 | 520 | 1,480 | 680 | 9,440 |
Table 9: Journeys carried out on way to/from work
Following changes to the Scottish Household survey, data for Table 9 is no longer collected - Please see TATIS 2011 for the most recently produced version of the table.
| Usual mode one year ago | ||||||||
|---|---|---|---|---|---|---|---|---|
| Walking | Driver | Passenger | bicycle | bus | rail | Other | All | |
| Current usual mode | column percentages | |||||||
| Walking | 87.1 | 0.9 | 1.7 | 3.2 | 4.4 | 2.5 | 1.4 | 12.7 |
| Driver | 5.4 | 97.2 | 5.5 | 9.3 | 4.6 | 9.2 | 8.6 | 62.3 |
| Passenger | 2.2 | 0.5 | 88.6 | 0.3 | 2.6 | 0.8 | 0.9 | 5.6 |
| bicycle | 0.8 | 0.2 | 0.5 | 83.3 | 0.8 | 1 | 0.3 | 2.3 |
| bus | 2.9 | 0.5 | 1.9 | 2.2 | 85.7 | 2.9 | 1.7 | 10.3 |
| rail | 0.6 | 0.5 | 0.8 | 0.6 | 1.4 | 82.9 | 1.9 | 4.2 |
| Other | 1 | 0.3 | 1.1 | 1 | 0.4 | 0.8 | 85.3 | 2.5 |
| Sample size (=100%) | 2,420 | 11,200 | 870 | 380 | 1,830 | 690 | 440 | 17,840 |
** denotes cell value supressed as based on fewer than 5 responses
| 2012 | 2013 | 2014 | 2015 | 2013-2015 | |
|---|---|---|---|---|---|
| column percentages | |||||
| Changed job | 36.3 | 29.2 | 41.7 | 34.9 | 35.3 |
| Moved home | 23.9 | 22.7 | 20.6 | 24.7 | 22.8 |
| Employer re-located | 3.6 | 11.2 | 2.2 | 7.9 | 7.1 |
| Bought a car | 3.9 | 6.1 | 9.0 | 7.1 | 7.4 |
| Sold car | 2.8 | 2.1 | 2.2 | 1.8 | 2.0 |
| Lost licence | ** | ** | 0.5 | 0.1 | 0.6 |
| Public transport service added | . | ** | 1.1 | 0.6 | 0.8 |
| Public transport service withdrawn | ** | ** | 0.0 | 1.5 | 0.7 |
| Changed working hours | ** | ** | 2.6 | 3.6 | 2.6 |
| Had a baby | . | ** | 0.6 | 0.4 | 0.9 |
| Passed driving test | ** | ** | 2.9 | 6.1 | 3.9 |
| Husband/wife/Partner has more need for car | ** | 2.0 | 0.8 | 0.2 | 0.9 |
| Fresh air / exercise | ** | 5.9 | 1.9 | 2.6 | 3.4 |
| Other | 29.0 | 25.7 | 21.7 | 16.1 | 20.8 |
| Sample size (=100%) | 210 | 230 | 240 | 250 | 720 |
** denotes cell value supressed as based on fewer than 5 responses
Columns will sum to more than 100% as multiple responses can be provided.
| 2013-2015 | |
|---|---|
| Whether involved in any car sharing arrangement | column percentages |
| Yes | 13.3 |
| No | 86.7 |
| Sample size (=100%) | 8,200 |
| How car sharing is organised | |
| Normally between ourselves | 91.9 |
| Through Employer | 7.4 |
| Other | 0.7 |
| Sample size (=100%) | 1,070 |
| Reasons why not involved in a car share arrangement | |
| Nobody in my work lives near me | 63.9 |
| Don't work regular hours | 22.4 |
| Journey to work is not regular/work in different places | 6.5 |
| Wouldn't like to share with a stranger | 5.7 |
| Prefer to drive on my own | 4.0 |
| Prefer to drive than be a passenger | 1.9 |
| Make journey longer | 0.8 |
| Only work a few days a week | 1.1 |
| Other people would be unreliable / late | 0.8 |
| Other | 1.2 |
| Sample size (=100%) | 7,130 |
Columns will sum to more than 100% as multiple responses can be provided.
Table 12: Whether workplace has a travel plan
Following changes to the Scottish Household survey, data for Table 12 is no longer collected - Please see TATIS 2011 for the most recently produced version of the table.
| Usual method of travel to work | Car/van commuters† | ||||||
|---|---|---|---|---|---|---|---|
| Car/van | Bus | Other | Sample size (=100%) |
Could use PT | Could not use PT | Sample size (=100%) |
|
| row percentages | row percentages | ||||||
| All people aged 16+ in 2014: | 68 | 10 | 22 | 4,130 | 48 | 52 | 2,530 |
| by gender: | |||||||
| Male | 69 | 8 | 23 | 1,930 | 43 | 57 | 1,190 |
| Female | 66 | 12 | 22 | 2,200 | 52 | 48 | 1,340 |
| by age: | |||||||
| 16 - 29 | 59 | 15 | 26 | 710 | 50 | 50 | 370 |
| 30 - 39 | 65 | 10 | 25 | 900 | 54 | 46 | 530 |
| 40 - 49 | 70 | 7 | 22 | 1,090 | 46 | 54 | 700 |
| 50 - 59 | 73 | 8 | 18 | 1,010 | 44 | 56 | 670 |
| 60 and over | 74 | 11 | 15 | 420 | 42 | 58 | 270 |
| by current situation: | |||||||
| Self employed | 77 | 2 | 20 | 190 | 31 | 69 | 130 |
| Employed full time | 69 | 10 | 21 | 3,030 | 47 | 53 | 1,890 |
| Employed part time | 61 | 14 | 25 | 910 | 53 | 47 | 510 |
| by annual net household income: | |||||||
| up to £10,000 p.a. | 50 | 18 | 32 | 160 | 46 | 54 | 70 |
| over £10,000 - £15,000 | 46 | 24 | 30 | 410 | 49 | 51 | 170 |
| over £15,000 - £20,000 | 61 | 14 | 25 | 570 | 50 | 50 | 310 |
| over £20,000 - £25,000 | 66 | 9 | 25 | 530 | 50 | 50 | 327 |
| over £25,000 - £30,000 | 67 | 13 | 20 | 510 | 46 | 54 | 320 |
| over £30,000 - £40,000 | 70 | 8 | 22 | 770 | 43 | 57 | 500 |
| over £40,000 p.a. | 76 | 6 | 18 | 1,170 | 49 | 51 | 820 |
| by Scottish Index of Multiple Deprivation: | |||||||
| 1 (20% most deprived) | 59 | 15 | 26 | 670 | 51 | 49 | 340 |
| 2 | 64 | 13 | 23 | 780 | 47 | 53 | 450 |
| 3 | 71 | 9 | 20 | 950 | 43 | 57 | 620 |
| 4 | 74 | 7 | 19 | 980 | 44 | 56 | 660 |
| 5 (20% least deprived) | 67 | 9 | 24 | 760 | 55 | 45 | 470 |
| by urban/rural classification: | |||||||
| Large urban areas | 54 | 17 | 28 | 1,250 | 61 | 39 | 570 |
| Other urban areas | 73 | 7 | 20 | 1,350 | 48 | 52 | 870 |
| Accessible small towns | 77 | 5 | 17 | 390 | 51 | 49 | 270 |
| Remote small towns | 61 | 4 | 35 | 260 | 26 | 74 | 150 |
| Accessible rural | 84 | 6 | 11 | 470 | 38 | 62 | 370 |
| Remote rural | 75 | 6 | 19 | 410 | 17 | 83 | 300 |
*Those in full-time employment, part-time employment and self-employed only.
†Excludes respondents who don't know if it's possible to travel by public transport.
1. Question only asked in the survey every other year. 2014 is the most recent data available.
| Car/Van Driver/Passenger | |
|---|---|
| column percentages | |
| By whether they could use public transport | |
| Yes | 45 |
| No | 53 |
| Sample size (=100%) | 19,040 |
| If they could use public transport, reasons for not using it | |
| Takes too long | 48 |
| No direct route | 30 |
| Prefer to use car | 15 |
| Need a car for work | 13 |
| Work unusual hours | 8 |
| Cost | 9 |
| Lack of service | 7 |
| Nothing | 5 |
| Public transport is unreliable | 4 |
| Too infrequent | 5 |
| Too much to carry | 4 |
| Long walk to bus stop | 3 |
| Dislike waiting about | 2 |
| Uncomfortable | 1 |
| Health reasons | 1 |
| Prefer to walk | 1 |
| Other reasons are all less than 1% when rounded | |
| Sample size (=100%) | 5,200 |
| If they could not use public transport, reasons why they cannot 2 | |
| No direct route | 42 |
| Lack of service | 25 |
| Takes too long | 21 |
| Inconvenient | 18 |
| Need a car for work | 17 |
| Work unusual hours | 15 |
| Prefer to use car | 8 |
| Too much to carry | 7 |
| Too infrequent | 5 |
| Public transport is unreliable | 3 |
| Nothing | 1 |
| Long walk to bus stop | 2 |
| Cost | 2 |
| Live centrally / within walking distance | 1 |
| Other reasons are all less than 1% when rounded | |
| Sample size (=100%) | 3,620 |
1. Question asked every other year from 2012. 2014 data is latest available.
2. Question not asked in 2008. Results in this section use 2009-2014
| Walking | Car or van | Bicycle | School bus* | Service bus | Rail (inc. Glas U/g) | All other modes | Sample size (=100%) | |
|---|---|---|---|---|---|---|---|---|
| Row percentages | ||||||||
| All people | 48.8 | 25.8 | 1.2 | 15.3 | 5.7 | 1.1 | 2.1 | 1,880 |
| by gender: | ||||||||
| Male | 47.9 | 26.1 | 1.9 | 15.5 | 4.6 | 1.3 | 2.6 | 980 |
| Female | 49.7 | 25.5 | 0.5 | 15.0 | 6.8 | 1.0 | 1.6 | 900 |
| by age: | ||||||||
| age 4-5 | 53.0 | 35.4 | 0.3 | 5.7 | 4.6 | 0.0 | 1.0 | 170 |
| age 6-7 | 51.9 | 38.8 | 0.6 | 7.1 | 1.1 | 0.3 | 0.3 | 350 |
| age 8-9 | 61.4 | 26.0 | 3.6 | 4.7 | 2.0 | 0.0 | 2.3 | 310 |
| age 10-11 | 49.5 | 30.2 | 2.2 | 11.3 | 2.4 | 1.2 | 3.2 | 270 |
| All 4-11 | 54.2 | 32.4 | 1.9 | 7.3 | 2.2 | 0.4 | 1.7 | 1,100 |
| age 12-13 | 45.7 | 15.6 | 0.6 | 24.5 | 9.9 | 0.0 | 3.6 | 280 |
| age 14-15 | 39.1 | 16.5 | 0.2 | 28.7 | 10.6 | 2.7 | 2.2 | 310 |
| age 16-18 | 38.1 | 18.8 | 0.0 | 25.3 | 11.1 | 4.6 | 2.1 | 190 |
| All 12-18 | 41.3 | 16.7 | 0.3 | 26.4 | 10.5 | 2.2 | 2.7 | 780 |
| by annual net household income: | ||||||||
| Up to £15,000 | 56.9 | 18.5 | 1.1 | 7.3 | 12.8 | 0.6 | 2.9 | 170 |
| £15,000 - £20,000 | 54.9 | 16.5 | 2.1 | 17.3 | 5.7 | 0.5 | 3.0 | 220 |
| £20,000 - £25,000 | 52.2 | 23.8 | 0.7 | 13.6 | 6.8 | 0.7 | 2.1 | 240 |
| £25,000 - £30,000 | 45.4 | 25.6 | 0.7 | 18.9 | 6.2 | 0.8 | 2.5 | 230 |
| £30,000 - £40,000 | 45.6 | 26.6 | 1.3 | 18.0 | 4.9 | 1.3 | 2.5 | 390 |
| over £40,000 p.a. | 46.5 | 31.6 | 1.1 | 14.2 | 3.8 | 1.5 | 1.3 | 620 |
| by Scottish Index of Multiple Deprivation: | ||||||||
| 1 - Most Deprived | 51.2 | 21.7 | 0.6 | 12.3 | 9.2 | 0.4 | 4.6 | 340 |
| 2 | 52.7 | 23.5 | 0.8 | 13.3 | 6.1 | 1.3 | 2.4 | 350 |
| 3 | 45.5 | 26.4 | 0.7 | 22.6 | 3.4 | 0.4 | 1.1 | 430 |
| 4 | 43.9 | 28.5 | 2.4 | 16.8 | 5.5 | 1.5 | 1.4 | 410 |
| 5 - Least Deprived | 51.6 | 28.8 | 1.5 | 10.1 | 4.5 | 2.1 | 1.4 | 360 |
| by urban/rural: | ||||||||
| Large urban areas | 50.2 | 29.7 | 1.0 | 5.9 | 8.8 | 2.4 | 2.0 | 520 |
| Other urban | 53.3 | 25.5 | 1.4 | 12.5 | 4.4 | 0.3 | 2.6 | 640 |
| Small accessible towns and small remote towns | 63.2 | 15.5 | 1.6 | 14.0 | 4.6 | 0.5 | 0.7 | 300 |
| Accessible rural | 32.9 | 26.3 | 1.0 | 31.3 | 4.7 | 1.1 | 2.8 | 250 |
| Remote rural | 21.4 | 30.4 | 0.6 | 42.7 | 2.2 | 1.0 | 1.7 | 170 |
| by number of cars: | ||||||||
| None | 65.4 | 1.7 | 1.7 | 13.2 | 12.7 | 0.6 | 4.7 | 280 |
| One | 50.8 | 24.6 | 1.3 | 14.1 | 5.6 | 1.2 | 2.4 | 800 |
| Two + | 41.2 | 35.3 | 1.0 | 17.1 | 3.3 | 1.2 | 1.0 | 790 |
| Household type | ||||||||
| Single parent | 49.6 | 21.1 | 2.3 | 17.1 | 7.6 | 0.6 | 1.8 | 400 |
| Small family | 50.4 | 29.5 | 0.8 | 12.2 | 4.4 | 0.4 | 2.2 | 820 |
| Large family | 47.5 | 25.5 | 1.2 | 16.6 | 4.9 | 1.9 | 2.2 | 520 |
| Large adult | 41.9 | 19.7 | 0.0 | 22.5 | 13.2 | 2.4 | 0.4 | 110 |
*Includes school bus, private bus and works bus.
** denotes cell value supressed as based on fewer than 5 responses
| Usual method of travel to school | ||||
|---|---|---|---|---|
| Walking | Car or van | School bus | Service bus | |
| Cell percentages | ||||
| Close / Nearby / Not far away | 90% | 7% | 5% | 11% |
| Most convenient | 8% | 41% | 40% | 40% |
| Travel with friends | 4% | 1% | 6% | 4% |
| Safest method | 1% | 20% | 22% | 2% |
| Quickest method | 4% | 14% | 10% | 7% |
| Only method available | 2% | 11% | 18% | 23% |
| Too far to walk | 0% | 16% | 21% | 24% |
| No public transport | 0% | 3% | 4% | 2% |
| Publ transp unsuitable (eg too infreq.) | 0% | 2% | 2% | 0% |
| Good exercise / fresh air | 5% | 0% | 0% | 0% |
| No car / transport | 0% | 0% | 0% | 3% |
| Cheapest method | 0% | 1% | 1% | 1% |
| It is free | 0% | 0% | 14% | 0% |
| On way to work | 0% | 9% | 0% | 0% |
| Too young to travel any other way | 0% | 7% | 2% | 1% |
| Relative meets child | 0% | 1% | 0% | 0% |
| Other reason(s) | 0% | 5% | 1% | 2% |
| Sample size (=100%) | 930 | 470 | 290 | 100 |
*Percentages may total to more than 100% as respondents can give multiple answers. Table only includes those who have given a reason (question asked only of a sub-sample from 2005).
| Age | |||
|---|---|---|---|
| Primary: 4-11 |
Secondary: 12-18 |
All | |
| by whether they could use public transport | cell percentages | ||
| Yes | .. | .. | .. |
| No | .. | .. | .. |
| Sample size (=100%) | .. | .. | .. |
| If they could use public transport, reasons for not using it | |||
| Too young to travel on own | .. | .. | .. |
| Inconvenient | .. | .. | .. |
| No service available | .. | .. | .. |
| Too far to bus stop | .. | .. | .. |
| Cost,too expensive | .. | .. | .. |
| Too short a distance,not worth it | .. | .. | .. |
| Prefer to use car | .. | .. | .. |
| Others | .. | .. | .. |
| Sample size (=100%) | .. | .. | .. |
| If they could not use public transport, reasons why they cannot | |||
| Too young to travel on own | .. | .. | .. |
| No service available | .. | .. | .. |
| Inconvenient | .. | .. | .. |
| Too far to bus stop | .. | .. | .. |
| Cost,too expensive | .. | .. | .. |
| Too short a distance,not worth it | .. | .. | .. |
| Prefer to use car | .. | .. | .. |
| Others | .. | .. | .. |
| Sample size (=100%) | .. | .. | .. |
*Percentages may total to more than 100% as respondents can give multiple answers. Table only includes those who have given a reason (question asked only of a sub-sample from 2005).
Not asked in 2015 - now biennial
| Bicycles that can be used by adults: | Cars / vans 1 available for private use: | |||||||||||||
|---|---|---|---|---|---|---|---|---|---|---|---|---|---|---|
| None | One | Two | Three + | One + | Two + | Sample size (=100%) | None | One | Two | Three + | One+ | Two+ | Sample size (=100%) | |
| Row percentages | cell percentages | Row percentages | cell percentages | |||||||||||
| All households | 64.9 | 16.8 | 12.0 | 6.3 | 35.1 | 18.3 | 10,330 | 30.0 | 43.3 | 21.7 | 5.1 | 70.1 | 26.8 | 10,330 |
| by household type: | ||||||||||||||
| Single adult | 72.6 | 22.4 | 3.7 | 1.3 | 27.4 | 5.0 | 1,820 | 49.7 | 45.6 | 3.6 | 1.2 | 50.4 | 4.8 | 1,820 |
| Small adult | 56.9 | 17.6 | 18.8 | 6.7 | 43.1 | 25.5 | 1,650 | 20.4 | 40.4 | 35.1 | 4.1 | 79.6 | 39.2 | 1,650 |
| Single parent | 70.4 | 20.6 | 6.6 | 2.4 | 29.6 | 9.0 | 560 | 49.1 | 46.9 | 3.3 | 0.7 | 50.9 | 4.0 | 560 |
| Small family | 43.6 | 20.9 | 24.2 | 11.4 | 56.5 | 35.6 | 1,300 | 11.3 | 42.8 | 42.8 | 3.2 | 88.8 | 46.0 | 1,300 |
| Large family | 38.7 | 18.0 | 20.3 | 23.0 | 61.3 | 43.3 | 590 | 9.7 | 37.2 | 39.5 | 13.6 | 90.3 | 53.1 | 590 |
| Large adult | 43.9 | 20.4 | 18.1 | 17.6 | 56.1 | 35.7 | 890 | 13.1 | 24.8 | 34.7 | 27.4 | 86.9 | 62.1 | 890 |
| Older smaller | 74.7 | 12.1 | 10.6 | 2.6 | 25.3 | 13.2 | 1,760 | 14.8 | 58.6 | 24.1 | 2.4 | 85.1 | 26.5 | 1,760 |
| Single pensioner | 91.2 | 7.1 | 1.4 | 0.4 | 8.9 | 1.8 | 1,760 | 57.3 | 40.9 | 1.6 | 0.2 | 42.7 | 1.8 | 1,760 |
| by annual net household income: | ||||||||||||||
| up to £10,000 p.a. | 83.0 | 12.2 | 3.8 | 1.0 | 17.0 | 4.8 | 1,190 | 59.9 | 32.3 | 5.8 | 2.0 | 40.1 | 7.8 | 1,190 |
| over £10,000 - £15,000 | 83.6 | 11.4 | 4.0 | 1.0 | 16.4 | 5.0 | 1,770 | 53.2 | 39.9 | 6.1 | 0.8 | 46.8 | 6.9 | 1,770 |
| over £15,000 - £20,000 | 74.3 | 16.5 | 6.8 | 2.4 | 25.7 | 9.2 | 1,560 | 39.9 | 49.3 | 8.4 | 2.5 | 60.2 | 10.9 | 1,560 |
| over £20,000 - £25,000 | 67.0 | 20.0 | 9.4 | 3.6 | 33.0 | 13.0 | 1,210 | 26.1 | 55.0 | 16.0 | 2.8 | 73.8 | 18.8 | 1,210 |
| over £25,000 - £30,000 | 59.4 | 21.1 | 13.4 | 6.1 | 40.6 | 19.5 | 960 | 14.6 | 55.0 | 24.8 | 5.5 | 85.3 | 30.3 | 960 |
| over £30,000 - £40,000 | 49.4 | 22.0 | 19.5 | 9.1 | 50.6 | 28.6 | 1,430 | 7.9 | 47.1 | 37.0 | 7.9 | 92.0 | 44.9 | 1,430 |
| over £40,000 p.a. | 37.7 | 18.2 | 25.7 | 18.4 | 62.3 | 44.1 | 1,870 | 3.0 | 33.1 | 51.2 | 12.7 | 97.0 | 63.9 | 1,870 |
| by Scottish Index of Multiple Deprivation: | ||||||||||||||
| 1 - Most Deprived | 78.6 | 13.9 | 5.1 | 2.5 | 21.5 | 7.6 | 1,910 | 51.7 | 37.6 | 9.5 | 1.2 | 48.3 | 10.7 | 1,910 |
| 2 | 73.4 | 15.3 | 8.2 | 3.1 | 26.6 | 11.3 | 2,070 | 37.7 | 43.5 | 15.8 | 2.9 | 62.2 | 18.7 | 2,070 |
| 3 | 63.3 | 18.4 | 11.6 | 6.7 | 36.7 | 18.3 | 2,280 | 27.9 | 44.4 | 22.3 | 5.4 | 72.1 | 27.7 | 2,280 |
| 4 | 55.1 | 18.4 | 17.1 | 9.3 | 44.8 | 26.4 | 2,240 | 16.3 | 46.7 | 29.2 | 7.8 | 83.7 | 37.0 | 2,240 |
| 5 - Least Deprived | 53.0 | 18.2 | 18.6 | 10.2 | 47.0 | 28.8 | 1,830 | 14.5 | 44.2 | 32.8 | 8.5 | 85.5 | 41.3 | 1,830 |
| by urban/rural classification: | ||||||||||||||
| Large urban areas | 70.0 | 16.2 | 9.5 | 4.2 | 29.9 | 13.7 | 3,090 | 40.1 | 40.9 | 16.2 | 2.8 | 59.9 | 19.0 | 3,090 |
| Other urban | 67.4 | 16.2 | 10.6 | 5.8 | 32.6 | 16.4 | 3,490 | 29.6 | 45.7 | 20.3 | 4.4 | 70.4 | 24.7 | 3,490 |
| Small accessible towns | 59.1 | 19.6 | 13.8 | 7.5 | 40.9 | 21.3 | 960 | 21.9 | 43.3 | 26.7 | 8.1 | 78.1 | 34.8 | 960 |
| Small remote towns | 66.2 | 17.7 | 10.5 | 5.7 | 33.9 | 16.2 | 620 | 29.6 | 47.2 | 18.0 | 5.2 | 70.4 | 23.2 | 620 |
| Accessible rural | 50.4 | 16.7 | 20.1 | 12.7 | 49.5 | 32.8 | 1,120 | 11.7 | 40.8 | 37.0 | 10.5 | 88.3 | 47.5 | 1,120 |
| Remote rural | 54.3 | 19.2 | 17.9 | 8.6 | 45.7 | 26.5 | 1,040 | 16.8 | 45.3 | 29.9 | 8.0 | 83.2 | 37.9 | 1,040 |
| 17-19 | 20-29 | 30-39 | 40-49 | 50-59 | 60-69 | 70-79 | 80+ | All 17+ | Sample size of group | |
|---|---|---|---|---|---|---|---|---|---|---|
| percentage of the relevant sub-group* | ||||||||||
| All people aged 17+: | 25.8 | 54.4 | 71.8 | 81.9 | 77.8 | 75.6 | 62.0 | 43.1 | 68.0 | 9,340 |
| by gender: | ||||||||||
| Male | 28.0 | 55.4 | 72.8 | 84.6 | 83.8 | 83.3 | 75.8 | 66.6 | 73.4 | 4,210 |
| Female | 23.3 | 53.3 | 70.9 | 79.3 | 72.2 | 68.1 | 51.7 | 27.0 | 63.1 | 5,130 |
| by current situation: | ||||||||||
| Self employed | * | * | 86.1 | 99.1 | 95.0 | 94.2 | * | * | 91.9 | 560 |
| Employed full time | * | 71.5 | 82.5 | 87.3 | 85.1 | 85.6 | * | * | 81.4 | 3,130 |
| Employed part time | * | 46.1 | 73.2 | 80.9 | 77.3 | 78.3 | * | * | 71.9 | 980 |
| Looking after the home or family | * | 28.4 | 46.8 | 73.5 | 68.7 | * | * | * | 53.4 | 450 |
| Permanently retired from work | * | * | * | * | 77.9 | 74.4 | 61.2 | 43.0 | 63.3 | 3,030 |
| Unemployed and seeking work | * | 20.4 | 29.1 | 41.9 | 45.4 | * | * | * | 28.7 | 300 |
| In further / higher education | 26.5 | 38.7 | * | * | * | * | * | * | 37.0 | 290 |
| Permanently sick or disabled | * | * | 21.0 | 39.8 | 42.3 | 42.4 | * | * | 36.5 | 460 |
| by annual net household income: | ||||||||||
| up to £10,000 p.a. | * | 30.7 | 31.8 | 49.8 | 54.6 | 67.7 | 56.1 | 33.6 | 45.0 | 1,110 |
| over £10,000 - £15,000 | * | 36.9 | 44.6 | 46.0 | 52.8 | 66.1 | 50.7 | 36.9 | 48.7 | 1,670 |
| over £15,000 - £20,000 | * | 48.1 | 62.9 | 64.4 | 70.4 | 65.3 | 60.6 | 45.2 | 58.2 | 1,450 |
| over £20,000 - £25,000 | * | 49.3 | 61.8 | 84.5 | 70.5 | 73.3 | 71.2 | 58.6 | 67.7 | 1,100 |
| over £25,000 - £30,000 | * | 63.1 | 77.3 | 81.8 | 79.1 | 76.2 | 76.3 | * | 71.4 | 860 |
| over £30,000 - £40,000 | * | 68.2 | 83.5 | 86.9 | 85.9 | 92.2 | 75.8 | * | 80.4 | 1,250 |
| over £40,000 p.a. | * | 81.4 | 86.9 | 96.7 | 93.2 | 93.5 | 93.0 | * | 88.8 | 1,600 |
| by Scottish Index of Multiple Deprivation: | ||||||||||
| 1 - Most Deprived | * | 44.3 | 51.8 | 53.8 | 48.4 | 46.6 | 40.8 | 22.1 | 45.9 | 1,720 |
| 2 | * | 47.7 | 70.2 | 75.4 | 70.2 | 64.5 | 46.9 | 30.6 | 58.9 | 1,900 |
| 3 | * | 56.8 | 73.3 | 84.9 | 84.5 | 75.5 | 61.0 | 40.2 | 70.7 | 2,040 |
| 4 | * | 61.4 | 86.7 | 92.2 | 90.4 | 89.4 | 76.0 | 49.1 | 81.1 | 2,060 |
| 5 - Least Deprived | * | 68.1 | 80.9 | 96.6 | 90.4 | 93.6 | 77.8 | 66.0 | 82.1 | 1,620 |
| by urban/rural: | ||||||||||
| Large urban areas | 17.9 | 51.9 | 65.3 | 78.0 | 70.7 | 67.6 | 47.1 | 39.8 | 60.9 | 2,740 |
| Other urban | 25.2 | 52.9 | 75.0 | 77.8 | 73.9 | 73.2 | 62.2 | 37.7 | 66.2 | 3,200 |
| Small accessible towns | * | 68.2 | 70.9 | 88.5 | 84.1 | 83.0 | 64.4 | 48.0 | 75.8 | 850 |
| Small remote towns | * | 55.7 | 66.4 | 65.5 | 78.2 | 75.1 | 67.3 | 42.8 | 64.4 | 580 |
| Accessible rural | * | 67.4 | 85.1 | 97.3 | 89.4 | 89.0 | 83.7 | 56.1 | 83.9 | 1,000 |
| Remote rural | * | 52.9 | 85.3 | 89.4 | 93.8 | 87.7 | 75.1 | 58.6 | 81.2 | 970 |
| Sample size of age groups | 190 | 1,070 | 1,310 | 1,470 | 1,680 | 1,700 | 1,220 | 700 | 9,340 | |
** Percentages based on a denominator of 50 respondents or fewer are not shown.
* Denominator includes people for whom it was not known, or not recorded, what type of driving licence (if any) was held.
Estimates based on smaller sample sizes may be subject to larger levels of variation and therefore may see relatively large fluctuations over time
| Every day | At least 3 times per week | 1 - 2 times per week | At least 2 - 3 times per month | At least once a month | Less than once a month | Has licence but never drives | Does not have a full driving licence | sample size (=100%) | ||
|---|---|---|---|---|---|---|---|---|---|---|
| All people | 40.9 | 14.5 | 5.9 | 0.8 | 0.5 | 1.4 | 4.0 | 32.0 | 9,340 | |
| by gender: | ||||||||||
| Male | 45.7 | 15.1 | 6.5 | 0.6 | 0.5 | 1.3 | 3.6 | 26.6 | 4,210 | |
| Female | 36.5 | 14.0 | 5.4 | 1.0 | 0.4 | 1.5 | 4.3 | 36.9 | 5,130 | |
| by age: | ||||||||||
| 17-19 | 16.5 | 3.4 | 3.2 | 0.0 | 0.0 | 0.2 | 2.5 | 74.2 | 190 | |
| 20-29 | 33.1 | 9.8 | 3.4 | 1.0 | 0.4 | 2.4 | 4.2 | 45.6 | 1,070 | |
| 30-39 | 48.2 | 12.6 | 5.2 | 1.1 | 0.6 | 1.2 | 3.0 | 28.2 | 1,310 | |
| 40-49 | 57.7 | 13.6 | 5.7 | 0.3 | 0.6 | 0.7 | 3.3 | 18.1 | 1,470 | |
| 50-59 | 49.9 | 15.5 | 6.4 | 0.9 | 0.2 | 1.3 | 3.5 | 22.2 | 1,680 | |
| 60-69 | 38.1 | 21.6 | 8.8 | 0.6 | 0.3 | 1.4 | 4.9 | 24.4 | 1,700 | |
| 70-79 | 26.2 | 19.3 | 6.3 | 1.0 | 1.0 | 2.6 | 5.7 | 38.0 | 1,220 | |
| 80+ | 12.0 | 14.2 | 9.0 | 0.4 | 0.4 | 1.0 | 6.0 | 56.9 | 700 | |
| by current situation: | ||||||||||
| Self employed | 66.7 | 16.7 | 6.1 | 0.3 | 0.0 | 0.7 | 1.4 | 8.1 | 560 | |
| Employed full time | 57.5 | 13.2 | 5.6 | 0.8 | 0.4 | 1.3 | 2.6 | 18.6 | 3,130 | |
| Employed part time | 49.6 | 12.1 | 4.4 | 0.5 | 0.2 | 1.3 | 3.6 | 28.1 | 980 | |
| Looking after the home or family | 25.7 | 18.8 | 5.1 | 0.3 | 0.5 | 0.4 | 2.6 | 46.6 | 450 | |
| Permanently retired from work | 25.8 | 20.4 | 8.5 | 0.9 | 0.6 | 1.5 | 5.6 | 36.7 | 3,030 | |
| Unemployed and seeking work | 8.9 | 6.2 | 5.0 | 0.7 | 0.6 | 1.8 | 5.5 | 71.3 | 300 | |
| In further / higher education | 15.6 | 6.8 | 3.2 | 1.0 | 1.1 | 2.3 | 7.0 | 63.0 | 290 | |
| Permanently sick or disabled | 7.7 | 9.3 | 4.7 | 0.8 | 0.6 | 4.1 | 9.3 | 63.5 | 450 | |
| by annual net household income: | ||||||||||
| up to £10,000 p.a. | 17.7 | 11.5 | 5.4 | 1.1 | 0.6 | 2.0 | 6.6 | 55.0 | 1,110 | |
| over £10,000 - £15,000 | 21.9 | 10.7 | 5.9 | 0.7 | 0.7 | 1.6 | 7.2 | 51.3 | 1,670 | |
| over £15,000 - £20,000 | 29.0 | 15.1 | 5.3 | 0.9 | 0.6 | 2.0 | 5.4 | 41.8 | 1,450 | |
| over £20,000 - £25,000 | 38.6 | 16.0 | 5.8 | 0.7 | 0.5 | 2.3 | 3.9 | 32.3 | 1,100 | |
| over £25,000 - £30,000 | 45.4 | 13.7 | 6.7 | 0.9 | 0.1 | 1.4 | 3.2 | 28.6 | 860 | |
| over £30,000 - £40,000 | 56.0 | 14.6 | 6.1 | 0.8 | 0.2 | 1.0 | 1.7 | 19.6 | 1,250 | |
| over £40,000 p.a. | 61.9 | 17.2 | 6.3 | 0.7 | 0.4 | 0.8 | 1.5 | 11.2 | 1,600 | |
| by Scottish Index of Multiple Deprivation: | ||||||||||
| 1 - Most Deprived | 26.9 | 8.9 | 4.1 | 0.4 | 0.2 | 0.8 | 4.5 | 54.1 | 1,720 | |
| 2 | 34.2 | 11.9 | 5.0 | 0.6 | 0.6 | 2.2 | 4.3 | 41.1 | 1,900 | |
| 3 | 42.8 | 14.1 | 6.4 | 1.0 | 0.3 | 1.5 | 4.6 | 29.3 | 2,040 | |
| 4 | 49.9 | 18.1 | 7.6 | 0.8 | 0.4 | 1.4 | 2.9 | 18.9 | 2,060 | |
| 5 - Least Deprived | 49.6 | 19.1 | 6.5 | 1.0 | 0.8 | 1.3 | 3.7 | 17.9 | 1,620 | |
| by urban/rural: | ||||||||||
| Large urban areas | 33.5 | 12.3 | 6.2 | 1.0 | 0.7 | 1.8 | 5.3 | 39.1 | 2,740 | |
| Other urban | 40.4 | 14.6 | 5.3 | 0.8 | 0.3 | 1.3 | 3.5 | 33.8 | 3,200 | |
| Small accessible towns | 51.0 | 14.5 | 6.0 | 0.2 | 0.3 | 0.6 | 3.2 | 24.2 | 850 | |
| Small remote towns | 37.5 | 16.5 | 5.9 | 0.4 | 0.1 | 1.4 | 2.6 | 35.6 | 580 | |
| Accessible rural | 55.1 | 17.1 | 6.3 | 0.6 | 0.6 | 1.4 | 2.8 | 16.1 | 1,000 | |
| Remote rural | 47.6 | 20.8 | 7.4 | 0.8 | 0.0 | 1.3 | 3.4 | 18.8 | 970 | |
*The frequency of driving is shown only for those who hold a full driving licence
| 2009 | 2010 | 2011 | 2012 | 2013 | 2014 | 2015 | |
|---|---|---|---|---|---|---|---|
| Whether made any journeys using part driving/parking in past month | column percentages | ||||||
| Yes | 19.3 | 19.2 | 19.9 | 18.7 | 16.3 | 17.2 | 16.4 |
| No | 80.6 | 80.5 | 80 | 81.3 | 83.5 | 82.8 | 83.5 |
| Sample size (=100%) | 7,730 | 7,610 | 7,910 | 6,110 | 6,220 | 6,080 | 5,920 |
| Where parked last time used part driving/parking | cell percentages | ||||||
| A specially designated Park and Ride facility | 27.4 | 27.2 | 29.4 | 30 | 29.3 | 28.2 | 29.8 |
| An ordinary car park at a bus station, train station or airport | 27.7 | 29.9 | 27.5 | 30.3 | 30.7 | 28.6 | 30.8 |
| A public car park | 15.2 | 14.7 | 14.5 | 13.9 | 13.4 | 15.4 | 11.9 |
| On the street near a station or bus stop | 15.2 | 14.2 | 13.3 | 13.8 | 17.2 | 14.9 | 15.9 |
| On the street elsewhere | 11.8 | 13.3 | 12.2 | 11.5 | 8.6 | 12.7 | 9.3 |
| Other | 2.6 | 0.6 | 3.1 | 0.6 | 0.8 | 0.1 | 2.3 |
| Sample size (=100%) | 1,430 | 1,430 | 1,540 | 1,100 | 1,000 | 1,000 | 940 |
| Reasons for not using designated park and ride facility when made a part driving/parking journey | column percentages | ||||||
| No designated Park and Ride facility available | 74.5 | 73.4 | 77.6 | 83.4 | |||
| Journey would take longer | 10.8 | 10.0 | 12.2 | 9.8 | |||
| No need/car park in town | 4.9 | 1.9 | 4.2 | 1.5 | |||
| Other (specify) | 3.5 | 6.0 | 1.6 | 1.9 | |||
| Too much to carry | 2.3 | 2.8 | 0.9 | 1.3 | |||
| Costs too much | 2.0 | 5.0 | 1.0 | 1.0 | |||
| Concerns about vehicle / car park security | 0.9 | ** | 1.2 | 1.4 | |||
| Sample size (=100%) | 690 | 630 | 670 | 610 | |||
*Table only includes those who have given a reason.
| Bus | Train | Walk | Sample size (=100%) | |
|---|---|---|---|---|
| row percentages | ||||
| All adults who used driving/parking in past month | 28.7 | 53.5 | 14.1 | 4,080 |
| by where parked: | ||||
| A specially designated Park and Ride facility | 45.4 | 54.5 | 1.2 | 1,150 |
| An ordinary car park at a bus station, train station or airport | 9.6 | 82.0 | 2.4 | 1,220 |
| A public car park | 33.0 | 32.1 | 28.8 | 600 |
| On the street near a station or bus stop | 37.7 | 46.6 | 15.2 | 630 |
| On the street elsewhere | 19.0 | 13.5 | 58.6 | 410 |
*Percentages may total to more than 100% as respondents can give multiple answers.
Table 23: Concerns with traffic growth
Following changes to the Scottish Household survey data for Table 23 is no longer collected - Please see
TATIS 2011 for the most recently produced version of the table.
Table 24: Incidents of road rage directed at respondents in past year
Following changes to the Scottish Household survey data for Table 24 is no longer collected - Please see
TATIS 2011 for the most recently produced version of the table.
| Walking as a means of transport | Walking just for pleasure / to keep fit | Sample size (=100%) | |||||||
|---|---|---|---|---|---|---|---|---|---|
| None | 1-2 days | 3-5 days | 6-7 days | None | 1-2 days | 3-5 days | 6-7 days | ||
| row percentages | |||||||||
| All people: | 33 | 19 | 26 | 22 | 42 | 20 | 18 | 20 | 9,690 |
| by gender: | |||||||||
| Male | 32 | 19 | 26 | 23 | 41 | 20 | 18 | 21 | 4,390 |
| Female | 34 | 19 | 26 | 20 | 43 | 20 | 17 | 20 | 5,300 |
| by age: | |||||||||
| 16-19 | 19 | 16 | 41 | 25 | 40 | 18 | 28 | 14 | 290 |
| 20-29 | 24 | 19 | 29 | 27 | 39 | 24 | 17 | 20 | 1,140 |
| 30-39 | 28 | 20 | 28 | 24 | 37 | 24 | 18 | 21 | 1,350 |
| 40-49 | 33 | 22 | 25 | 20 | 36 | 22 | 20 | 22 | 1,590 |
| 50-59 | 35 | 19 | 26 | 20 | 38 | 20 | 18 | 25 | 1,670 |
| 60-69 | 36 | 19 | 24 | 21 | 43 | 18 | 17 | 22 | 1,660 |
| 70-79 | 44 | 18 | 20 | 18 | 54 | 16 | 14 | 17 | 1,280 |
| 80+ | 61 | 14 | 15 | 10 | 73 | 10 | 8 | 9 | 720 |
| by current situation: | |||||||||
| Self employed | 36 | 19 | 26 | 20 | 32 | 19 | 22 | 27 | 540 |
| Employed full time | 30 | 22 | 27 | 21 | 37 | 24 | 19 | 20 | 3,230 |
| Employed part time | 28 | 21 | 29 | 23 | 33 | 22 | 19 | 26 | 1,000 |
| Looking after the home/family | 25 | 16 | 31 | 28 | 34 | 19 | 18 | 29 | 450 |
| Permanently retired from work | 44 | 18 | 20 | 18 | 53 | 15 | 14 | 18 | 3,080 |
| Unemployed/seeking work | 20 | 15 | 33 | 32 | 37 | 19 | 19 | 26 | 420 |
| In further/higher education | 14 | 16 | 36 | 33 | 36 | 26 | 20 | 19 | 320 |
| Permanently sick or disabled | 61 | 14 | 14 | 11 | 71 | 8 | 9 | 12 | 460 |
| by annual net household income: | |||||||||
| up to £10,000 p.a. | 31 | 17 | 26 | 26 | 46 | 18 | 16 | 21 | 1,290 |
| over £10,000 - £15,000 | 37 | 16 | 25 | 22 | 49 | 16 | 16 | 19 | 1,770 |
| over £15,000 - £20,000 | 34 | 18 | 23 | 24 | 46 | 18 | 15 | 21 | 1,540 |
| over £20,000 - £25,000 | 36 | 18 | 26 | 20 | 47 | 19 | 17 | 17 | 1,150 |
| over £25,000 - £30,000 | 30 | 22 | 27 | 21 | 43 | 20 | 16 | 21 | 910 |
| over £30,000 - £40,000 | 31 | 22 | 28 | 20 | 33 | 24 | 20 | 23 | 1,180 |
| over £40,000 p.a. | 33 | 22 | 27 | 18 | 34 | 24 | 21 | 21 | 1,600 |
| by Scottish Index of Multiple Deprivation quintiles: | |||||||||
| 1 (20% most deprived) | 32 | 19 | 26 | 23 | 47 | 18 | 16 | 19 | 1,890 |
| 2' | 36 | 17 | 26 | 21 | 48 | 19 | 15 | 18 | 1,980 |
| 3' | 35 | 18 | 26 | 21 | 40 | 18 | 20 | 22 | 2,090 |
| 4' | 36 | 19 | 24 | 21 | 36 | 23 | 18 | 23 | 2,090 |
| 5 (20% least deprived) | 26 | 23 | 29 | 22 | 36 | 23 | 20 | 21 | 1,640 |
| by urban/rural classification: | |||||||||
| Large urban areas | 26 | 18 | 27 | 29 | 44 | 20 | 17 | 19 | 2,880 |
| Other urban | 34 | 20 | 27 | 18 | 44 | 20 | 17 | 19 | 3,220 |
| Small accessible towns | 35 | 19 | 31 | 14 | 36 | 23 | 20 | 21 | 930 |
| Small remote towns | 32 | 18 | 25 | 25 | 39 | 19 | 20 | 22 | 590 |
| Accessible rural | 42 | 19 | 22 | 17 | 34 | 20 | 20 | 25 | 1,050 |
| Remote rural | 44 | 19 | 18 | 19 | 39 | 16 | 18 | 27 | 1,020 |
| by frequency of driving†: | |||||||||
| Every day | 41 | 22 | 23 | 15 | 38 | 21 | 18 | 22 | 3,770 |
| At least three times a week | 31 | 23 | 30 | 16 | 35 | 25 | 23 | 18 | 1,390 |
| Once or twice a week | 27 | 21 | 28 | 25 | 39 | 22 | 16 | 23 | 580 |
| Less often | 23 | 14 | 28 | 35 | 39 | 25 | 17 | 19 | 280 |
| Never, but holds full driving licence | 27 | 15 | 23 | 35 | 45 | 21 | 12 | 23 | 450 |
*Only trips longer than a quarter of a mile are recorded.
†Only includes those with a full driving licence.
1. Question asked in survey every other year. 2014 is the most recent data available.
| Cycling as a means of transport | Cycling just for pleasure / to keep fit | Sample size (=100%) | |||||||
|---|---|---|---|---|---|---|---|---|---|
| None | 1-2 days | 3-5 days | 6-7 days | None | 1-2 days | 3-5 days | 6-7 days | ||
| row percentages | |||||||||
| All people: | 94 | 3 | 2 | 1 | 94 | 3 | 2 | 1 | 9,790 |
| by gender: | |||||||||
| Male | 91 | 4 | 3 | 2 | 91 | 5 | 3 | 1 | 4,440 |
| Female | 96 | 2 | 1 | 1 | 96 | 2 | 1 | 1 | 5,350 |
| by age: | |||||||||
| 16-19 | 94 | 1 | 4 | 1 | 95 | 1 | 3 | 1 | 290 |
| 20-29 | 92 | 3 | 3 | 2 | 94 | 3 | 2 | 0 | 1,160 |
| 30-39 | 92 | 4 | 3 | 2 | 92 | 5 | 2 | 1 | 1,370 |
| 40-49 | 91 | 4 | 3 | 2 | 89 | 6 | 3 | 1 | 1,600 |
| 50-59 | 94 | 3 | 2 | 1 | 93 | 4 | 2 | 1 | 1,680 |
| 60-69 | 97 | 1 | 1 | 1 | 96 | 2 | 2 | 1 | 1,680 |
| 70-79 | 99 | 1 | 0 | 0 | 98 | 1 | 0 | 0 | 1,290 |
| 80+ | 99 | 0 | 0 | 0 | 99 | 0 | 1 | 0 | 730 |
| by current situation: | |||||||||
| Self employed | 91 | 4 | 4 | 2 | 89 | 6 | 3 | 2 | 540 |
| Employed full time | 92 | 3 | 3 | 1 | 92 | 5 | 2 | 1 | 3,250 |
| Employed part time | 93 | 3 | 2 | 2 | 94 | 3 | 2 | 1 | 1,010 |
| Looking after the home/family | 96 | 2 | 1 | 1 | 97 | 2 | 1 | 0 | 460 |
| Permanently retired from work | 98 | 1 | 1 | 0 | 98 | 1 | 1 | 1 | 3,120 |
| Unemployed/seeking work | 94 | 3 | 2 | 1 | 94 | 2 | 2 | 2 | 430 |
| In further/higher education | 90 | 6 | 3 | 2 | 93 | 3 | 2 | 1 | 330 |
| Permanently sick or disabled | 99 | 1 | 0 | 1 | 99 | 0 | 0 | 1 | 460 |
| by annual net household income: | |||||||||
| up to £10,000 p.a. | 95 | 2 | 1 | 2 | 97 | 2 | 1 | 1 | 1,310 |
| over £10,000 - £15,000 | 96 | 2 | 1 | 1 | 96 | 2 | 1 | 1 | 1,780 |
| over £15,000 - £20,000 | 96 | 2 | 1 | 1 | 97 | 2 | 1 | 1 | 1,550 |
| over £20,000 - £25,000 | 95 | 2 | 3 | 1 | 96 | 2 | 2 | 1 | 1,160 |
| over £25,000 - £30,000 | 94 | 3 | 2 | 1 | 94 | 3 | 2 | 1 | 920 |
| over £30,000 - £40,000 | 92 | 3 | 3 | 1 | 92 | 5 | 2 | 1 | 1,190 |
| over £40,000 p.a. | 91 | 4 | 4 | 1 | 89 | 6 | 4 | 1 | 1,600 |
| by Scottish Index of Multiple Deprivation quintiles: | |||||||||
| 1 (20% most deprived) | 95 | 2 | 2 | 1 | 96 | 2 | 1 | 1 | 1,920 |
| 2' | 96 | 2 | 2 | 1 | 97 | 2 | 1 | 0 | 2,000 |
| 3' | 94 | 2 | 2 | 1 | 93 | 3 | 2 | 1 | 2,110 |
| 4' | 93 | 3 | 3 | 1 | 92 | 5 | 3 | 1 | 2,110 |
| 5 (20% least deprived) | 92 | 3 | 3 | 2 | 92 | 5 | 3 | 1 | 1,660 |
| by urban/rural classification: | |||||||||
| Large urban areas | 93 | 3 | 3 | 2 | 95 | 3 | 2 | 1 | 2,950 |
| Other urban | 95 | 2 | 2 | 1 | 94 | 3 | 2 | 0 | 3,230 |
| Small accessible towns | 96 | 1 | 2 | 1 | 95 | 3 | 2 | 0 | 940 |
| Small remote towns | 91 | 2 | 4 | 2 | 91 | 3 | 4 | 2 | 600 |
| Accessible rural | 94 | 3 | 2 | 1 | 91 | 5 | 2 | 1 | 1,060 |
| Remote rural | 92 | 5 | 2 | 1 | 90 | 6 | 3 | 1 | 1,020 |
| by frequency of driving†: | |||||||||
| Every day | 95 | 3 | 2 | 1 | 93 | 5 | 2 | 1 | 3,790 |
| At least three times a week | 92 | 3 | 4 | 1 | 91 | 5 | 3 | 0 | 1,410 |
| Once or twice a week | 89 | 2 | 7 | 2 | 91 | 3 | 4 | 2 | 590 |
| Less often | 89 | 3 | 3 | 4 | 94 | 2 | 1 | 3 | 290 |
| Never, but holds full driving licence | 92 | 3 | 1 | 3 | 95 | 2 | 1 | 2 | 460 |
*Only trips longer than a quarter of a mile are recorded.
†Only includes those with a full driving licence.
1. Question asked in survey every other year. 2014 is the most recent data available.
| 2009 | 2010 | 2011 | 2012 | 2013 | 2014 | 2015 | Average for 2012-2015 | |
|---|---|---|---|---|---|---|---|---|
| Reasons why do not cycle to work | cell percentages | |||||||
| Too far to cycle | 35.6 | 38.9 | 34.9 | 34.3 | 37.4 | 33.3 | .. | .. |
| Weather too cold / wet / windy | 17.6 | 18.2 | 19.3 | 21.0 | 19.8 | 16.2 | .. | .. |
| Do not have a bike | 13.8 | 13.9 | 12.2 | 16.4 | 14.3 | 11.9 | .. | .. |
| Too many cars on the road | 15.7 | 12.8 | 11.9 | 14.8 | 14.7 | 18.2 | .. | .. |
| Traffic travels too fast | 13.2 | 11.5 | 10.1 | 12.4 | 11.6 | 12.4 | .. | .. |
| Prefer to drive | 10.2 | 11.4 | 9.1 | 10.6 | 10.0 | 9.1 | .. | .. |
| Inconsiderate drivers | 10.0 | 8.5 | 8.0 | 9.9 | 8.9 | 9.1 | .. | .. |
| Concerns for personal safety on dark / lonely roads | 9.9 | 9.1 | 9.6 | 9.1 | 9.0 | 6.7 | .. | .. |
| No way to carry luggage / shopping | 9.4 | 10.3 | 7.9 | 8.3 | 7.9 | 5.9 | .. | .. |
| Nowhere at work to shower / change | 7.7 | 7.8 | 7.6 | 7.5 | 7.3 | 5.5 | .. | .. |
| Don't have time to cycle | 7.9 | 7.9 | 7.0 | 9.2 | 8.3 | 9.2 | .. | .. |
| Too hilly | 5.8 | 5.9 | 7.2 | 7.6 | 6.2 | 4.4 | .. | .. |
| Not fit enough | 5.7 | 6.6 | 6.0 | 5.8 | 4.9 | 5.6 | .. | .. |
| Can't be bothered | 6.4 | 6.3 | 6.4 | 6.8 | 5.9 | 5.3 | .. | .. |
| Road surfaces are dangerous | 3.9 | 5.1 | 6.1 | 4.9 | 5.6 | 4.2 | .. | .. |
| Not enough safe places to lock bike | 2.5 | 2.7 | 2.7 | 2.2 | 4.1 | 1.7 | .. | .. |
| Can’t ride a bike | 2.4 | 1.7 | 1.8 | 2.1 | 2.4 | 2.1 | .. | .. |
| Health reasons | 2.3 | 1.9 | 1.4 | 2.3 | 1.9 | 2.5 | .. | .. |
| Difficult taking bike onto other forms of transport 2 | .. | .. | .. | 1.7 | 2.0 | 1.6 | .. | .. |
| Inconsiderate pedestrians in towns\cities | 1.0 | 0.6 | 0.6 | 0.5 | 0.7 | 0.7 | .. | .. |
| Worried about pollution from traffic | 1.6 | 1.6 | 1.1 | 1.5 | 1.3 | 1.5 | .. | .. |
| Nowhere to keep a bicycle at home | 0.6 | 0.9 | 0.6 | 0.3 | 0.8 | 0.5 | .. | .. |
| Too many bikes stolen | 0.9 | 0.5 | 0.5 | 0.4 | 0.7 | 1.3 | .. | .. |
| Sample size (=100%) | 2,770 | 2,350 | 2,580 | 1,610 | 1,540 | 1,590 | .. | .. |
1. The survey routing was updated in 2012 to ensure that only those with at least one bike in their household were asked this question. To ensure comparability, responses from previous years have only been included in this table where the respondent's household had a bike.
2. Asked from 2012 only
This question was moved to biennial in 2015 so the last data refer to 2014
Table 27: Households' bus availability
Following changes to the Scottish Household survey data for Table 27 is no longer collected - Please see
TATIS 2011 for the most recently produced version of the table.
| Bus | Train | ||||||||||
|---|---|---|---|---|---|---|---|---|---|---|---|
| Every day, or almost every day | 2 or 3 times per week | About once a week | About once a fortnight, or about once a month | Not used in past month | Every day, or almost every day | 2 or 3 times per week | About once a week | About once a fortnight, or about once a month | Not used in past month | Sample size(=100%)* | |
| Row percentages | Row percentages | ||||||||||
| All people aged 16+ | 11.7 | 11.6 | 8.1 | 14.3 | 54.3 | 2.1 | 2.5 | 4.4 | 20.7 | 70.2 | 9410 |
| by gender: | |||||||||||
| Male | 10.7 | 9.7 | 7.7 | 14.0 | 57.9 | 2.2 | 2.7 | 4.2 | 19.1 | 71.8 | 4240 |
| Female | 12.6 | 13.4 | 8.5 | 14.6 | 50.9 | 2.1 | 2.4 | 4.7 | 22.3 | 68.7 | 5160 |
| by age: | |||||||||||
| 16-19 | 21.6 | 18.1 | 6.3 | 19.7 | 34.2 | 2.0 | 3.4 | 7.5 | 25.8 | 61.3 | 260 |
| 20-29 | 14.8 | 12.1 | 9.0 | 14.5 | 49.6 | 3.8 | 4.9 | 5.7 | 25.5 | 60.1 | 1070 |
| 30-39 | 11.0 | 10.7 | 7.7 | 12.0 | 58.7 | 3.3 | 2.7 | 5.6 | 21.9 | 66.5 | 1310 |
| 40-49 | 9.4 | 6.5 | 5.3 | 14.6 | 64.2 | 3.2 | 2.5 | 3.5 | 24.6 | 66.2 | 1470 |
| 50-59 | 8.7 | 7.8 | 6.4 | 14.3 | 62.9 | 1.9 | 2.0 | 4.9 | 21.8 | 69.5 | 1680 |
| 60-69 | 10.4 | 14.2 | 11.2 | 17.0 | 47.2 | 0.3 | 1.7 | 3.6 | 17.2 | 77.3 | 1700 |
| 70-79 | 13.3 | 18.9 | 11.4 | 11.5 | 45.1 | . | 1.1 | 2.3 | 12.3 | 84.4 | 1220 |
| 80+ | 11.9 | 15.2 | 8.6 | 12.5 | 51.8 | . | 0.8 | 1.7 | 6.0 | 91.6 | 700 |
| by current situation: | |||||||||||
| Self employed | 2.7 | 4.7 | 4.5 | 10.4 | 77.7 | 1.1 | 1.1 | 6.9 | 21.3 | 69.5 | 560 |
| Employed full time | 10.8 | 5.7 | 6.2 | 14.0 | 63.3 | 4.1 | 3.0 | 4.5 | 24.8 | 63.6 | 3130 |
| Employed part time | 12.0 | 11.2 | 6.6 | 14.5 | 55.7 | 0.8 | 3.5 | 3.5 | 23.4 | 68.8 | 980 |
| Looking after the home or family | 8.2 | 20.1 | 9.4 | 13.9 | 48.4 | 0.7 | 2.1 | 3.7 | 17.0 | 76.6 | 450 |
| Permanently retired from work | 11.4 | 17.1 | 11.5 | 14.3 | 45.7 | . | 1.2 | 2.8 | 13.9 | 82.1 | 3030 |
| Unemployed and seeking work | 13.7 | 26.8 | 13.2 | 19.0 | 27.4 | 0.9 | 3.1 | 6.0 | 21.7 | 68.4 | 310 |
| In further / higher education | 25.5 | 11.5 | 8.0 | 14.7 | 40.3 | 5.5 | 5.8 | 6.9 | 24.1 | 57.6 | 300 |
| Permanently sick or disabled | 12.0 | 19.2 | 10.0 | 11.8 | 47.0 | . | 1.1 | 3.2 | 11.0 | 84.8 | 460 |
| by annual net household income: | |||||||||||
| up to £10,000 p.a. | 16.5 | 16.5 | 10.6 | 14.4 | 42.1 | 1.0 | 1.4 | 4.7 | 14.9 | 78.1 | 1110 |
| over £10,000 - £15,000 | 17.5 | 16.9 | 11.8 | 12.7 | 41.1 | 1.4 | 2.1 | 2.8 | 16.0 | 77.7 | 1670 |
| over £15,000 - £20,000 | 13.6 | 13.7 | 9.7 | 15.0 | 48.0 | 1.4 | 3.5 | 3.4 | 15.8 | 76.0 | 1460 |
| over £20,000 - £25,000 | 11.8 | 11.8 | 8.1 | 12.4 | 56.0 | 1.3 | 2.4 | 3.9 | 19.7 | 72.8 | 1110 |
| over £25,000 - £30,000 | 9.4 | 13.6 | 6.8 | 13.2 | 57.0 | 1.6 | 3.2 | 3.7 | 19.4 | 72.2 | 870 |
| over £30,000 - £40,000 | 9.7 | 7.1 | 6.6 | 15.2 | 61.5 | 2.6 | 2.3 | 4.4 | 22.2 | 68.5 | 1270 |
| over £40,000 p.a. | 7.0 | 6.8 | 5.5 | 15.6 | 65.1 | 4.0 | 2.8 | 6.7 | 29.8 | 56.7 | 1620 |
| by Scottish Index of Multiple Deprivation: | |||||||||||
| 1 - Most Deprived | 19.0 | 16.0 | 8.8 | 13.6 | 42.6 | 2.0 | 3.1 | 3.3 | 16.6 | 75.1 | 1740 |
| 2 | 13.4 | 12.0 | 9.2 | 12.7 | 52.8 | 1.9 | 2.8 | 4.1 | 17.9 | 73.4 | 1900 |
| 3 | 10.6 | 10.2 | 7.1 | 13.0 | 59.1 | 2.5 | 2.3 | 3.4 | 21.8 | 70.1 | 2050 |
| 4 | 7.3 | 8.2 | 6.7 | 13.7 | 64.1 | 2.0 | 2.2 | 4.9 | 21.8 | 69.2 | 2080 |
| 5 - Least Deprived | 8.6 | 12.1 | 9.0 | 18.6 | 51.7 | 2.3 | 2.5 | 6.5 | 25.3 | 63.5 | 1640 |
| by urban/rural: | |||||||||||
| Large urban areas | 18.8 | 16.3 | 11.4 | 16.2 | 37.3 | 2.9 | 3.2 | 5.9 | 23.1 | 64.9 | 2760 |
| Other urban | 10.3 | 10.9 | 7.1 | 12.8 | 58.9 | 2.4 | 2.8 | 3.9 | 22.3 | 68.6 | 3220 |
| Small accessible towns | 5.9 | 9.8 | 8.5 | 16.8 | 59.0 | 1.4 | 2.7 | 4.8 | 16.9 | 74.2 | 860 |
| Small remote towns | 1.8 | 5.9 | 5.5 | 11.1 | 75.7 | 0.2 | 0.2 | 1.9 | 16.4 | 81.2 | 580 |
| Accessible rural | 6.2 | 5.6 | 4.2 | 14.0 | 70.1 | 1.0 | 1.3 | 3.8 | 17.7 | 76.2 | 1010 |
| Remote rural | 2.5 | 6.0 | 2.9 | 11.0 | 77.6 | . | . | 1.3 | 11.4 | 87.2 | 980 |
| by frequency of driving†: | |||||||||||
| Every day | 1.7 | 3.3 | 5.1 | 14.4 | 75.5 | 1.3 | 1.5 | 4.0 | 24.1 | 69.1 | 3680 |
| At least three times a week | 4.2 | 9.1 | 7.1 | 16.8 | 62.8 | 1.6 | 3.4 | 4.8 | 22.0 | 68.3 | 1450 |
| Once or twice a week | 8.3 | 13.6 | 9.0 | 17.1 | 52.0 | 6.2 | 0.5 | 3.0 | 15.7 | 74.5 | 560 |
| Less often | 12.1 | 12.8 | 11.2 | 17.8 | 46.1 | 5.6 | 1.9 | 7.9 | 23.1 | 61.5 | 230 |
| Never, but holds full driving licence | 22.4 | 22.1 | 12.3 | 13.2 | 30.1 | 3.5 | 3.8 | 5.1 | 16.8 | 70.8 | 430 |
| by driving licence: | |||||||||||
| Holds a full driving licence | 4.4 | 6.9 | 6.6 | 15.2 | 66.9 | 2.1 | 2.0 | 4.3 | 22.4 | 69.2 | 6350 |
| Does NOT hold a full driving licence | 26.5 | 21.2 | 11.3 | 12.6 | 28.4 | 2.2 | 3.7 | 4.7 | 17.2 | 72.2 | 3060 |
* Sample size given is for train use as the bus use and train use numbers are comparable.
†Only includes those with a full driving licence
| Strongly agree | Tend to agree | Total agree | Neither agree nor disagree | Tend to disagree | Strongly disagree | No opinion | Sample size (=100%) | |
|---|---|---|---|---|---|---|---|---|
| Row percentages | ||||||||
| Buses run to timetable | 26.7 | 51.2 | 77.9 | 5.9 | 9.7 | 4.5 | 2.0 | 4,070 |
| Bus service is stable and not regularly changing | 29.8 | 53.6 | 83.4 | 6.4 | 5.5 | 2.1 | 2.6 | 4,070 |
| Buses are clean | 22.7 | 55.4 | 78.1 | 7.1 | 6.7 | 2.0 | 1.1 | 4,070 |
| Buses are environmentally friendly | 18.9 | 46.6 | 65.5 | 15.1 | 6.4 | 2.2 | 10.9 | 4,070 |
| Feel safe/secure on bus during the day | 43.8 | 50.3 | 94.1 | 3.1 | 1.4 | 0.4 | 1.0 | 4,070 |
| It is simple deciding what type of ticket I need | 43.7 | 45.7 | 89.4 | 4.1 | 2.5 | 0.6 | 3.4 | 4,070 |
| Finding out about routes and times is easy | 36.4 | 49.1 | 85.5 | 5.4 | 5.2 | 1.6 | 2.2 | 4,070 |
| Easy to change from buses to other forms of transport | 28.3 | 46.8 | 75.1 | 10.5 | 3.8 | 1.0 | 9.5 | 4,070 |
| Bus fares are good value | 28.2 | 32.2 | 60.4 | 10.0 | 13.8 | 11.2 | 4.8 | 4,070 |
| Feel safe/secure on bus during the evening | 26.5 | 42.8 | 69.3 | 8.8 | 6.6 | 2.5 | 12.7 | 4,070 |
1. Question asked every other year in the survey. 2014 is the most recent data available.
| Strongly agree | Tend to agree | Total agree | Neither agree nor disagree | Tend to disagree | Strongly disagree | No opinion | Sample size (=100%) | |
|---|---|---|---|---|---|---|---|---|
| Row percentages | ||||||||
| Trains run to timetable | 43.3 | 47.9 | 91.2 | 3.7 | 3.0 | 0.6 | 1.6 | 2,640 |
| Train service is stable and not regularly changing | 43.1 | 48.1 | 91.2 | 4.3 | 2.0 | 0.2 | 2.4 | 2,640 |
| Trains are clean | 40.1 | 50.6 | 90.7 | 5.1 | 2.9 | 0.3 | 1.0 | 2,640 |
| Feel safe/secure on trains during the day | 54.2 | 42.4 | 96.6 | 1.8 | 0.3 | 0.2 | 1.0 | 2,640 |
| It is simple decide what type of ticket I need | 43.4 | 43.6 | 87.0 | 5.0 | 5.3 | 1.1 | 1.5 | 2,640 |
| Finding out about routes and times is easy | 45.3 | 45.8 | 91.1 | 4.4 | 2.1 | 0.7 | 1.7 | 2,640 |
| Easy to change from trains to other forms of transport | 35.9 | 44.4 | 80.3 | 8.8 | 2.9 | 0.7 | 7.3 | 2,640 |
| Train fares are good value | 19.5 | 37.2 | 56.7 | 11.0 | 20.7 | 9.9 | 1.6 | 2,640 |
| Feel safe/secure on trains during the evening | 37.5 | 43.1 | 80.6 | 6.5 | 4.9 | 1.5 | 6.6 | 2,640 |
1. Question asked every other year in the survey. 2014 is the most recent data available.
| How often uses free travel pass | |||||||||
|---|---|---|---|---|---|---|---|---|---|
| Every day | Almost every day | 2 or 3 times a week | Once a week | Once a fortnight | Once a month | Not used | No pass | Sample size (=100%) | |
| Row percentages | |||||||||
| All adults aged 16+ | 1.3 | 2.8 | 5.9 | 3.0 | 2.2 | 2.8 | 9.6 | 72.4 | 9,410 |
| 16 - 39 | 0.2 | 0.6 | 0.5 | 0.3 | 0.0 | 0.1 | 0.3 | 98.0 | 2,640 |
| 40 - 49 | 0.4 | 0.6 | 1.0 | 0.4 | 0.3 | 0.1 | 0.6 | 96.6 | 1,470 |
| 50 - 59 | 0.2 | 0.6 | 2.0 | 0.5 | 0.5 | 0.4 | 1.6 | 94.3 | 1,680 |
| 60 - 64 | 5.0 | 5.8 | 14.8 | 6.8 | 8.5 | 9.9 | 23.1 | 26.2 | 790 |
| 65 - 69 | 3.2 | 6.6 | 17.4 | 12.1 | 8.9 | 10.7 | 31.5 | 9.6 | 900 |
| 70 - 74 | 3.2 | 10.8 | 19.9 | 10.6 | 6.4 | 8.3 | 33.6 | 7.2 | 680 |
| 75 - 79 | 5.2 | 11.1 | 20.9 | 8.7 | 4.7 | 8.6 | 33.1 | 7.9 | 530 |
| 80 + | 3.3 | 8.5 | 17.8 | 8.3 | 6.0 | 7.3 | 38.8 | 10.2 | 700 |
| How often uses free travel pass | |||||||||||
|---|---|---|---|---|---|---|---|---|---|---|---|
| Every day | Almost every day | 2 or 3 times a week | Once a week | Once a fortnight | Once a month | Not used | No pass | Sample size (=100%) | |||
| Row percentages | |||||||||||
| All | 4.0 | 8.1 | 17.8 | 9.4 | 7.2 | 9.2 | 31.3 | 13.1 | 3,610 | ||
| by gender: | |||||||||||
| Male | 3.2 | 6.8 | 14.9 | 8.8 | 6.6 | 9.1 | 32.9 | 17.7 | 1,590 | ||
| Female | 4.6 | 9.3 | 20.3 | 9.9 | 7.7 | 9.2 | 29.9 | 9.1 | 2,030 | ||
| by current situation: | |||||||||||
| employed | 4.9 | 5.3 | 12.0 | 5.9 | 5.0 | 8.3 | 29.0 | 29.6 | 530 | ||
| Permanently retired | 3.7 | 8.8 | 19.2 | 10.1 | 7.8 | 9.3 | 31.8 | 9.3 | 2,940 | ||
| by annual net household income: | |||||||||||
| up to £10,000 p.a. | 7.3 | 9.1 | 18.1 | 8.9 | 8.8 | 8.9 | 29.0 | 9.9 | 610 | ||
| £10,000 - £15,000 | 4.3 | 11.8 | 20.8 | 9.6 | 6.1 | 6.4 | 31.1 | 9.9 | 950 | ||
| £15,000 - £20,000 | 3.6 | 9.7 | 18.2 | 10.5 | 7.2 | 8.8 | 31.0 | 11.0 | 660 | ||
| over £20,000 p.a. | 2.5 | 5.1 | 15.8 | 9.4 | 7.0 | 11.5 | 32.5 | 16.2 | 1,240 | ||
| by Scottish Index of Multiple Deprivation quintiles: | |||||||||||
| 1 - Most Deprived | 8.9 | 12.3 | 22.0 | 8.6 | 5.8 | 6.5 | 26.7 | 9.2 | 540 | ||
| 2 | 4.3 | 11.4 | 19.1 | 7.9 | 6.9 | 6.5 | 31.7 | 12.3 | 740 | ||
| 3 | 3.5 | 5.7 | 16.1 | 8.3 | 7.1 | 8.6 | 35.6 | 15.2 | 800 | ||
| 4 | 2.0 | 4.7 | 13.9 | 9.3 | 8.1 | 11.9 | 34.5 | 15.6 | 820 | ||
| 5 - Least Deprived | 2.5 | 7.8 | 18.8 | 12.5 | 7.7 | 11.4 | 27.3 | 12.1 | 710 | ||
| by urban/rural classification: | |||||||||||
| Large urban areas | 7.0 | 15.8 | 26.2 | 10.6 | 7.1 | 5.5 | 17.2 | 10.6 | 910 | ||
| Other urban | 4.2 | 7.3 | 16.7 | 9.4 | 7.0 | 9.7 | 34.5 | 11.2 | 1,240 | ||
| Small accessible towns | 1.8 | 3.0 | 13.3 | 13.4 | 9.9 | 11.7 | 34.4 | 12.4 | 350 | ||
| Small remote towns | 1.0 | 0.7 | 9.2 | 4.8 | 7.0 | 10.6 | 53.5 | 13.2 | 260 | ||
| Accessible rural | 0.9 | 2.2 | 12.6 | 6.8 | 8.8 | 12.2 | 35.5 | 21.0 | 410 | ||
| Remote rural | 0.4 | 1.8 | 8.4 | 6.2 | 2.9 | 12.2 | 48.5 | 19.6 | 450 | ||
| by frequency of driving†: | |||||||||||
| Every day | 0.7 | 2.5 | 10.2 | 9.5 | 9.6 | 12.1 | 36.4 | 19.0 | 1,030 | ||
| At least once a week | 0.7 | 4.1 | 18.7 | 10.2 | 8.2 | 11.4 | 34.5 | 12.3 | 990 | ||
| Less often | 6.4 | 15.0 | 22.7 | 9.5 | 3.9 | 9.1 | 24.5 | 8.8 | 320 | ||
| by whether they hold a full driving licence | |||||||||||
| Holds a full driving licence | 1.3 | 4.7 | 15.4 | 9.8 | 8.4 | 11.4 | 34.0 | 15.0 | 2,320 | ||
| Does NOT hold a full driving licence | 9.0 | 14.8 | 22.3 | 8.6 | 5.0 | 4.9 | 26.0 | 9.3 | 1,300 | ||
| by whether has a long term physical / mental health condition / illness | |||||||||||
| No | 4.1 | 8.8 | 18.3 | 9.1 | 7.9 | 10.3 | 28.1 | 13.5 | 1,810 | ||
| Yes | 3.8 | 7.4 | 17.1 | 9.7 | 6.5 | 8.0 | 34.9 | 12.5 | 1,790 | ||
| If yes, does it impact on ability to carry out day to day activities | |||||||||||
| A lot | 3.2 | 4.6 | 13.3 | 8.3 | 5.3 | 6.8 | 42.9 | 15.6 | 780 | ||
| A little | 3.6 | 10.1 | 18.7 | 9.6 | 7.7 | 8.5 | 31.1 | 10.6 | 680 | ||
| None | 5.6 | 8.3 | 22.0 | 12.8 | 7.0 | 9.5 | 25.1 | 9.7 | 360 | ||
†Only includes those with a full driving licence
| Post office | Doctors surgery | Small food shopping | Cash machine | Banking | Chemist | Hospital outpatients | Petrol station | Public transport | Dentist | Sample size (=100%) | |
|---|---|---|---|---|---|---|---|---|---|---|---|
| All | 85 | 85 | 94 | 89 | 76 | 89 | 62 | 74 | 84 | 76 | 9,800 |
| by gender: | |||||||||||
| Male | 86 | 85 | 94 | 89 | 76 | 89 | 63 | 75 | 83 | 76 | 4,440 |
| Female | 84 | 85 | 93 | 89 | 75 | 88 | 61 | 72 | 84 | 77 | 5,360 |
| by age: | |||||||||||
| 16 - 39 | 87 | 84 | 96 | 92 | 76 | 90 | 61 | 72 | 86 | 75 | 2,820 |
| 40 - 49 | 87 | 86 | 95 | 91 | 75 | 90 | 66 | 80 | 86 | 79 | 1,600 |
| 50 - 59 | 86 | 86 | 94 | 90 | 77 | 90 | 64 | 80 | 81 | 81 | 1,680 |
| 60 + | 81 | 85 | 91 | 84 | 74 | 86 | 59 | 68 | 81 | 74 | 3,690 |
| by urban/rural classification: | |||||||||||
| Large urban areas | 84 | 84 | 95 | 91 | 76 | 90 | 64 | 70 | 91 | 78 | 2,950 |
| Other urban | 86 | 88 | 96 | 92 | 81 | 92 | 65 | 80 | 86 | 83 | 3,240 |
| Small accessible towns | 91 | 87 | 94 | 93 | 77 | 93 | 54 | 75 | 84 | 78 | 940 |
| Small remote towns | 93 | 92 | 97 | 96 | 90 | 97 | 78 | 89 | 85 | 84 | 600 |
| Accessible rural | 82 | 79 | 88 | 78 | 61 | 79 | 54 | 65 | 67 | 61 | 1,070 |
| Remote rural | 83 | 79 | 86 | 73 | 60 | 67 | 44 | 70 | 57 | 53 | 1,020 |
| by annual net household income: | |||||||||||
| up to £10,000 p.a. | 86 | 83 | 93 | 87 | 76 | 88 | 57 | 59 | 84 | 73 | 1,310 |
| £10,000 - £15,000 | 85 | 84 | 93 | 87 | 75 | 88 | 58 | 63 | 85 | 73 | 1,780 |
| £15,000 - £20,000 | 86 | 85 | 94 | 88 | 77 | 89 | 64 | 69 | 85 | 77 | 1,550 |
| over £20,000 p.a. | 86 | 86 | 94 | 90 | 75 | 89 | 63 | 81 | 83 | 78 | 4,880 |
| by licence possession: | |||||||||||
| Holds a full driving licence | 86 | 86 | 94 | 90 | 76 | 90 | 64 | 85 | 82 | 78 | 6,550 |
| Does NOT hold a full driving licence | 84 | 82 | 94 | 87 | 74 | 87 | 56 | 51 | 87 | 74 | 3,250 |
| by number of cars available: | |||||||||||
| none | 83 | 83 | 94 | 87 | 74 | 88 | 55 | 41 | 88 | 71 | 2,950 |
| one + | 86 | 86 | 94 | 90 | 76 | 89 | 64 | 85 | 82 | 78 | 6,850 |
1. Questions asked every other year in the survey. 2014 is the most recent data available.
Table 34: How adults normally travel to a doctors surgery
Following changes to the Scottish Household survey data for Table 34 is no longer collected - Please see TATIS 2011 for the most recently produced version of the table.
Table 35: How adults normally travel to a hospital outpatients department
Following changes to the Scottish Household survey data for Table 35 is no longer collected - Please see TATIS 2011 for the most recently produced version of the table.
Table 36: How adults normally travel to a dentist
Following changes to the Scottish Household survey data for Table 36 is no longer collected - Please see TATIS 2011 for the most recently produced version of the table.
| 2009 | 2010 | 2011 | 2012 | 2013 | 2014 | 2015 | |
|---|---|---|---|---|---|---|---|
| column percentages | |||||||
| Yes | 46.8 | 44.3 | 43.4 | 45.9 | 46.7 | 46.16 | … |
| No | 52.9 | 55.5 | 56.5 | 54.1 | 53.3 | 53.78 | … |
| Sample size (=100%) | 12,540 | 12,440 | 12,890 | 9,890 | 9,920 | 9,800 | … |
1. Percentages may not add up to exactly 100% as very small numbers of people responded 'don't know' or refused to answer.
| 2009 | 2010 | 2011 | 2012 | 2013 | 2014 | 2015 | |||
|---|---|---|---|---|---|---|---|---|---|
| All leisure flights | column percentages | ||||||||
| 1 or 2 | 49.8 | 50.9 | 50.6 | 49.4 | 50.2 | 49.6 | … | ||
| 3 or 4 | 25.1 | 23.8 | 24.3 | 24.9 | 23.6 | 24.2 | … | ||
| 5 or 6 | 11.4 | 10.8 | 10.4 | 11.5 | 12.2 | 11.0 | … | ||
| 7 or 8 | 6.1 | 5.6 | 5.6 | 6.2 | 5.9 | 5.9 | … | ||
| 9 to 12 | 4.4 | 5.0 | 5.1 | 5.1 | 5.1 | 5.3 | … | ||
| 13 to 20 | 2.3 | 2.8 | 3.1 | 2.0 | 2.2 | 2.9 | … | ||
| More than 20 | 0.9 | 1.2 | 0.9 | 0.9 | 0.9 | 1.1 | … | ||
| Lower decile | 2.0 | 2.0 | 2.0 | 2.0 | 2.0 | 2.0 | … | ||
| Lower quartile | 2.0 | 2.0 | 2.0 | 2.0 | 2.0 | 2.0 | … | ||
| Median | 3.0 | 2.0 | 2.0 | 3.0 | 2.0 | 3.0 | … | ||
| Upper quartile | 5.0 | 5.0 | 5.0 | 6.0 | 6.0 | 6.0 | … | ||
| Upper decile | 8.0 | 8.0 | 8.0 | 8.0 | 8.0 | 8.0 | … | ||
| Mean* | 4.2 | 20.8 | 4.3 | 4.2 | 4.3 | 4.4 | … | ||
| Of which: | |||||||||
| Flights within Scotland | |||||||||
| 0 | 92.9 | 93.8 | 95.9 | 94.2 | 94.3 | 95.2 | … | ||
| 1 or 2 | 4.9 | 4.6 | 2.8 | 4.1 | 4.0 | 3.3 | … | ||
| 3 or 4 | 1.2 | 0.9 | 0.7 | 1.0 | 0.8 | 0.8 | … | ||
| 5 or 6 | 0.5 | 0.3 | 0.3 | 0.3 | 0.5 | 0.3 | … | ||
| 7 or 8 | 0.2 | 0.1 | 0.1 | 0.1 | 0.2 | 0.2 | … | ||
| 9 to 12 | 0.2 | 0.3 | 0.1 | 0.2 | 0.2 | 0.1 | … | ||
| 13 to 20 | 0.1 | ** | ** | 0.1 | 0.1 | 0.1 | … | ||
| More than 20 | 0.1 | ** | ** | 0.0 | ** | 0.1 | … | ||
| Flights to rest of UK | |||||||||
| 0 | 67.2 | 67.0 | 68.9 | 69.8 | 70.5 | 71.7 | … | ||
| 1 or 2 | 22.4 | 22.0 | 20.3 | 19.8 | 18.8 | 17.8 | … | ||
| 3 or 4 | 5.8 | 5.7 | 5.3 | 6.0 | 5.5 | 5.6 | … | ||
| 5 or 6 | 2.3 | 2.2 | 2.2 | 2.0 | 2.3 | 2.6 | … | ||
| 7 or 8 | 0.8 | 1.5 | 1.3 | 1.3 | 1.3 | 1.0 | … | ||
| 9 to 12 | 0.8 | 0.9 | 1.3 | 0.8 | 1.0 | 0.8 | … | ||
| 13 to 20 | 0.4 | 0.4 | 0.5 | 0.2 | 0.2 | 0.4 | … | ||
| More than 20 | 0.2 | 0.3 | 0.2 | 0.1 | 0.3 | 0.2 | … | ||
| Flights to other European Countries | |||||||||
| 0 | 27.1 | 30.5 | 28.1 | 26.2 | 25.9 | 24.0 | … | ||
| 1 or 2 | 49.7 | 47.8 | 48.6 | 48.7 | 48.7 | 49.5 | … | ||
| 3 or 4 | 15.3 | 13.5 | 15.1 | 17.0 | 16.2 | 15.7 | … | ||
| 5 or 6 | 4.7 | 4.3 | 4.5 | 4.6 | 5.8 | 6.2 | … | ||
| 7 or 8 | 2.0 | 2.1 | 1.9 | 2.2 | 1.9 | 2.3 | … | ||
| 9 to 12 | 0.9 | 1.2 | 1.1 | 1.2 | 1.2 | 1.7 | … | ||
| 13 to 20 | 0.3 | 0.5 | 0.5 | 0.2 | 0.2 | 0.6 | … | ||
| More than 20 | ** | 0.2 | 0.1 | ** | 0.2 | 0.1 | … | ||
| Flights to countries outside Europe | |||||||||
| 0 | 68.3 | 63.5 | 66.1 | 67.3 | 70.2 | 69.3 | … | ||
| 1 or 2 | 25.2 | 29.0 | 26.6 | 26.6 | 23.7 | 24.2 | … | ||
| 3 or 4 | 4.3 | 4.9 | 5.0 | 4.0 | 4.1 | 4.1 | … | ||
| 5 or 6 | 1.3 | 1.5 | 1.5 | 1.1 | 1.2 | 1.3 | … | ||
| 7 or 8 | 0.4 | 0.7 | 0.3 | 0.4 | 0.4 | 0.6 | … | ||
| 9 to 12 | 0.3 | 0.4 | 0.5 | 0.3 | 0.2 | 0.4 | … | ||
| 13 to 20 | 0.1 | 0.1 | ** | 0.2 | ** | 0.1 | … | ||
| More than 20 | ** | ** | . | ** | ** | . | … | ||
| Sample size (=100%) | 5,310 | 4,180 | 5,100 | 4,250 | 4,380 | 4,280 | … | ||
1. Sample size is those who answered yes to previous question asking whether respondent had flown for leisure, holildays and visiting friends or family in the last 12 months.
* Note mean value can be dragged up by a handful of respondents reporting making a large number of flights eg in 2010. The median is a better measure of the average.
** value supressed as cell contains fewer than 5 responses
| 2009 | 2010 | 2011 | 2012 | 2013 | 2014 | 2015 | |
|---|---|---|---|---|---|---|---|
| column percentages | |||||||
| Yes | 8.7 | 6.9 | 7.9 | 7.8 | 8.0 | 7.9 | … |
| No | 90.9 | 92.9 | 92.1 | 92.1 | 91.9 | 92.05 | … |
| Sample size (=100%) | 12,540 | 12,440 | 12,890 | 9,890 | 9,920 | 9,800 | … |
1. Percentages may not add up to exactly 100% as very small numbers of people responded 'don't know' or refused to answer.
| 2009 | 2010 | 2011 | 2012 | 2013 | 2014 | 2015 | |
|---|---|---|---|---|---|---|---|
| All business flights | column percentages | ||||||
| 1 or 2 | 33.8 | 31.0 | 28.7 | 31.5 | 27.8 | 31.4 | … |
| 3 or 4 | 15.9 | 15.6 | 18.1 | 14.1 | 17.2 | 15.2 | … |
| 5 or 6 | 9.4 | 9.7 | 8.7 | 10.2 | 9.1 | 10.1 | … |
| 7 or 8 | 6.9 | 5.3 | 6.7 | 5.8 | 8.0 | 5.9 | … |
| 9 to 12 | 10.3 | 9.3 | 8.7 | 8.6 | 8.9 | 10.0 | … |
| 13 to 20 | 7.3 | 9.6 | 9.4 | 9.5 | 8.4 | 8.5 | … |
| More than 20 | 16.3 | 19.6 | 19.7 | 20.4 | 20.6 | 18.9 | … |
| Lower decile | 2 | 2 | 2 | 2 | 2 | 2 | … |
| Lower quartile | 2 | 2 | 2 | 2 | 2 | 2 | … |
| Median | 5 | 6 | 6 | 6 | 6 | 6 | … |
| Upper quartile | 12 | 16 | 16 | 18 | 16 | 14 | … |
| Upper decile | 30 | 40 | 40 | 40 | 40 | 34 | … |
| Mean* | 14.4 | 23.3 | 16.5 | 16.0 | 14.3 | 14.1 | … |
| Of which: | |||||||
| Flights within Scotland | |||||||
| 0 | 83.3 | 85.7 | 83.8 | 86.2 | 85.4 | 86.5 | … |
| 1 or 2 | 7.7 | 5.2 | 5.8 | 3.9 | 5.4 | 4.9 | … |
| 3 or 4 | 2.3 | 1.1 | 2.5 | 1.8 | 2.7 | 1.6 | … |
| 5 or 6 | 2.0 | 1.5 | 1.3 | 1.3 | 0.7 | 0.8 | … |
| 7 or 8 | 0.8 | 1.3 | 1.7 | 0.6 | 1.4 | 0.9 | … |
| 9 to 12 | 2.0 | 2.4 | 0.9 | 1.7 | 1.0 | 0.6 | … |
| 13 to 20 | 0.9 | 0.6 | 1.3 | 1.6 | 0.8 | 0.9 | … |
| More than 20 | 1.0 | 2.1 | 2.5 | 3.0 | 2.6 | 3.9 | … |
| Flights to rest of UK | |||||||
| 0 | 24.2 | 26.1 | 25.9 | 26.6 | 27.8 | 28.1 | … |
| 1 or 2 | 30.8 | 28.7 | 25.1 | 25.2 | 25.7 | 25.1 | … |
| 3 or 4 | 11.2 | 10.5 | 13.9 | 11.8 | 11.4 | 11.6 | … |
| 5 or 6 | 8.9 | 8.0 | 7.7 | 7.7 | 6.6 | 8.3 | … |
| 7 or 8 | 4.7 | 3.6 | 3.8 | 4.6 | 5.3 | 4.1 | … |
| 9 to 12 | 6.7 | 7.1 | 9.3 | 8.9 | 6.7 | 7.6 | … |
| 13 to 20 | 5.0 | 5.3 | 4.7 | 5.0 | 4.7 | 5.4 | … |
| More than 20 | 8.5 | 10.7 | 9.5 | 10.1 | 11.8 | 9.7 | … |
| Flights to other European Countries | |||||||
| 0 | 65.9 | 64.2 | 65.0 | 67.8 | 64.5 | 67.0 | … |
| 1 or 2 | 16.5 | 17.8 | 14.5 | 11.9 | 16.4 | 13.2 | … |
| 3 or 4 | 5.4 | 6.1 | 6.2 | 6.4 | 7.8 | 6.7 | … |
| 5 or 6 | 3.6 | 2.5 | 3.3 | 2.6 | 1.9 | 4.2 | … |
| 7 or 8 | 1.4 | 1.2 | 2.0 | 2.2 | 2.6 | 3.0 | … |
| 9 to 12 | 3.8 | 4.3 | 3.0 | 3.9 | 2.2 | 2.7 | … |
| 13 to 20 | 1.9 | 1.6 | 2.3 | 1.7 | 2.0 | 1.2 | … |
| More than 20 | 1.5 | 2.4 | 3.7 | 3.4 | 2.6 | 2.0 | … |
| Flights to countries outside Europe | |||||||
| 0 | 78.2 | 77.3 | 79.2 | 75.6 | 80.9 | 77.4 | … |
| 1 or 2 | 10.7 | 9.9 | 10.1 | 12.3 | 8.7 | 11.0 | … |
| 3 or 4 | 3.6 | 3.2 | 3.3 | 3.9 | 2.8 | 4.4 | … |
| 5 or 6 | 1.6 | 2.1 | 1.9 | 2.1 | 1.0 | 1.3 | … |
| 7 or 8 | 0.5 | 0.5 | 1.8 | 1.6 | 1.5 | 0.7 | … |
| 9 to 12 | 2.9 | 2.3 | 2.1 | 1.6 | 2.2 | 2.5 | … |
| 13 to 20 | 1.4 | 2.5 | 0.9 | 1.1 | 1.4 | 1.7 | … |
| More than 20 | 1.0 | 2.3 | 0.8 | 1.8 | 1.5 | 1.2 | … |
| Sample size (=100%) | 980 | 690 | 930 | 740 | 740 | 710 | … |
1. Sample size is those who answered yes to previous question asking whether respondent had flown for work or business purposes in the last 12 months.
* Note mean value can be dragged up by a handful of respondents reporting making a large number of flights eg in 2010. The median is a better measure of the average.
| 2009 | 2010 | 2011 | 2012 | 2013 | 2014 | 2015 | |
|---|---|---|---|---|---|---|---|
| Quicker | 80.4 | 82.8 | 83.1 | 83.2 | 82.5 | 84.6 | .. |
| Cheaper | 27.7 | 28.1 | 25.2 | 27.8 | 23.4 | 22.3 | .. |
| Easy/convenient | 3.6 | 1.5 | 1.3 | 1.6 | 2.2 | 0.7 | .. |
| Employer/someone else organised | 2.6 | 1.2 | 1.1 | 1.2 | 1.7 | 1.2 | .. |
| Connecting flight/part of holiday | 1.9 | 1.8 | 2.4 | 2.0 | 2.5 | 2.2 | .. |
| No alternative | 1.6 | 1.1 | 1.6 | 0.8 | 1.3 | 0.6 | .. |
| Sample size (=100%) | 1,590 | 1,510 | 1,150 | 2,010 | 2,050 | 1,920 | .. |
1. Percentages will sum to more than 100% as multiple answers can be given.
| 2012 | 2013 | 2014 | 2015 | |
|---|---|---|---|---|
| Every day, or almost every day | 0.1 | 0.1 | 0.1 | .. |
| 2 or 3 times per week | 0.2 | 0.1 | 0.2 | .. |
| About once a week | 0.4 | 0.3 | 0.4 | .. |
| About once a fortnight, or about once a month | 3.9 | 3.9 | 3.4 | .. |
| Not used in past month | 95.4 | 95.5 | 95.9 | .. |
| Sample size (=100%) | 9,890 | 9,920 | 9,800 | .. |
| 2012 | 2013 | 2014 | 2015 | |
|---|---|---|---|---|
| Travel: | ||||
| To place of work | 2.7 | 4.0 | 2.9 | .. |
| In the course of work | 12.3 | 9.1 | 15.2 | .. |
| For Education | 1.4 | 2.2 | 0.3 | .. |
| For Shopping | 8.3 | 10.4 | 9.6 | .. |
| To hospital, doctor or other health service | 4.2 | 5.7 | 5.7 | .. |
| To visit friends or relatives | 32.1 | 27.1 | 25.2 | .. |
| for Holiday / day trip | 43.3 | 52.2 | 46.0 | .. |
| for other recreational activity | 9.4 | 8.9 | 11.3 | .. |
| Sample size (=100%) | 730 | 700 | 620 | .. |
| 2012 | 2013 | 2014 | 2015 | |
|---|---|---|---|---|
| No feasible alternative | 65.3 | 65.0 | 67.6 | .. |
| Cheaper | 8.6 | 8.7 | 6.0 | .. |
| Quicker | 8.6 | 8.7 | 11.0 | .. |
| Convenient | 7.9 | 5.9 | 4.5 | .. |
| Can take my vehicle | 10.2 | 11.0 | 8.8 | .. |
| Car parked at other end | ** | ** | 0.4 | .. |
| Live close to terminal/ port | 0.5 | 0.6 | 0.5 | .. |
| Service more frequent | ** | ** | 0.2 | .. |
| Arrival/ departure time convenient | ** | ** | 0.5 | .. |
| Safety/ fear of flying | ** | ** | 0.1 | .. |
| Travelling with others/ animals | 2.3 | 1.7 | 0.9 | .. |
| Accessibility better | 1.1 | 1.9 | 0.2 | .. |
| More comfortable | 0.4 | 1.5 | 0.3 | .. |
| Other | 7.0 | 5.0 | 5.8 | .. |
| Sample size (=100%) | 730 | 700 | 620 | .. |
** value supressed as cell contains fewer than 5 responses
| 2012 | 2013 | 2014 | 2015 | |
|---|---|---|---|---|
| Nothing discourages | 14.4 | 14.2 | 16.3 | .. |
| Takes too long | 16.5 | 13.2 | 15.6 | .. |
| Inconvenient | 10.8 | 9.1 | 7.5 | .. |
| No direct route | 12.4 | 10.6 | 10.1 | .. |
| Use my own car | 23.8 | 20.6 | 18.9 | .. |
| Need a car for,at work | 6.2 | 6.7 | 4.6 | .. |
| Cost | 9.4 | 9.2 | 8.2 | .. |
| Work unsocial,unusual hours | 2.1 | 2.4 | 1.6 | .. |
| Public transport unreliable | 2.9 | 3.6 | 2.6 | .. |
| Lack of service | 11.3 | 11.6 | 10.1 | .. |
| Too infrequent | 5.2 | 4.4 | 4.5 | .. |
| Health reasons | 9.4 | 8.7 | 8.1 | .. |
| Difficult access,on-off steps | 1.3 | 1.6 | 1.1 | .. |
| Too much to carry,awkward | 3.2 | 2.8 | 2.1 | .. |
| Uncomfortable | 1.7 | 1.6 | 1.4 | .. |
| No need | 16.0 | 19.0 | 20.2 | .. |
| Prefer to walk/cycle | 4.1 | 5.0 | 3.9 | .. |
| Dislike waiting about | 2.6 | 2.4 | 1.7 | .. |
| Long walk to bus stop | 3.3 | 2.7 | 2.3 | .. |
| Lives centrally,within walking distance | 2.5 | 2.6 | 2.7 | .. |
| Other choices - trains, taxi etc. | 0.8 | 1.0 | 1.1 | .. |
| Smoking policy | ** | . | . | .. |
| Dirty/filthy | 0.3 | 0.3 | 0.2 | .. |
| Given lifts | 0.3 | 0.3 | 0.1 | .. |
| Too crowded | 0.2 | 0.1 | 0.1 | .. |
| Don't feel safe | 0.2 | 0.3 | 0.2 | .. |
| Laziness | 0.1 | 0.1 | 0.0 | .. |
| No suitable bus service | . | 0.2 | 0.1 | .. |
| Don't know bus times/routes/fares | 0.4 | 0.3 | 0.3 | .. |
| Too dificult with small children/pushchairs | 0.1 | 0.2 | 0.1 | .. |
| Bus drivers rude/unhelpful/poor drivers | 0.2 | 0.1 | 0.2 | .. |
| Other passengers | 0.4 | 0.5 | 0.5 | .. |
| Sample size (=100%) | 7,900 | 7,700 | 7,759 | .. |
Question not asked in 2015
| 2012 | 2013 | 2014 | 2015 | |
|---|---|---|---|---|
| Nothing | 57.0 | 55.8 | 56.3 | .. |
| No nearby station | 3.7 | 4.6 | 5.8 | .. |
| Takes too long | 1.3 | 1.3 | 0.8 | .. |
| Inconvenient | 2.9 | 2.5 | 1.1 | .. |
| No direct route | 2.2 | 2.2 | 1.7 | .. |
| Use my own car | 5.5 | 2.5 | 1.9 | .. |
| Need a car for/at work | 0.5 | 0.8 | 0.7 | .. |
| Cost | 16.9 | 17.5 | 12.0 | .. |
| Work unsocial/unusual hours | 0.2 | 0.2 | 0.2 | .. |
| Lack of service | 1.8 | 1.4 | 1.2 | .. |
| Too infrequent | 0.8 | 0.4 | 0.8 | .. |
| Health reasons | 0.4 | 1.0 | 0.3 | .. |
| Difficult to access | 0.1 | 0.6 | 0.3 | .. |
| Too much to carry/awkward | 0.5 | 0.3 | 0.1 | .. |
| Uncomfortable | 0.4 | 0.4 | 0.1 | .. |
| No need | 8.1 | 10.1 | 16.9 | .. |
| Prefer to walk | 0.2 | 0.3 | 0.2 | .. |
| Dislike waiting | 0.1 | 0.3 | 0.1 | .. |
| Live centrally/within walking distance | 0.4 | 0.4 | 0.2 | .. |
| Use other things - bus/underground/taxi | 0.5 | 0.1 | 1.0 | .. |
| Smoking policy | 0.1 | . | . | .. |
| Dirty/filthy | 0.2 | 0.1 | 0.2 | .. |
| Given lifts | 0.0 | 0.1 | . | .. |
| Too crowded | 0.8 | 0.7 | 0.5 | .. |
| Not safe | 0.4 | 0.6 | 0.3 | .. |
| Laziness | 0.1 | 0.0 | 0.1 | .. |
| Other | 2.9 | 2.4 | 1.6 | .. |
| Sample size (=100%) | 2,060 | 2,110 | 2,300 | .. |
1. This question is now also asked of people who did not use a train at all in the previous month; results for these respondents are provided in Table 42a. This table continues the series on the same basis as previous years, excluding respondents who had not taken the train in the previous month.
Question not asked in 2015 - moved to biennial
| 2014 | 2015 | |
|---|---|---|
| Nothing | 39.0 | .. |
| No nearby station | 16.1 | . |
| Takes too long | 0.7 | .. |
| Inconvenient | 1.7 | .. |
| No direct route | 3.0 | .. |
| Use my own car | 3.7 | .. |
| Need a car for/at work | 0.7 | .. |
| Cost | 9.8 | .. |
| Work unsocial/unusual hours | 0.1 | .. |
| Lack of service | 1.9 | .. |
| Too infrequent | 0.4 | .. |
| Health reasons | 5.2 | .. |
| Difficult to access | 0.4 | .. |
| Too much to carry/awkward | 0.1 | .. |
| Uncomfortable | 0.3 | .. |
| No need | 22.6 | .. |
| Prefer to walk | 0.1 | .. |
| Dislike waiting | 0.0 | .. |
| Live centrally/within walking distance | 0.2 | .. |
| Use other things - bus/underground/taxi | 0.9 | .. |
| Smoking policy | . | .. |
| Dirty/filthy | 0.1 | .. |
| Given lifts | 0.1 | .. |
| Too crowded | 0.3 | .. |
| Not safe | 0.2 | .. |
| Laziness | 0.0 | .. |
| Other | 1.6 | .. |
| Sample size (=100%) | 7,160 | .. |
Question not asked in 2015 - moved to biennial
| 2012 | 2013 | 2014 | 2015 | |
|---|---|---|---|---|
| Nothing | 51.0 | 60.1 | 57.3 | .. |
| Takes too long | 3.9 | 4.1 | 4.5 | .. |
| Health reasons / unable to walk far | 15.9 | 15.9 | 15.3 | .. |
| Weather | 20.3 | 11.1 | 14.7 | .. |
| Not safe | 0.9 | 1.1 | 0.7 | .. |
| Lack of walking paths | 0.7 | 1.0 | 0.4 | .. |
| Poor quality paths | 0.4 | 0.8 | 0.5 | .. |
| Inconvenient | 0.4 | 0.6 | 0.3 | .. |
| Too much to carry/awkward | 0.5 | 0.5 | 0.3 | .. |
| Travelling with others | 0.1 | 0.1 | 0.1 | .. |
| No need | 2.6 | 1.5 | 1.8 | .. |
| Live too far away | 0.4 | 1.0 | 0.4 | .. |
| Prefer to use other modes - car/bus/train | 0.7 | 0.5 | 0.5 | .. |
| Given lifts | 0.1 | 0.1 | 0.1 | .. |
| Laziness | 4.4 | 4.8 | 4.4 | .. |
| Other | 3.8 | 2.7 | 3.2 | .. |
| Sample size (=100%) | 9,890 | 9,920 | 9,800 | .. |
Question not asked in 2015
| 2012 | 2013 | 2014 | 2015 | |
|---|---|---|---|---|
| Travel: | ||||
| To place of work | 14.0 | 11.1 | 10.7 | 11.9 |
| In the course of work | 10.3 | 12.3 | 12.2 | 9.5 |
| For Education | 5.5 | 4.6 | 4.3 | 3.5 |
| For Shopping | 32.7 | 34.2 | 32.8 | 39.0 |
| To hospital, doctor or other health service | 2.7 | 2.7 | 1.7 | 2.0 |
| To visit friends or relatives | 26.2 | 25.4 | 25.3 | 26.2 |
| for Holiday / day trip | 12.5 | 13.4 | 13.5 | 15.6 |
| for other recreational activity | 18.4 | 20.5 | 20.2 | 20.6 |
| Sample size (=100%) | 2,440 | 2,480 | 2,639 | 2,500 |
1. This question is asked of anyone who has used the train in the last month. There is no similar question for bus users.not asked of bus users.
| 2012 | 2013 | 2014 | 2015 | |
|---|---|---|---|---|
| None | 84.0 | … | 86.1 | … |
| Not enough time to change modes | 3.7 | … | 2.9 | … |
| Long wait between journeys | 6.9 | … | 6.0 | … |
| Lack of information about connecting modes | 2.9 | … | 2.5 | … |
| Lack of signposting to connecting modes | 1.2 | … | 1.0 | … |
| Unable to use one ticket/ travel pass for all journeys/ modes | 1.1 | … | 1.0 | … |
| Stops/stations not close enough to each other | 2.3 | … | 1.6 | … |
| Accessibility between stops/stations | 1.7 | … | 0.7 | … |
| Other | 3.1 | … | 2.8 | … |
| Sample Size (=100%) | 2,070 | .. | 1,850 | .. |
1. This question is asked of those who use public transport at least once a month. The question is asked in the survey every other year.
| Aware of - car clubs or formal car sharing schemes? | Aware of - fuel efficient driver training courses? | Aware of - electric vehicles? | Aware of - cycle hire schemes? | Sample size (=100%) | |
|---|---|---|---|---|---|
| percent | |||||
| All people: | 37.7 | 16.1 | 60.5 | 39.3 | 9,410 |
| by gender: | |||||
| Male | 40.4 | 20.6 | 65.2 | 42.2 | 4,240 |
| Female | 35.1 | 11.8 | 56.2 | 36.7 | 5,160 |
| by age: | |||||
| 16-19 | 19.1 | 9.5 | 52.8 | 28.9 | 260 |
| 20-29 | 31.8 | 14.7 | 59.0 | 37.2 | 1,070 |
| 30-39 | 42.3 | 17.7 | 66.1 | 46.0 | 1,310 |
| 40-49 | 49.3 | 17.7 | 68.3 | 49.0 | 1,470 |
| 50-59 | 43.1 | 20.6 | 63.4 | 44.0 | 1,680 |
| 60-69 | 39.2 | 16.8 | 63.0 | 38.8 | 1,700 |
| 70-79 | 28.5 | 11.0 | 47.9 | 25.7 | 1,220 |
| 80+ | 17.5 | 8.6 | 37.5 | 16.2 | 700 |
| by current situation: | |||||
| Self employed | 55.7 | 24.0 | 74.8 | 51.1 | 560 |
| Employed full time | 46.7 | 20.1 | 69.1 | 47.4 | 3,130 |
| Employed part time | 38.5 | 14.3 | 63.2 | 39.8 | 980 |
| Looking after the home/family | 27.0 | 9.7 | 46.0 | 32.2 | 450 |
| Permanently retired from work | 30.7 | 12.8 | 52.1 | 30.2 | 3,030 |
| Unemployed/seeking work | 20.8 | 8.6 | 49.8 | 27.3 | 310 |
| In further/higher education | 29.2 | 18.9 | 58.0 | 42.9 | 300 |
| Permanently sick or disabled | 19.4 | 10.3 | 46.5 | 23.8 | 460 |
| by annual net household income: | |||||
| up to £10,000 p.a. | 21.0 | 11.3 | 46.5 | 28.9 | 1,110 |
| over £10,000 - £15,000 | 23.9 | 9.7 | 49.2 | 28.5 | 1,670 |
| over £15,000 - £20,000 | 31.0 | 13.6 | 53.6 | 31.6 | 1,460 |
| over £20,000 - £25,000 | 33.9 | 14.9 | 58.5 | 34.9 | 1,110 |
| over £25,000 - £30,000 | 41.6 | 17.8 | 65.3 | 42.4 | 870 |
| over £30,000 - £40,000 | 45.1 | 21.3 | 66.9 | 45.5 | 1,270 |
| over £40,000 p.a. | 54.7 | 20.1 | 74.3 | 53.6 | 1,620 |
| by Scottish Index of Multiple Deprivation quintiles: | |||||
| 1 (20% most deprived) | 23.9 | 12.0 | 50.8 | 29.1 | 1,740 |
| 2' | 32.4 | 14.3 | 55.5 | 34.9 | 1,900 |
| 3' | 37.8 | 16.1 | 62.2 | 39.9 | 2,050 |
| 4' | 44.2 | 19.0 | 66.4 | 44.6 | 2,080 |
| 5 (20% least deprived) | 49.3 | 18.6 | 66.9 | 47.6 | 1,640 |
| by urban/rural classification: | |||||
| Large urban areas | 39.6 | 14.8 | 58.6 | 43.0 | 2,760 |
| Other urban | 33.3 | 15.8 | 59.6 | 35.3 | 3,220 |
| Small accessible towns | 40.5 | 17.1 | 63.7 | 38.9 | 860 |
| Small remote towns | 32.8 | 13.1 | 55.9 | 29.3 | 580 |
| Accessible rural | 43.9 | 20.5 | 67.5 | 45.7 | 1,010 |
| Remote rural | 38.8 | 16.8 | 61.8 | 35.7 | 980 |
| by frequency of driving†: | |||||
| Every day | 50.0 | 22.2 | 72.2 | 48.5 | 3,690 |
| At least three times a week | 47.5 | 19.2 | 69.3 | 44.6 | 1,460 |
| Once or twice a week | 44.7 | 19.8 | 68.0 | 43.1 | 600 |
| Less often | 39.2 | 14.8 | 62.7 | 46.5 | 280 |
| Never, but holds full driving licence | 22.8 | 9.3 | 54.0 | 34.4 | 700 |
| Member of a car club or formal car sharing scheme | Sample size (=100%) | Attended a fuel efficient driver training course | Sample size (=100%) | Used a cycle hire scheme in the last 12 months | Sample size (=100%) | |
|---|---|---|---|---|---|---|
| percent | ||||||
| All people: | 2.2 | 2990 | 10.9 | 1340 | 3.2 | 3,030 |
| by gender: | ||||||
| Male | 2.7 | 1530 | 13.3 | 820 | 3.4 | 1,560 |
| Female | 1.6 | 1460 | 6.6 | 520 | 3.1 | 1,470 |
| by age: | ||||||
| 16-19 | * | 30 | * | 10 | * | 40 |
| 20-29 | 1.0 | 260 | 4.5 | 130 | 4.2 | 310 |
| 30-39 | 2.9 | 480 | 18.1 | 210 | 3.8 | 520 |
| 40-49 | 3.0 | 640 | 14.0 | 250 | 4.4 | 620 |
| 50-59 | 2.7 | 640 | 12.6 | 310 | 3.0 | 640 |
| 60-69 | 1.2 | 580 | 8.0 | 250 | 0.8 | 570 |
| 70-79 | 1.1 | 280 | 2.4 | 120 | . | 240 |
| 80+ | . | 90 | 4.7 | 50 | . | 80 |
| by current situation: | ||||||
| Self employed | 0.5 | 280 | 9.9 | 130 | 2.2 | 260 |
| Employed full time | 2.8 | 1350 | 15.1 | 630 | 4.4 | 1,380 |
| Employed part time | 3.6 | 330 | 10.1 | 130 | 3.9 | 330 |
| Looking after the home/family | 1.0 | 90 | * | 30 | 0.9 | 110 |
| Permanently retired from work | 1.4 | 760 | 5.2 | 330 | 0.7 | 720 |
| Unemployed/seeking work | * | 50 | * | 20 | 11.6 | 60 |
| In further/higher education | 0.6 | 60 | * | 30 | . | 90 |
| Permanently sick or disabled | . | 60 | * | 30 | . | 70 |
| by annual net household income: | ||||||
| up to £10,000 p.a. | 0.7 | 180 | 7.1 | 90 | 0.6 | 220 |
| over £10,000 - £15,000 | 1.2 | 320 | 8.7 | 130 | 0.8 | 330 |
| over £15,000 - £20,000 | 1.7 | 370 | 8.7 | 170 | 1.3 | 370 |
| over £20,000 - £25,000 | 1.9 | 350 | 6.4 | 160 | 3.7 | 340 |
| over £25,000 - £30,000 | 1.5 | 320 | 7.1 | 150 | 2.6 | 350 |
| over £30,000 - £40,000 | 3.0 | 540 | 13.6 | 260 | 2.7 | 540 |
| over £40,000 p.a. | 2.6 | 850 | 14.2 | 350 | 5.4 | 830 |
| by Scottish Index of Multiple Deprivation quintiles: | ||||||
| 1 (20% most deprived) | 1.8 | 320 | 10.2 | 150 | 3.8 | 370 |
| 2' | 2.0 | 490 | 10.4 | 230 | 3.1 | 510 |
| 3' | 1.9 | 620 | 7.8 | 290 | 3.3 | 640 |
| 4' | 3.0 | 810 | 14.3 | 380 | 2.4 | 790 |
| 5 (20% least deprived) | 1.9 | 750 | 10.5 | 290 | 3.7 | 720 |
| by urban/rural classification: | ||||||
| Large urban areas | 1.7 | 890 | 9.7 | 320 | 4.3 | 920 |
| Other urban | 3.2 | 910 | 10.0 | 420 | 2.1 | 930 |
| Small accessible towns | 1.2 | 310 | 10.8 | 140 | 4.1 | 300 |
| Small remote towns | 2.7 | 170 | 14.1 | 90 | 4.0 | 160 |
| Accessible rural | 1.9 | 420 | 15.5 | 200 | 1.7 | 420 |
| Remote rural | 1.9 | 300 | 8.2 | 170 | 4.5 | 290 |
| by frequency of driving†: | ||||||
| Every day | 2.5 | 1810 | 12.6 | 850 | 3.1 | 1,790 |
| At least three times a week | 1.6 | 650 | 8.0 | 260 | 3.2 | 630 |
| Once or twice a week | 1.7 | 250 | 12.1 | 110 | 3.0 | 250 |
| Less often | 2.7 | 100 | * | 40 | 4.7 | 120 |
| Never, but holds full driving licence | 0.5 | 170 | 5.8 | 70 | 3.5 | 230 |
| 0-2500 miles | 2501-5000 miles | 5001-10000 miles | 10001-15000 miles | 15001-20000 miles | 20000+ miles | Mean | Median | Sample size (=100%) | |
|---|---|---|---|---|---|---|---|---|---|
| percent | miles | ||||||||
| All people: | 15.3 | 21.6 | 37.2 | 15.8 | 5.4 | 4.6 | 8000 | 6500 | 2990 |
| by gender: | |||||||||
| Male | 10.7 | 19.0 | 37.1 | 18.5 | 7.8 | 6.9 | 9600 | 8000 | 1530 |
| Female | 20.7 | 24.7 | 37.2 | 12.8 | 2.7 | 2.0 | 6300 | 5000 | 1460 |
| by age: | |||||||||
| 16-19 | * | * | * | * | * | * | * | * | 30 |
| 20-29 | 18.0 | 19.7 | 40.2 | 13.1 | 4.9 | 4.1 | 7200 | 6000 | 260 |
| 30-39 | 12.7 | 18.3 | 38.4 | 18.3 | 7.3 | 5.0 | 8400 | 7500 | 480 |
| 40-49 | 8.8 | 19.2 | 36.1 | 22.4 | 7.2 | 6.3 | 9700 | 8000 | 640 |
| 50-59 | 11.7 | 18.9 | 36.8 | 19.3 | 6.0 | 7.3 | 9400 | 8000 | 640 |
| 60-69 | 16.3 | 25.0 | 40.8 | 11.1 | 4.3 | 2.5 | 7300 | 6000 | 580 |
| 70-79 | 24.1 | 32.3 | 34.7 | 6.2 | 1.4 | 1.3 | 5400 | 5000 | 280 |
| 80+ | 30.0 | 44.5 | 22.2 | 3.0 | . | 0.2 | 3900 | 3500 | 90 |
| by current situation: | |||||||||
| Self employed | 9.3 | 13.2 | 34.8 | 24.7 | 9.4 | 8.5 | 11100 | 10000 | 280 |
| Employed full time | 10.1 | 17 | 38 | 20.3 | 7.8 | 6.8 | 9600 | 8000 | 1350 |
| Employed part time | 17.2 | 23.8 | 41.7 | 12.2 | 3.7 | 1.4 | 6400 | 6000 | 330 |
| Looking after the home/family | 15.4 | 32.5 | 34.9 | 10.5 | . | 6.6 | 6900 | 5000 | 90 |
| Permanently retired from work | 21.2 | 32.4 | 36 | 7.9 | 1.7 | 0.9 | 5700 | 5000 | 760 |
| Unemployed/seeking work | 28.2 | 19.3 | 42.2 | 6.7 | . | 3.5 | 5800 | 4000 | 50 |
| In further/higher education | 37.9 | 21.6 | 29.9 | 8.2 | 1.7 | 0.6 | 4100 | 2000 | 60 |
| Permanently sick or disabled | 42.1 | 17.7 | 25.8 | 11.5 | 2.8 | . | 4700 | 3000 | 60 |
| by annual net household income: | |||||||||
| up to £10,000 p.a. | 25.5 | 28.8 | 34.1 | 7.1 | 1.4 | 3.1 | 5800 | 5000 | 180 |
| over £10,000 - £15,000 | 22.2 | 30.5 | 34.7 | 8.1 | 2.3 | 2.3 | 6100 | 5000 | 320 |
| over £15,000 - £20,000 | 19.6 | 25.1 | 39.1 | 10.5 | 2.5 | 3.2 | 6600 | 5000 | 370 |
| over £20,000 - £25,000 | 15.8 | 23.2 | 35.5 | 17.0 | 2.8 | 5.7 | 7900 | 6000 | 350 |
| over £25,000 - £30,000 | 14.1 | 24.0 | 41.3 | 12.4 | 4.9 | 3.3 | 7700 | 6000 | 320 |
| over £30,000 - £40,000 | 13.2 | 18.9 | 34.9 | 19.9 | 8.4 | 4.8 | 8900 | 7500 | 540 |
| over £40,000 p.a. | 11.6 | 16.2 | 38.5 | 20.4 | 7.3 | 5.9 | 9200 | 8000 | 850 |
| by Scottish Index of Multiple Deprivation quintiles: | |||||||||
| 1 (20% most deprived) | 19.2 | 25.2 | 34.9 | 12.8 | 3.7 | 4.2 | 7100 | 5000 | 320 |
| 2' | 16.6 | 21.7 | 35.7 | 15.5 | 6.0 | 4.6 | 8000 | 6000 | 490 |
| 3' | 13.8 | 19.1 | 38.4 | 16.6 | 7.3 | 4.8 | 8400 | 7000 | 620 |
| 4' | 13.1 | 21.9 | 36.7 | 18.1 | 5.0 | 5.2 | 8500 | 7500 | 810 |
| 5 (20% least deprived) | 16.0 | 21.6 | 38.8 | 14.6 | 4.8 | 4.1 | 7700 | 6000 | 750 |
| by urban/rural classification: | |||||||||
| Large urban areas | 17.9 | 27.5 | 37.9 | 10.7 | 3.6 | 2.4 | 6400 | 5000 | 890 |
| Other urban | 15.9 | 19.9 | 38 | 15.7 | 5.6 | 4.9 | 8200 | 7000 | 910 |
| Small accessible towns | 12.7 | 18.8 | 38 | 18.9 | 5.4 | 6.2 | 8900 | 8000 | 310 |
| Small remote towns | 16.8 | 24.8 | 32.1 | 17.2 | 6.4 | 2.7 | 7500 | 6000 | 170 |
| Accessible rural | 10.8 | 16.8 | 35.2 | 22.4 | 7.3 | 7.5 | 9700 | 8000 | 420 |
| Remote rural | 13.9 | 17.9 | 34.8 | 20.3 | 7.5 | 5.7 | 9300 | 9000 | 300 |
| by frequency of driving†: | |||||||||
| Every day | 7.1 | 18.5 | 41.0 | 19.9 | 7.2 | 6.4 | 9800 | 8000 | 1810 |
| At least three times a week | 16.6 | 28.6 | 38.1 | 11.9 | 3.0 | 1.7 | 6600 | 5000 | 650 |
| Once or twice a week | 39.7 | 32.7 | 21.5 | 3.3 | 1.1 | 1.6 | 3700 | 2500 | 250 |
| Less often | 80.8 | 9.8 | 8.4 | 1.0 | . | . | 1200 | 100 | 100 |
| 2003 | 2004 | 2005 | 2006 | 2007 1 | 2008 | 2009 | 2010 | 2011 | 2012 | 2013 | 2014 | 2015 | 2015 sample size | |
|---|---|---|---|---|---|---|---|---|---|---|---|---|---|---|
| cell percentages | ||||||||||||||
| All | 71.3 | 69.3 | 68.6 | 69.9 | 80.4 | 78.5 | 76.6 | 73.9 | 73.2 | 73.4 | 75.6 | 76.9 | 76.6 | 9,410 |
| Gender | ||||||||||||||
| male | 73.4 | 70.6 | 71.3 | 72.6 | 82.4 | 80.4 | 77.8 | 76.5 | 75.5 | 74.5 | 77.2 | 78.6 | 78.4 | 4,240 |
| female | 69.6 | 68.3 | 66.2 | 67.4 | 78.6 | 76.7 | 75.4 | 71.5 | 71.2 | 72.4 | 74.2 | 75.2 | 74.9 | 5,160 |
| Age | ||||||||||||||
| 16 - 19 | 73.0 | 73.8 | 69.3 | 69.7 | 84.6 | 77.9 | 75.4 | 75.5 | 76.4 | 77.7 | 76.4 | 80.0 | 82.2 | 260 |
| 20 - 29 | 77.7 | 74.3 | 71.9 | 74.1 | 87.5 | 83.2 | 80.0 | 77.8 | 74.3 | 76.2 | 79.8 | 80.5 | 79.3 | 1,070 |
| 30 - 39 | 78.2 | 77.4 | 75.1 | 75.8 | 85.1 | 79.8 | 81.2 | 80.0 | 77.5 | 77.3 | 78.2 | 79.7 | 80.2 | 1,310 |
| 40 - 49 | 79.5 | 76.1 | 75.3 | 76.5 | 82.3 | 83.1 | 79.4 | 80.1 | 78.8 | 78.5 | 79.7 | 82.2 | 82.3 | 1,470 |
| 50 - 59 | 76.2 | 72.5 | 72.5 | 73.5 | 82.5 | 81.3 | 79.9 | 75.1 | 76.3 | 74.8 | 79.9 | 78.7 | 76.4 | 1,680 |
| 60 - 69 | 65.2 | 63.2 | 62.3 | 64.5 | 77.3 | 75.3 | 76.6 | 70.6 | 69.8 | 72.3 | 74.4 | 75.6 | 75.4 | 1,700 |
| 70 - 79 | 52.1 | 54.5 | 54.6 | 54.7 | 66.4 | 68.8 | 64.8 | 63.4 | 64.0 | 64.3 | 63.6 | 68.0 | 67.5 | 1,220 |
| 80 and over | 39.6 | 40.1 | 36.3 | 38.3 | 50.8 | 55.0 | 50.9 | 38.6 | 48.7 | 40.1 | 47.2 | 45.7 | 51.4 | 700 |
| Sample size | 13,960 | 14,770 | 14,060 | 14,180 | 8,820 | 9,150 | 9,300 | 8,590 | 9,240 | 9,890 | 9,920 | 9,800 | 9,410 | |
1 Prior to 2007 only journeys over 1/4 mile or 5 minutes on foot were recorded. Since 2007 all journeys are recorded. This creates a distcontinuity in the time series between 2006 and 2007.
| 2003 | 2004 | 2005 | 2006 | 2007 2 | 2008 | 2009 | 2010 | 2011 | 2012 3 | 2013 | 2014 | 2015 | |
|---|---|---|---|---|---|---|---|---|---|---|---|---|---|
| column percentages | |||||||||||||
| Walking | 15.6 | 15.3 | 13.5 | 13.6 | 22.0 | 22.2 | 21.8 | 22.0 | 22.1 | 26.0 | 23.3 | 25.0 | 21.6 |
| Driver car/van | 53.7 | 52.7 | 54.6 | 54.5 | 50.2 | 49.8 | 51.0 | 51.1 | 49.9 | 48.3 | 50.0 | 48.1 | 50.7 |
| Passenger car/van | 16.2 | 15.8 | 15.4 | 15.4 | 13.4 | 13.8 | 13.3 | 14.3 | 13.1 | 12.7 | 13.6 | 13.0 | 13.3 |
| Bicycle | 0.8 | 0.8 | 0.9 | 0.9 | 0.7 | 1.0 | 0.9 | 0.8 | 1.3 | 1.2 | 1.0 | 1.4 | 1.2 |
| Bus | 9.7 | 10.3 | 10.4 | 11.2 | 9.3 | 9.1 | 8.6 | 8.7 | 9.1 | 8.1 | 8.5 | 8.6 | 9.5 |
| Taxi/minicab | 1.6 | 1.9 | 2.2 | 1.6 | 1.5 | 1.5 | 1.4 | 0.8 | 1.3 | 1.3 | 1.6 | 1.2 | 1.3 |
| Rail | 1.3 | 1.7 | 1.9 | 1.8 | 1.7 | 1.6 | 1.9 | 1.4 | 2.0 | 1.8 | 1.7 | 2.1 | 1.7 |
| Other | 1.1 | 1.4 | 1.2 | 0.9 | 1.1 | 1.0 | 1.0 | 1.0 | 1.2 | 0.7 | 0.3 | 0.6 | 0.7 |
| Sample size (=100%) | 26,790 | 27,120 | 24,660 | 25,220 | 20,520 | 20,450 | 18,680 | 16,300 | 17,590 | 19,740 | 20,180 | 19,930 | 18,710 |
1 Where a journey involves more than one mode of transport (e.g. a bus then a train), the main mode is defined as the one used for the longest (in distance) stage.
2 Prior to 2007 only journeys over 1/4 mile or 5 minutes on foot were recorded. Since 2007 all journeys are recorded. This creates a distcontinuity in the time series between 2006 and 2007.
3 The questionnaire was changed in 2012 and as a result more walking journeys are recorded so there is a break in the time series between 2011 and 2012.
| Main Mode of Transport | Sample size | ||||||||
|---|---|---|---|---|---|---|---|---|---|
| Walking | Driver car/van | Passenger car/van | Bicycle | Bus | Taxi/ minicab | Rail | Other | ||
| row percentages | |||||||||
| All | 21.6 | 50.7 | 13.3 | 1.2 | 9.5 | 1.3 | 1.7 | 0.7 | 18,710 |
| by distance: | |||||||||
| Under 1 km | 65.2 | 26.0 | 5.4 | 0.6 | 1.8 | 0.7 | . | 0.3 | 4,610 |
| 1 to under 2km | 28.2 | 45.1 | 12.4 | 1.9 | 8.7 | 3.0 | 0.2 | 0.5 | 2,880 |
| 2 to under 3km | 12.3 | 54.0 | 13.0 | 2.3 | 14.6 | 2.2 | 0.1 | 1.5 | 1,890 |
| 3 to under 5km | 6.8 | 56.5 | 16.2 | 2.0 | 15.2 | 0.9 | 1.3 | 1.1 | 2,300 |
| 5 to under 10km | 1.8 | 59.2 | 17.2 | 1.2 | 15.6 | 1.4 | 2.9 | 0.7 | 2,940 |
| 10 to under 15km | 0.4 | 67.1 | 18.3 | 0.5 | 9.1 | 1.3 | 2.8 | 0.5 | 1,380 |
| 15 to 20km | 0.5 | 70.1 | 17.6 | 0.6 | 8.0 | 0.1 | 3.0 | 0.1 | 770 |
| 20 to 40km | . | 69.0 | 16.2 | 0.5 | 6.5 | 0.5 | 7.2 | 0.1 | 1,290 |
| 40km and over | . | 66.9 | 18.2 | 0.2 | 8.2 | 0.1 | 4.5 | 1.9 | 670 |
1. Distances are calculated as a straight line between the start and end points of each stage / journey. A version of this table using the road network distance is included in Annex A of the web tables. More details on the differences between the straight line and road network distance can be found in TATIS Appendix A.
| 2003 | 2004 | 2005 | 2006 | 2007 2 | 2008 | 2009 | 2010 | 2011 | 2012 3 | 2013 | 2014 | 2015 | |
|---|---|---|---|---|---|---|---|---|---|---|---|---|---|
| column percentages | |||||||||||||
| Walking | 16 | 15.7 | 14.1 | 14.1 | 21.7 | 22.1 | 21.6 | 21.7 | 21.8 | 26.7 | 24.1 | 25.9 | 22.8 |
| Driver car/van | 53.5 | 52.6 | 54.3 | 54.2 | 50 | 49.6 | 50.9 | 50.8 | 49.8 | 47.4 | 49.2 | 47.1 | 49.7 |
| Passenger car/van | 15.8 | 15.4 | 14.9 | 15.1 | 13.5 | 13.8 | 13.3 | 14.3 | 13.1 | 12.7 | 13.5 | 12.8 | 13.1 |
| Bicycle | 0.8 | 0.8 | 0.8 | 1.0 | 0.8 | 1.0 | 0.9 | 0.8 | 1.3 | 1.3 | 1.0 | 1..4 | 1.3 |
| Bus | 9.6 | 10.3 | 10.3 | 11.0 | 9.5 | 9.1 | 8.7 | 8.8 | 9.3 | 8.1 | 8.5 | 8.7 | 9.4 |
| Taxi/minicab | 1.6 | 1.9 | 2.2 | 1.6 | 1.5 | 1.6 | 1.4 | 1.0 | 1.4 | 1.3 | 1.6 | 1.3 | 1.4 |
| Rail | 1.4 | 1.7 | 2.0 | 1.9 | 1.8 | 1.7 | 2.1 | 1.5 | 2.1 | 1.8 | 1.7 | 2.1 | 1.7 |
| Other | 1.3 | 1.6 | 1.5 | 1.2 | 1.2 | 1.1 | 1.2 | 1.2 | 1.3 | 0.7 | 0.4 | 0.7 | 0.6 |
| Sample size (=100%) | 28,410 | 28,880 | 26,390 | 27,180 | 20,730 | 20,640 | 18,930 | 16,550 | 17,810 | 20,310 | 20,780 | 20,500 | 19,110 |
1 A stage is defined as a part of a journey involving one form of transport. A journey will have one or more stages (e.g. a bus then a train) counts as one bus stage and one train stage. Short walks between modes of transport are not included.
2 Prior to 2007 only journeys over 1/4 mile or 5 minutes on foot were recorded. Since 2007 all journeys are recorded. This creates a distcontinuity in the time series between 2006 and 2007.
3 The questionnaire was changed in 2012 and as a result more walking journeys are recorded so there is a break in the time series between 2011 and 2012.
| 2003 | 2004 | 2005 | 2006 | 2007 1,2 | 2008 | 2009 | 2010 | 2011 | 2012 3 | 2013 | 2014 | 2015 | |
|---|---|---|---|---|---|---|---|---|---|---|---|---|---|
| column percentages | |||||||||||||
| commuting | 24.9 | 24.5 | 26.8 | 25.6 | 23.6 | 24.2 | 23.8 | 26.5 | 25.8 | 23.4 | 22.5 | 23.0 | 22.4 |
| business | 3.7 | 3.8 | 4.3 | 4 | 1.5 | 1.2 | 1.2 | 0.9 | 0.7 | 1.9 | 2.5 | 2.3 | 2.2 |
| Education | 3.1 | 3.1 | 3.2 | 3.3 | 3.4 | 3.1 | 3.7 | 3.5 | 3.6 | 6.2 | 6.5 | 6.6 | 6.8 |
| Shopping | 23.2 | 22.9 | 21.2 | 21.3 | 23.4 | 22.8 | 23.1 | 23.3 | 21.1 | 23.1 | 23.1 | 22.6 | 23.8 |
| Visit Hospital or other health | 2.5 | 2.8 | 2.3 | 2.6 | 2.6 | 2.4 | 2.5 | 2.5 | 2.3 | 2.2 | 2.0 | 2.0 | 2.1 |
| Other personal business | 6.3 | 6.7 | 6.9 | 7.2 | 6.9 | 6.2 | 6.9 | 6.4 | 6.9 | 3.4 | 4.3 | 3.4 | 4.4 |
| Visiting friends or relatives | 11.2 | 10.6 | 10.4 | 11.1 | 10.9 | 12 | 11.2 | 10.8 | 11.9 | 11.3 | 12.1 | 10.6 | 11.3 |
| Eating/Drinking | 3.5 | 3.8 | 3.3 | 2.9 | 4.8 | 4.3 | 4.1 | 3.7 | 4.1 | 2.8 | 3.2 | 3.0 | 3.6 |
| Sport/Entertainment | 5.9 | 6.3 | 6.3 | 6.4 | 7.1 | 7.3 | 7.9 | 6.8 | 7.6 | 5.3 | 5.4 | 5.5 | 6.1 |
| Holiday/daytrip | 4.4 | 4.6 | 3.4 | 3.9 | 1.7 | 2 | 2.3 | 1.9 | 1.8 | 0.9 | 1.0 | 1.1 | 1.3 |
| Other Journey | 3.3 | 2.9 | 3.1 | 3.6 | 0.2 | 0.1 | 0.5 | 0.4 | 0.3 | 4.8 | 3.0 | 4.9 | 1.5 |
| Escort | 8 | 8 | 8.6 | 8.2 | 8 | 7.5 | 6.7 | 7.3 | 7.5 | 1.2 | 1.6 | 1.6 | 1.9 |
| Go Home 2 | .. | .. | .. | .. | 2.6 | 3.2 | 3.2 | 2.7 | 3.4 | 8.0 | 7.3 | 6.9 | 7.8 |
| Go for a walk 2 | .. | .. | .. | .. | 3.6 | 3.7 | 2.9 | 3.2 | 3 | 5.9 | 5.7 | 6.3 | 4.8 |
| Sample size (=100%) | 26,790 | 27,120 | 24,660 | 25,220 | 20,520 | 20,450 | 18,680 | 16,300 | 17,590 | 19,740 | 20,180 | 19,930 | 18,710 |
1 Prior to 2007 only journeys over 1/4 mile or 5 minutes on foot were recorded. Since 2007 all journeys are recorded. This creates a distcontinuity in the time series between 2006 and 2007.
2 From 2007 onwards two new categories, 'Go home' and 'just go for a walk', have been added. See the background note for more details.
3 Changes to the questionnaire design in 2012 resulted in a higher proportion of journeys being recorded as 'Go home'. This creates a discontinuity in the time series between 2011 and 2012.
4 This table includes a revision to the number of journeys recorded as "Go home" from 2012 onwards, due to updated coding practices. The previous series is included in an annexe.
| Number of stages in journey | Sample size (=100%) |
Average (mean) number of stages | ||||||
|---|---|---|---|---|---|---|---|---|
| 1 | 2 | 3 | 4 | 5 | ||||
| Row percentages | ||||||||
| All journeys | 97.65 | 1.82 | 0.48 | 0.05 | 0.01 | 172,020 | 1.03 | |
| Survey year | ||||||||
| 2007 | 99.17 | 0.64 | 0.15 | 0.04 | . | 20,500 | 1.01 | |
| 2008 | 99.3 | 0.57 | 0.08 | 0.04 | 0.01 | 20,420 | 1.01 | |
| 2009 | 98.95 | 0.9 | 0.11 | 0.03 | 0.01 | 18,650 | 1.01 | |
| 2010 | 98.78 | 0.99 | 0.23 | 0 | 0 | 16,290 | 1.01 | |
| 2011 | 98.75 | 1.11 | 0.13 | 0.01 | . | 17,590 | 1.01 | |
| 2012 | 95.51 | 3.39 | 0.98 | 0.08 | 0.04 | 19,740 | 1.06 | |
| 2013 | 96.12 | 2.98 | 0.79 | 0.06 | 0.06 | 20,180 | 1.05 | |
| 2014 | 95.7 | 3.32 | 0.9 | 0.08 | 0.01 | 19,930 | 1.05 | |
| 2015 | 96.77 | 2.3 | 0.86 | 0.07 | . | 18,710 | 1.04 | |
| Main Mode of Transport | ||||||||
| Walking | 98.5 | 1.1 | 0.4 | 0.0 | 0.0 | 40,870 | 1.02 | |
| Driver car/van | 99.0 | 0.9 | 0.1 | . | 0.0 | 76,750 | 1.01 | |
| Passenger car/van | 98.2 | 1.4 | 0.4 | 0.0 | 0.0 | 19,460 | 1.02 | |
| Motorcycle/moped | 97.9 | 1.7 | . | 0.5 | . | 230 | 1.03 | |
| Bicycle | 99.0 | 0.8 | 0.1 | . | 0.1 | 1,730 | 1.01 | |
| School Bus | 97.1 | 1.5 | 1.4 | . | . | 230 | 1.04 | |
| Works Bus | 90.9 | 7.3 | 1.2 | 0.5 | . | 370 | 1.11 | |
| Service Bus | 94.7 | 4.3 | 0.8 | 0.1 | 0.0 | 14,520 | 1.06 | |
| Taxi/minicab | 96.5 | 2.7 | 0.6 | 0.2 | . | 2,230 | 1.05 | |
| Rail | 66.7 | 23.6 | 8.9 | 0.7 | 0.2 | 2,410 | 1.44 | |
| Underground | 85.6 | 9.9 | 4.5 | . | . | 200 | 1.19 | |
| Ferry | 34.1 | 28.4 | 34.7 | 0.5 | 2.4 | 120 | 2.09 | |
| Aeroplane | 37.9 | 25.0 | 24.6 | 12.0 | 0.6 | 190 | 2.12 | |
| Other | 93.0 | 6.9 | 0.1 | . | . | 700 | 1.07 | |
** Cell value is based on less than 5 journeys so the value is suppressed.
1. The survey methodology used for the Travel Diary changed in 2012 which is likely to have led to an increase in the reporting of multi-stage journeys.
| 2003 | 2004 | 2005 | 2006 | 2007 1 | 2008 | 2009 | 2010 | 2011 | 2012 4 | 2013 | 2014 | 2015 | |
|---|---|---|---|---|---|---|---|---|---|---|---|---|---|
| column percentages | |||||||||||||
| Under 1 km | 17.1 | 18.2 | 15.8 | 15.6 | 23.5 | 24.8 | 24.4 | 23.8 | 23.8 | 25.9 | 24.6 | 25.4 | 22.7 |
| 1 to under 2km | 16.1 | 15.2 | 15.4 | 15.1 | 16.4 | 16.2 | 15.1 | 14.9 | 14.5 | 15.6 | 15.2 | 14.9 | 15.3 |
| 2 to under 3km | 10.2 | 10.7 | 10.6 | 10.1 | 10.3 | 11.2 | 10.4 | 9.3 | 10.6 | 10.6 | 10.1 | 9.8 | 10.0 |
| 3 to under 5km | 13.8 | 13.3 | 13.5 | 13.5 | 12.9 | 11.8 | 12.6 | 12.5 | 11.8 | 11.9 | 12.3 | 12.6 | 13.1 |
| 5 to under 10km | 17.3 | 16.9 | 17.4 | 18.6 | 15.5 | 15.4 | 15.4 | 15.5 | 16.5 | 14.7 | 16.0 | 15.3 | 16.2 |
| 10 to under 15km | 8.5 | 8.6 | 8.6 | 8.6 | 7.1 | 6.9 | 7.1 | 7.3 | 8.0 | 7.2 | 7.2 | 7.5 | 7.2 |
| 15 to 20km | 4.6 | 4.9 | 5.0 | 5.0 | 4.1 | 3.6 | 3.7 | 4.4 | 3.9 | 4.0 | 4.2 | 4.3 | 4.2 |
| 20 to 40km | 7.8 | 7.5 | 8.6 | 8.6 | 6.4 | 6.3 | 6.3 | 7.4 | 6.6 | 6.6 | 6.6 | 6.8 | 7.2 |
| 40km and over | 4.6 | 4.8 | 5.2 | 5.0 | 3.9 | 3.8 | 5.1 | 4.8 | 4.3 | 3.5 | 3.8 | 3.4 | 4.1 |
| Sample size (=100%) | 26,720 | 26,940 | 24,490 | 25,020 | 20,520 | 20,450 | 18,680 | 16,300 | 17,590 | 19,740 | 20,180 | 19,930 | 18,710 |
1. Distances are calculated as a straight line between the start and end points of each stage / journey. A version of this table using the road network distance is included in Annex A of the web tables. More details on the differences between the straight line and road network distance can be found in TATIS Appendix A.
2 Prior to 2007 only journeys over 1/4 mile or 5 minutes on foot were recorded. Since 2007 all journeys are recorded. This creates a distcontinuity in the time series between 2006 and 2007.
3. Note that 1km = 0.6 miles
4. The questionnaire was changed in 2012 and as a result more walking journeys are recorded so there is a break in the time series between 2011 and 2012.
| Under 1 km | 1 to under 2km | 2 to under 3km | 3 to under 5km | 5 to under 10km | 10 to under 15km | 15 to 20km | 20 to 40km | 40km and over | Sample size | |
|---|---|---|---|---|---|---|---|---|---|---|
| Row percentages | ||||||||||
| All | 22.7 | 15.3 | 10.0 | 13.1 | 16.2 | 7.2 | 4.2 | 7.2 | 4.1 | 18,710 |
| by mainmode: | ||||||||||
| Walking | 68.7 | 19.9 | 5.7 | 4.1 | 1.3 | 0.1 | 0.1 | 0.0 | . | 4,140 |
| Driver car | 11.6 | 13.7 | 10.8 | 14.7 | 19.0 | 9.7 | 5.9 | 9.5 | 5.1 | 9,300 |
| Driver van | 13.6 | 10.4 | 5.1 | 12.6 | 17.6 | 6.5 | 4.5 | 16.5 | 13.3 | 370 |
| Passenger car | 9.5 | 14.4 | 9.9 | 16.3 | 20.5 | 10.1 | 5.6 | 8.3 | 5.4 | 2,270 |
| Passenger van | 3.1 | 10.6 | 6.8 | 4.9 | 33.3 | 6.6 | 4.4 | 19.3 | 11.0 | 70 |
| Bicycle | 11.3 | 24.3 | 18.6 | 21.5 | 16.0 | 2.7 | 2.1 | 3.0 | 0.6 | 210 |
| Bus | 4.3 | 13.9 | 15.3 | 20.9 | 26.6 | 6.9 | 3.6 | 4.9 | 3.6 | 1,730 |
| Taxi/minicab | 12.5 | 34.1 | 16.4 | 8.4 | 17.7 | 7.3 | 0.3 | 2.9 | 0.4 | 250 |
| Rail | . | 1.8 | 0.8 | 9.9 | 27.5 | 11.8 | 7.5 | 30.0 | 10.8 | 270 |
| Other | 7.5 | 13.8 | 20.2 | 25.6 | 13.4 | 4.1 | 0.8 | 1.9 | 12.8 | 110 |
1. Distances are calculated as a straight line between the start and end points of each stage / journey. A version of this table using the road network distance is included in Annex A of the web tables. More details on the differences between the straight line and road network distance can be found in TATIS Appendix A.
| 2003 | 2004 | 2005 | 2006 | 2007 1 | 2008 | 2009 | 2010 | 2011 | 2012 4 | 2013 | 2014 | 2015 | |
|---|---|---|---|---|---|---|---|---|---|---|---|---|---|
| Kilometres | |||||||||||||
| Lower Decile | 0.6 | 0.6 | 0.7 | 0.7 | 0.4 | 0.4 | 0.4 | 0.4 | 0.4 | 0.4 | 0.4 | 0.4 | 0.4 |
| Lower Quartile | 1.4 | 1.4 | 1.6 | 1.6 | 1.1 | 1.0 | 1.0 | 1.1 | 1.1 | 1.0 | 1.0 | 1.0 | 1.1 |
| Median | 3.8 | 3.7 | 4.1 | 4.3 | 3.0 | 2.8 | 3.0 | 3.3 | 3.1 | 2.7 | 3.0 | 3.0 | 3.3 |
| Upper Quartile | 10.3 | 10.4 | 11.2 | 10.9 | 8.4 | 8.2 | 8.7 | 9.5 | 8.9 | 8.3 | 8.7 | 8.5 | 9.0 |
| Upper Decile | 23.7 | 23.2 | 25.2 | 24.8 | 20.5 | 20.1 | 22.3 | 24.0 | 21.2 | 20.2 | 20.8 | 20.2 | 21.8 |
| Mean | 10.1 | 10.3 | 11.4 | 10.8 | 9.2 | 10.2 | 10.5 | 10.8 | 10.3 | 8.3 | 8.5 | 8.4 | 8.9 |
| Sample size | 26,720 | 26,940 | 24,490 | 25,020 | 20,520 | 20,450 | 18,680 | 16,300 | 17,590 | 19,740 | 20,180 | 19,930 | 18,710 |
1. Distances are calculated as a straight line between the start and end points of each stage / journey. A version of this table using the road network distance is included in Annex A of the web tables. More details on the differences between the straight line and road network distance can be found in TATIS Appendix A.
2 Prior to 2007 only journeys over 1/4 mile or 5 minutes on foot were recorded. Since 2007 all journeys are recorded. This creates a distcontinuity in the time series between 2006 and 2007.
3. Note that 1km = 0.6 miles
4. The questionnaire was changed in 2012 and as a result more walking journeys are recorded so there is a break in the time series between 2011 and 2012.
| Main Mode of Transport | |||||||||
|---|---|---|---|---|---|---|---|---|---|
| Walking | Driver car/van | Passenger car/van | Bicycle | Bus | Taxi/ minicab | Rail | Other | All modes | |
| Kilometres | |||||||||
| Lower Decile | 0.2 | 0.9 | 1.0 | 0.9 | 1.5 | 0.9 | 4.6 | 1.4 | 0.4 |
| Lower Quartile | 0.3 | 2.0 | 2.1 | 1.6 | 2.5 | 1.4 | 6.3 | 2.2 | 1.1 |
| Median | 0.6 | 4.8 | 5.0 | 2.5 | 4.3 | 2.3 | 13.3 | 3.3 | 3.3 |
| Upper Quartile | 1.2 | 11.9 | 11.4 | 4.7 | 8.2 | 6.2 | 27.7 | 9.8 | 9.0 |
| Upper Decile | 2.2 | 26.0 | 24.0 | 9.1 | 17.0 | 10.0 | 41.6 | 72.1 | 21.8 |
| Mean | 1.0 | 10.8 | 11.3 | 4.7 | 9.0 | 4.5 | 20.6 | 32.0 | 8.9 |
| Sample size | 4,140 | 9,300 | 2,270 | 210 | 1,730 | 250 | 270 | 110 | 18,710 |
1. Distances are calculated as a straight line between the start and end points of each stage / journey. A version of this table using the road network distance is included in Annex A of the web tables. More details on the differences between the straight line and road network distance can be found in TATIS Appendix A.
| 2003 | 2004 | 2005 | 2006 | 2007 1 | 2008 | 2009 | 2010 | 2011 | 2012 2 | 2013 | 2014 | 2015 | |
|---|---|---|---|---|---|---|---|---|---|---|---|---|---|
| column percentages | |||||||||||||
| Less than 5 min | 1.6 | 1.6 | 1.5 | 1.6 | 6.2 | 6.9 | 6.3 | 5.5 | 5.1 | 4.5 | 4.1 | 3.7 | 3.9 |
| 5 to 10 min | 25.9 | 26.6 | 26.3 | 24.4 | 39.6 | 39.4 | 38.4 | 36.4 | 37.7 | 40.1 | 38.3 | 38.1 | 31.4 |
| 11 to 20 min | 31 | 30.1 | 29.6 | 30.6 | 26.6 | 26.9 | 25.9 | 26.9 | 26.4 | 26.9 | 28.1 | 28.3 | 29.3 |
| 21 to 30 min | 18.1 | 18.2 | 18 | 18.1 | 12.5 | 12.4 | 12.8 | 13.5 | 14.2 | 13.4 | 14.2 | 13.9 | 15.7 |
| 31 to 60 min | 14.6 | 14.8 | 15.3 | 15.6 | 10.5 | 10 | 10.8 | 11.5 | 11.1 | 10.8 | 10.9 | 11.8 | 13.1 |
| 61 to 120 min | 5.1 | 5.1 | 5.3 | 5.7 | 3.3 | 3.1 | 3.7 | 4.1 | 3.7 | 3 | 3.1 | 3.0 | 4.4 |
| 121 to 179 min | 1.2 | 1.1 | 1.1 | 1.3 | 0.4 | 0.4 | 0.6 | 0.7 | 0.6 | 0.4 | 0.4 | 0.4 | 0.9 |
| 180 min and over | 2.5 | 2.5 | 2.9 | 2.7 | 0.8 | 0.9 | 1.5 | 1.4 | 1.2 | 0.9 | 0.8 | 0.8 | 2.1 |
| Sample size (=100%) | 26,790 | 27,120 | 24,640 | 25,200 | 20,520 | 20,450 | 18,680 | 16,300 | 17,590 | 19,740 | 20,180 | 19,930 | 18,710 |
1 Prior to 2007 only journeys over 1/4 mile or 5 minutes on foot were recorded. Since 2007 all journeys are recorded. This creates a distcontinuity in the time series between 2006 and 2007.
2 The questionnaire was changed in 2012 and as a result more walking journeys are recorded so there is a break in the time series between 2011 and 2012.
| 2003 | 2004 | 2005 | 2006 | 2007 1 | 2008 | 2009 | 2010 | 2011 | 2012 | 2013 | 2014 | 2015 | |
|---|---|---|---|---|---|---|---|---|---|---|---|---|---|
| Weekdays | column percentages | ||||||||||||
| Before 7am | 2.9 | 3.3 | 3.7 | 3.3 | 4.8 | 4.2 | 4.2 | 4.2 | 4.0 | 3.7 | 3.9 | 3.7 | 4.2 |
| 7am to 9:30am | 18.9 | 18.7 | 20.0 | 19.6 | 18.2 | 18.9 | 20.2 | 19.9 | 20.5 | 18.8 | 19.3 | 19.5 | 19.5 |
| After 9:30am to before 12noon | 13.9 | 14.3 | 13.1 | 13.3 | 13.6 | 13.1 | 13.6 | 13.3 | 12.7 | 13.1 | 12.6 | 13.2 | 13.1 |
| 12noon to 2 pm | 15.6 | 15.2 | 15.1 | 15.0 | 15.5 | 14.9 | 15.2 | 15.5 | 14.6 | 15.2 | 15.1 | 14.8 | 15.5 |
| After 2pm to before 4:30pm | 17.5 | 18.0 | 17.0 | 17.4 | 16.5 | 16.4 | 15.9 | 15.8 | 16.5 | 17.9 | 17.4 | 17.1 | 17.7 |
| 4:30pm to before 6:30pm | 16.0 | 15.5 | 16.3 | 16.3 | 15.3 | 15.6 | 15.4 | 15.8 | 16.3 | 16.6 | 16.6 | 16.3 | 15.4 |
| 6:30pm onwards | 15.3 | 15.0 | 14.9 | 15.2 | 16.1 | 17.0 | 15.7 | 15.5 | 15.3 | 14.8 | 15.2 | 15.5 | 14.7 |
| Sample size (=100%) | 20,620 | 21,050 | 19,600 | 19,900 | 16,210 | 16,070 | 15,000 | 12,830 | 13,940 | 15,410 | 15,890 | 15,550 | 14,640 |
| Weekends | |||||||||||||
| Before 9:30am 2 | 10.1 | 10.6 | 11.6 | 10.0 | 11.0 | 9.7 | 9.9 | 9.8 | 10.3 | 9.8 | 8.4 | 8.9 | 7.7 |
| 9:30am to before 12noon | 19.0 | 18.9 | 16.6 | 17.6 | 19.0 | 17.4 | 19.4 | 20.4 | 19.1 | 18.5 | 18.5 | 20.4 | 19.4 |
| 12noon to 2 pm | 21.2 | 21.6 | 23.1 | 23.4 | 21.8 | 22.9 | 23.2 | 22.7 | 23.9 | 23.6 | 24.7 | 25.1 | 24.9 |
| After 2pm to before 4:30pm | 19.7 | 18.8 | 18.1 | 19.8 | 16.5 | 18.1 | 16.9 | 18.2 | 18.1 | 18.4 | 19.1 | 18.9 | 18.5 |
| 4:30pm to before 6:30pm | 14.5 | 13.5 | 13.8 | 14.0 | 14.4 | 13.3 | 15.0 | 14.2 | 13.5 | 14.1 | 13.6 | 13.4 | 14.1 |
| 6:30pm onwards | 15.6 | 16.7 | 16.7 | 15.3 | 17.3 | 18.7 | 15.8 | 14.7 | 15.1 | 15.7 | 15.8 | 13.4 | 15.4 |
| Sample size (=100%) | 6,170 | 6,070 | 5,050 | 5,300 | 4,310 | 4,380 | 3,680 | 3,470 | 3,650 | 4,330 | 4,290 | 4,380 | 4,072 |
1 Prior to 2007 only journeys over 1/4 mile or 5 minutes on foot were recorded. Since 2007 all journeys are recorded. This creates a distcontinuity in the time series between 2006 and 2007.
2 Before 7am combined with 7am to 9:30am for weekends due to small sample sizes.
| 2003 | 2004 | 2005 | 2006 | 2007 1 | 2008 | 2009 | 2010 | 2011 | 2012 | 2013 | 2014 | 2015 | |
|---|---|---|---|---|---|---|---|---|---|---|---|---|---|
| column percentages | |||||||||||||
| Monday | 13.4 | 13.7 | 13.6 | 14.6 | 14.1 | 14.1 | 14 | 13.9 | 14.9 | 14.6 | 14.0 | 14.1 | 14.6 |
| Tuesday | 14.3 | 14.7 | 14.1 | 14.9 | 14.9 | 14.5 | 14.5 | 14.9 | 15.2 | 15.7 | 15.3 | 14.7 | 14.44 |
| Wednesday | 14.6 | 15.3 | 15.7 | 14.5 | 15.3 | 14.8 | 14.9 | 14.8 | 14.6 | 15.5 | 15.1 | 15.1 | 14.78 |
| Thursday | 15.7 | 15.7 | 15.5 | 13.9 | 15.4 | 14 | 14.8 | 15.2 | 15.3 | 15.3 | 15.9 | 15.4 | 15.02 |
| Friday | 16 | 16 | 15.8 | 17.2 | 14.8 | 15.9 | 14.3 | 15.9 | 15.5 | 15.1 | 15.2 | 16.5 | 15.73 |
| Saturday | 14.3 | 13.5 | 14.1 | 12.8 | 13.3 | 14.8 | 13.9 | 13.2 | 12.8 | 12.5 | 12.6 | 12.7 | 13.85 |
| Sunday | 11.6 | 11.1 | 11.1 | 12 | 12.2 | 11.7 | 13.7 | 12 | 11.7 | 11.4 | 11.9 | 11.6 | 11.56 |
| Sample size (=100%) | 26,790 | 27,120 | 24,660 | 25,220 | 20,520 | 20,450 | 18,680 | 16,300 | 17,590 | 19,740 | 20,180 | 19,930 | 18,710 |
1 Prior to 2007 only journeys over 1/4 mile or 5 minutes on foot were recorded. Since 2007 all journeys are recorded. This creates a distcontinuity in the time series between 2006 and 2007.
| 2003 | 2004 | 2005 | 2006 | 2007 | 2008 | 2009 | 2010 | 2011 | 2012 | 2013 | 2014 | 2015 | ||
|---|---|---|---|---|---|---|---|---|---|---|---|---|---|---|
| column percentages | ||||||||||||||
| One | 59.6 | 59.7 | 60.7 | 60.5 | 61.5 | 60.2 | 60.5 | 61.5 | 63.4 | 64.0 | 65.3 | 64.5 | 64.7 | |
| Two | 27.3 | 26.7 | 26.6 | 26.8 | 26.3 | 27.1 | 25.8 | 25.8 | 25.6 | 25.4 | 23.6 | 24.7 | 25.0 | |
| Three | 8.0 | 8.6 | 8.0 | 8.1 | 7.3 | 7.4 | 8.3 | 8.1 | 6.8 | 6.9 | 7.1 | 6.9 | 6.7 | |
| Four | 3.8 | 3.9 | 3.5 | 3.5 | 3.7 | 3.9 | 4.3 | 3.2 | 3.4 | 2.8 | 3.0 | 3.0 | 3.0 | |
| Five or More | 1.4 | 1.1 | 1.1 | 1.1 | 1.2 | 1.4 | 1.1 | 1.3 | 0.9 | 0.9 | 1.1 | 0.8 | 0.5 | |
| people | ||||||||||||||
| Average occupancy | 1.6 | 1.6 | 1.58 | 1.58 | 1.57 | 1.59 | 1.6 | 1.57 | 1.53 | 1.51 | 1.51 | 1.51 | 1.50 | |
| Sample size (=100%) | 15,110 | 15,040 | 14,400 | 14,790 | 10,370 | 10,330 | 9,660 | 8,330 | 8,880 | 9,830 | 10,200 | 9,820 | 9,320 | |
1 A journey can consist of one or more stages. A new stage is defined when there is a change in the form of transport or when there is a change of vehicle requiring a separate ticket.
2 Based on drivers who responded to the question on car occupancy. Respondents asked for all car stages.
| 2003 | 2004 | 2005 | 2006 | 2007 | 2008 | 2009 | 2010 | 2011 | 2012 | 2013 | 2014 | 2015 | |
|---|---|---|---|---|---|---|---|---|---|---|---|---|---|
| Driver congestion | 10.8 | 11.9 | 11.6 | 12.7 | 14.4 | 13.1 | 11.0 | 10.5 | 11.2 | 9.9 | 9.7 | 11.7 | 12.5 |
| Sample size (=100%) | 10,820 | 14,460 | 13,780 | 14,010 | 9,260 | 9,320 | 8,680 | 7,580 | 8,310 | 9,830 | 10,200 | 9,820 | 9,320 |
1 A journey can consist of one or more stages. A new stage is defined when there is a change in the form of transport or when there is a change of vehicle requiring a separate ticket.
2 Question first asked in 2003
| 2012 | 2013 | 2014 | 2015 | |
|---|---|---|---|---|
| Volume of traffic | 72.8 | 80.0 | 82.0 | 76.2 |
| Road or maintenance works / temporary traffic lights | 25.8 | 17.9 | 18.9 | 27.7 |
| Road accident | 1.1 | 1.6 | 1.7 | 1.5 |
| Broken down car | 0.7 | ** | 0.5 | 0.7 |
| Traffic lights / signals not working | 3.1 | 2.6 | 2.0 | 2.1 |
| Lane blocked by parked cars | 1.3 | ** | 0.4 | 0.3 |
| Bad weather | 1.4 | 1.6 | 1.5 | 1.0 |
| Other | 2.8 | 3.2 | 1.0 | 1.1 |
| Don't know | 0.4 | ** | 0.3 | 0.2 |
| Sample size (=100%) | 810 | 780 | 930 | 1023 |
1 Respondents can provide more than one reason so percentages will not add up to 100%
** Less than 1% and supressed as based on fewer than 5 responses
| 2003 | 2004 | 2005 | 2006 | 2007 | 2008 | 2009 | 2010 | 2011 | 2012 | 2013 | 2014 | 2015 | |
|---|---|---|---|---|---|---|---|---|---|---|---|---|---|
| Service Bus | 7.6 | 8.9 | 9.5 | 8.9 | 12.5 | 14.4 | 9.9 | 12.4 | 10.5 | 11.1 | 10.2 | 10.7 | 9.9 |
| Sample size (=100%) | 1,970 | 2,750 | 2,550 | 2,730 | 1,670 | 1,720 | 1,460 | 1,310 | 1,440 | 1,540 | 1,690 | 1,630 | 1,690 |
1 A journey can consist of one or more stages. A new stage is defined when there is a change in the form of transport or when there is a change of vehicle requiring a separate ticket.
2 Question first asked in 2003
| Not delayed | 0-2 minutes | about 5 mins | about 10 mins | about 15 mins | 20 to 30 mins | over 30 | Delayed | Sample size (=100%) | |
|---|---|---|---|---|---|---|---|---|---|
| All driver stages | 87.6 | 0.7 | 4.4 | 3.0 | 1.7 | 2.1 | 0.4 | 12.3 | 9,690 |
| by purpose of journey: | |||||||||
| Commuting | 77.8 | 0.9 | 5.6 | 6.1 | 3.9 | 4.6 | 0.7 | 21.8 | 2,470 |
| Business | 83.2 | . | 6.5 | 2.8 | 1.5 | 3.9 | 1.9 | 16.5 | 360 |
| Education | 84.6 | 0.5 | 5.7 | 4.6 | 1.5 | 3.1 | . | 15.4 | 500 |
| Shopping | 94.3 | 0.4 | 3.3 | 1.4 | 0.2 | 0.2 | 0.2 | 5.7 | 2,160 |
| Visit hospital/other health | 85.6 | 0.3 | 4.6 | 4.8 | 3.4 | 1.0 | 0.5 | 14.4 | 220 |
| Other personal business | 93.1 | 0.4 | 4.2 | 0.5 | 1.3 | 0.5 | . | 6.9 | 520 |
| Visiting friends/relatives | 91.7 | 0.7 | 3.2 | 1.6 | 1.3 | 1.3 | 0.2 | 8.3 | 1,140 |
| Eating/drinking | 93.5 | . | 2.6 | 2.6 | 1.4 | . | . | 6.5 | 180 |
| Entertainment | 92.5 | 0.4 | 2.5 | 0.5 | . | 3.0 | 1.1 | 120 | |
| Sport | 92.8 | 1.0 | 2.2 | 1.6 | 0.4 | 1.7 | . | 6.9 | 410 |
| Holiday/day trip | 94.0 | . | 2.6 | 0.2 | . | . | 0.8 | 3.6 | 160 |
| Other | 87.1 | 2.5 | 6.7 | 1.6 | . | 2.1 | . | 12.9 | 170 |
| Escort | 87.2 | 1.9 | 8.1 | 1.5 | 1.3 | . | . | 12.8 | 280 |
| Go home | 89.9 | 1.0 | 4.1 | 2.2 | 1.1 | 1.2 | 0.5 | 10.1 | 870 |
| Just go for a walk | 91.9 | 1.8 | 3.0 | 2.1 | . | 1.3 | . | 8.1 | 150 |
| by day of the week: | |||||||||
| Monday | 87.5 | 0.4 | 5.9 | 2.6 | 1.8 | 1.3 | 0.1 | 12.1 | 1,770 |
| Tuesday | 84.4 | 0.5 | 5.3 | 4.7 | 2.3 | 2.5 | 0.2 | 15.5 | 1,780 |
| Wednesday | 82.4 | 0.9 | 6.1 | 3.5 | 2.8 | 3.2 | 1.1 | 17.6 | 1,660 |
| Thursday | 86.6 | 1.0 | 4.6 | 3.2 | 1.7 | 2.5 | 0.3 | 13.2 | 1,300 |
| Friday | 85.2 | 0.9 | 3.5 | 3.8 | 2.2 | 3.6 | 0.4 | 14.5 | 1,180 |
| Saturday | 94.2 | 0.9 | 2.8 | 1.5 | 0.1 | 0.2 | 0.3 | 5.7 | 790 |
| Sunday | 95.6 | 0.3 | 1.9 | 1.2 | 0.3 | 0.4 | 0.3 | 4.4 | 1,210 |
| Weekday journeys - by start time: | |||||||||
| Before 7 a.m. | 85.7 | 0.7 | 2.5 | 5.0 | 2.5 | 2.8 | 0.5 | 14.1 | 300 |
| 7:00 to 7:59 a.m. | 74.1 | 1.0 | 5.3 | 5.5 | 5.0 | 7.0 | 1.2 | 25.0 | 530 |
| 8:00 to 8:59 a.m. | 75.3 | 1.6 | 9.6 | 6.5 | 3.2 | 3.3 | 0.5 | 24.6 | 680 |
| 9:00 to 9:59 a.m. | 91.8 | 0.5 | 3.7 | 1.7 | 0.9 | 1.4 | 0.2 | 8.2 | 430 |
| 10:00 to 10:59 a.m. | 94.7 | 0.5 | 2.1 | 1.1 | 0.6 | 0.8 | . | 5.1 | 480 |
| 11:00 to 11:59 a.m. | 93.1 | 0.9 | 2.4 | 1.3 | 1.1 | 1.1 | . | 6.9 | 490 |
| noon to 12:59 p.m. | 89.8 | 0.9 | 4.4 | 2.6 | 0.5 | 1.4 | . | 9.8 | 520 |
| 1:00 to 1:59pm | 91.5 | 0.4 | 3.0 | 2.4 | 0.5 | 1.4 | 0.2 | 7.9 | 430 |
| 2:00 to 2:59pm | 89.3 | 0.6 | 5.3 | 1.8 | 1.2 | 1.6 | 0.1 | 10.7 | 520 |
| 3:00 to 3:59pm | 88.4 | 0.1 | 5.1 | 3.2 | 1.2 | 1.2 | 0.2 | 11.0 | 600 |
| 4:00 to 4:59pm | 76.1 | 0.9 | 8.3 | 7.2 | 3.1 | 3.1 | 1.3 | 23.9 | 730 |
| 5:00 to 5:59pm | 71.1 | 1.7 | 8.0 | 6.0 | 5.7 | 7.0 | 0.4 | 28.8 | 700 |
| 6:00 to 6:59pm | 85.0 | 0.5 | 6.5 | 2.6 | 2.4 | 2.6 | 0.5 | 15.0 | 480 |
| 7:00 to 7:59pm | 97.1 | . | 1.4 | 0.2 | 0.5 | 0.2 | 0.6 | 2.9 | 330 |
| 8:00 to 8:59pm | 98.1 | . | 1.9 | . | . | . | . | 1.9 | 200 |
| 9:00 to 9:59pm | 100.0 | . | . | . | . | . | . | 0.0 | 150 |
| After 10pm | 97.5 | . | 0.2 | 1.1 | . | 1.2 | . | 2.5 | 140 |
| Weekend journeys - by start time: | |||||||||
| Before 9:30am | 97.6 | . | 1.4 | 0.4 | . | 0.7 | . | 2.4 | 180 |
| 9:30am to before 12noon | 94.9 | 0.9 | 2.2 | 1.0 | . | 0.1 | 0.7 | 4.9 | 430 |
| 12noon to 2 pm | 92.6 | 0.6 | 3.7 | 2.5 | 0.4 | 0.3 | 0.1 | 7.4 | 500 |
| After 2pm to before 4:30pm | 94.6 | 1.3 | 1.8 | 1.5 | 0.2 | 0.3 | 0.2 | 5.4 | 380 |
| 4:30pm to before 6:30pm | 95.5 | 0.3 | 1.8 | 1.4 | 0.2 | 0.4 | 0.3 | 4.5 | 300 |
| 6:30pm onwards | 98.0 | . | 2.0 | . | . | . | . | 2.0 | 210 |
| by urban/rural classification: | |||||||||
| Large urban areas | 84.0 | 0.7 | 5.4 | 4.3 | 2.5 | 2.4 | 0.5 | 15.8 | 2,450 |
| Other urban areas | 86.5 | 1.0 | 5.0 | 2.8 | 1.7 | 2.2 | 0.5 | 13.2 | 3,250 |
| "Accessible" small towns | 89.8 | 0.5 | 3.6 | 2.4 | 1.6 | 1.9 | 0.1 | 10.2 | 980 |
| "Remote" small towns | 94.5 | 1.2 | 1.5 | 0.5 | 0.3 | 0.9 | 0.8 | 5.1 | 610 |
| "Accessible" rural areas | 91.4 | 0.4 | 3.1 | 2.3 | 0.9 | 1.7 | 0.3 | 8.6 | 1,340 |
| "Remote" rural areas | 93.9 | 0.2 | 2.2 | 2.3 | 0.3 | 0.7 | 0.2 | 6.0 | 1,060 |
1 A journey can consist of one or more stages. A new stage is defined when there is a change in the form of transport or when there is a change of vehicle requiring a separate ticket.
2 Car drivers were asked "was this part of your trip delayed due to traffic congestion?". No definition of "traffic congestion" is given, so respondents can interpret the term as they wish. Those drivers who said that they had been delayed by traffic congestion were asked "how much time do you think was lost due to traffic congestion?".
** Cell values supressed as percentage figure based on less than 5 responses
| council area of destination | |||||||||||||||||
|---|---|---|---|---|---|---|---|---|---|---|---|---|---|---|---|---|---|
| Highland / Islands | Grampian | Tayside | Central | Fife | Edinburgh | Lothians | Glasgow | Dunbartonshire / Argyll & Bute | Renfrewshire / Inverclyde | North Lanarkshire | South Lanarkshire | Ayrshire | Borders / Dumfries & Galloway | Outside Scotland | Not Known | Sample size (=100%) | |
| Journey Origin (Council Area) | Row percentages | ||||||||||||||||
| Highland / Islands | 95 | 1 | 0 | 0 | 0 | 0 | 0 | 0 | 0 | 0 | 0 | 0 | 0 | 0 | 0 | 2 | 23,500 |
| Grampian | 1 | 96 | 1 | 0 | 0 | 0 | 0 | 0 | 0 | 0 | 0 | 0 | 0 | 0 | 0 | 2 | 21,830 |
| Tayside | 0 | 2 | 90 | 1 | 3 | 1 | 0 | 0 | 0 | 0 | 0 | 0 | 0 | 0 | 0 | 2 | 16,140 |
| Central | 0 | 0 | 1 | 84 | 1 | 2 | 2 | 2 | 1 | 0 | 2 | 0 | 0 | 0 | 0 | 2 | 15,810 |
| Fife | 0 | 0 | 4 | 1 | 86 | 3 | 1 | 0 | 0 | 0 | 0 | 0 | 0 | 0 | 0 | 3 | 11,940 |
| Edinburgh | 0 | 0 | 1 | 1 | 2 | 82 | 10 | 1 | 0 | 0 | 0 | 0 | 0 | 1 | 0 | 2 | 18,930 |
| Lothians | 0 | 0 | 0 | 2 | 1 | 16 | 74 | 1 | 0 | 0 | 1 | 1 | 0 | 1 | 0 | 2 | 13,990 |
| Glasgow | 0 | 0 | 0 | 1 | 0 | 1 | 0 | 70 | 6 | 8 | 4 | 5 | 2 | 0 | 0 | 2 | 22,020 |
| Dunbartonshire / Argyll & Bute | 0 | 0 | 0 | 2 | 0 | 0 | 0 | 14 | 75 | 3 | 2 | 1 | 0 | 0 | 0 | 2 | 13,780 |
| Renfrewshire / Inverclyde | 0 | 0 | 0 | 0 | 0 | 0 | 0 | 15 | 2 | 73 | 1 | 2 | 3 | 0 | 0 | 2 | 14,660 |
| North Lanarkshire | 0 | 0 | 0 | 2 | 0 | 1 | 1 | 9 | 2 | 1 | 73 | 8 | 0 | 0 | 0 | 2 | 9,680 |
| South Lanarkshire | 0 | 0 | 0 | 1 | 0 | 0 | 1 | 11 | 1 | 2 | 8 | 70 | 1 | 0 | 0 | 4 | 9,030 |
| Ayrshire | 0 | 0 | 0 | 0 | 0 | 0 | 0 | 3 | 0 | 3 | 0 | 1 | 89 | 1 | 0 | 2 | 14,590 |
| Borders / Dumfries & Galloway | 0 | 0 | 0 | 0 | 0 | 2 | 1 | 0 | 0 | 0 | 0 | 0 | 1 | 90 | 1 | 3 | 10,360 |
| Outside Scotland | 1 | 6 | 6 | 3 | 6 | 8 | 4 | 7 | 4 | 6 | 3 | 6 | 2 | 18 | 18 | 2 | 520 |
| Not Known | 5 | 8 | 8 | 5 | 7 | 10 | 6 | 11 | 5 | 6 | 5 | 9 | 7 | 5 | 0 | 4 | 5,200 |
| All journeys reported | 23530 | 21860 | 16190 | 15860 | 11920 | 19010 | 14030 | 22180 | 13780 | 14680 | 9660 | 9050 | 14620 | 10370 | 370 | 4870 | 221,970 |
** denotes cells with values supressed as they contain fewer than 5 respondents.
This table can be used to establish the percentage of journeys starting in a given council area that end in that and other council areas.
For example, the percentage of journeys starting in Fife which end in Edinburgh can be found by locating the row labelled Fife beneath Journey Origin and looking across to the figure appearing in the vertical column labelled Edinburgh. In this case 3% of journeys starting in Fife end in Edinburgh
| council area of origin | |||||||||||||||||
|---|---|---|---|---|---|---|---|---|---|---|---|---|---|---|---|---|---|
| Highland / Islands | Grampian | Tayside | Central | Fife | Edinburgh | Lothians | Glasgow | Dunbartonshire / Argyll & Bute | Renfrewshire / Inverclyde | North Lanarkshire | South Lanarkshire | Ayrshire | Borders / Dumfries & Galloway | Outside Scotland | Not Known | Sample size (=100%) | |
| Journey Destination (Council Area) | Row percentages | ||||||||||||||||
| Highland / Islands | 95 | 1 | 0 | 0 | 0 | 0 | 0 | 0 | 0 | 0 | 0 | 0 | 0 | 0 | 0 | 2 | 23,530 |
| Grampian | 1 | 95 | 1 | 0 | 0 | 0 | 0 | 0 | 0 | 0 | 0 | 0 | 0 | 0 | 0 | 2 | 21,860 |
| Tayside | 0 | 2 | 89 | 1 | 3 | 1 | 0 | 0 | 0 | 0 | 0 | 0 | 0 | 0 | 0 | 2 | 16,190 |
| Central | 0 | 0 | 1 | 84 | 1 | 2 | 2 | 2 | 1 | 0 | 2 | 1 | 0 | 0 | 0 | 2 | 15,860 |
| Fife | 0 | 0 | 4 | 1 | 86 | 3 | 1 | 0 | 0 | 0 | 0 | 0 | 0 | 0 | 0 | 3 | 11,920 |
| Edinburgh | 0 | 0 | 1 | 1 | 2 | 81 | 9 | 1 | 0 | 0 | 0 | 0 | 0 | 1 | 0 | 2 | 19,010 |
| Lothians | 0 | 0 | 0 | 2 | 1 | 16 | 74 | 1 | 0 | 0 | 1 | 1 | 0 | 1 | 0 | 2 | 14,030 |
| Glasgow | 0 | 0 | 0 | 1 | 0 | 1 | 0 | 69 | 6 | 8 | 4 | 5 | 2 | 0 | 0 | 2 | 22,180 |
| Dunbartonshire / Argyll & Bute | 0 | 0 | 0 | 1 | 0 | 0 | 0 | 14 | 75 | 3 | 2 | 1 | 1 | 0 | 0 | 2 | 13,780 |
| Renfrewshire / Inverclyde | 0 | 0 | 0 | 0 | 0 | 0 | 0 | 14 | 2 | 73 | 1 | 2 | 3 | 0 | 0 | 2 | 14,680 |
| North Lanarkshire | 0 | 0 | 0 | 2 | 0 | 1 | 1 | 9 | 2 | 1 | 73 | 8 | 0 | 0 | 0 | 2 | 9,660 |
| South Lanarkshire | 0 | 0 | 0 | 1 | 0 | 1 | 1 | 11 | 1 | 2 | 8 | 70 | 1 | 0 | 0 | 4 | 9,050 |
| Ayrshire | 0 | 0 | 0 | 0 | 0 | 0 | 0 | 3 | 0 | 3 | 0 | 1 | 88 | 1 | 0 | 2 | 14,620 |
| Borders / Dumfries & Galloway | 0 | 0 | 0 | 0 | 0 | 2 | 2 | 0 | 0 | 0 | 0 | 0 | 1 | 90 | 1 | 3 | 10,370 |
| Outside Scotland | 0 | 4 | 4 | 1 | 2 | 6 | 4 | 4 | 5 | 4 | 5 | 4 | 2 | 24 | 25 | 4 | 370 |
| Not Known | 5 | 8 | 8 | 5 | 8 | 10 | 6 | 11 | 5 | 6 | 5 | 10 | 6 | 5 | 0 | 4 | 4,870 |
| All journeys reported | 23500 | 21830 | 16140 | 15810 | 11940 | 18930 | 13990 | 22020 | 13780 | 14660 | 9680 | 9030 | 14590 | 10360 | 520 | 5200 | 221,970 |
** denotes cells with values supressed as they contain fewer than 5 respondents.
This table can be used to establish the percentage of journeys ending in a given council area that originated in that and other council areas.
For example, the percentage of journeys ending in Fife that started in Edinburgh can be found by locating the horizontal row labelled Fife beneath Journey Destination and looking across to the figure appearing in the vertical column labelled Edinburgh. In this case 2% of journeys ending in Fife originated in Edinburgh.
Note: In publications prior to 2011 this table has been orientated the opposite way to the above - with the origin council area forming the rows and the destination council area forming the columns.
| Council area of workplace | |||||||||||||||||
|---|---|---|---|---|---|---|---|---|---|---|---|---|---|---|---|---|---|
| Highlands / Islands | Grampian | Tayside | Central | Fife | Edinburgh | Lothians | Glasgow | Dunbartonshire / Argyll & Bute | Renfrewshire / Inverclyde | North Lanarkshire | South Lanarkshire | Ayrshire | Borders / Dumfries & Galloway | Outside Scotland | Not Known | Sample size (=100%) | |
| Council area of residence | Row percentages | ||||||||||||||||
| Highlands / Islands | 63.8 | 0.8 | 0.2 | . | 0 | 0.2 | . | 0.2 | 0 | 0 | . | . | 0.1 | . | 0.1 | 34.6 | 2,590 |
| Grampian | 0.4 | 81.9 | 0.1 | . | 0 | 0 | 0 | . | 0 | . | . | . | 0 | . | 0 | 17.3 | 2,190 |
| Tayside | 0.1 | 3.3 | 73.7 | 1.1 | 2.3 | 0.8 | 0.1 | 0.6 | . | 0.1 | . | . | . | 0.2 | 0.1 | 17.6 | 1,560 |
| Central | 0 | 0.2 | 0.6 | 52.4 | 1.5 | 5.7 | 3.3 | 2.1 | 1 | 0.2 | 2.3 | 0.4 | . | 0.1 | . | 30.1 | 1,680 |
| Fife | 0 | 0.5 | 5.5 | 0.7 | 54.7 | 7.2 | 1.2 | 0.4 | . | . | 0.3 | 0.1 | . | . | 0.1 | 29.2 | 1,130 |
| Edinburgh | . | 0.2 | 0.3 | 0.7 | 1.4 | 71.4 | 6.3 | 0.8 | 0.1 | 0.1 | 0.3 | 0 | 0 | 0.1 | 0.1 | 18.3 | 1,780 |
| Lothians | 0 | . | 0.2 | 1.5 | 0.4 | 31.5 | 42.7 | 1.2 | . | 0.1 | 0.9 | 0.5 | . | 0.5 | 0 | 20.5 | 1,560 |
| Glasgow | . | 0.1 | 0.2 | 0.4 | 0.2 | 0.6 | 0.4 | 48.2 | 3.5 | 4.4 | 2.1 | 3.2 | 0.6 | 0 | 0 | 36.1 | 1,910 |
| Dunbartonshire / Argyll & Bute | 0.2 | 0.2 | . | 1 | 0.1 | 0.6 | 0 | 20 | 38.8 | 3.7 | 2.1 | 0.7 | 0.6 | . | 0.2 | 31.8 | 1,460 |
| Renfrewshire / Inverclyde | . | 0.3 | . | 0.4 | 0.1 | 0.9 | 0.3 | 20.9 | 2.5 | 38.6 | 1 | 2 | 1.3 | . | 0.2 | 31.3 | 1,580 |
| North Lanarkshire | 0.1 | 0.1 | . | 1.9 | 0.3 | 1.7 | 2.6 | 12.3 | 1.8 | 0.9 | 35.6 | 6.7 | 0.3 | . | 0.1 | 35.6 | 1,000 |
| South Lanarkshire | . | . | . | 0.2 | 0.1 | 1.5 | 1.3 | 15.3 | 0.3 | 2.4 | 7.3 | 31.8 | 0.6 | 0.1 | . | 39 | 1,020 |
| Ayrshire | . | 0.1 | . | 0.1 | 0.2 | 0 | . | 8 | 0.7 | 2.9 | 0.1 | 0.9 | 52.4 | 0.4 | 0.6 | 33.5 | 1,430 |
| Borders / Dumfries & Galloway | . | 0.2 | 0.1 | 0.1 | . | 4 | 1.6 | 0.3 | . | . | 0.2 | 0.2 | 0.6 | 71.4 | 0.7 | 20.7 | 960 |
| Scotland | 3.8 | 10.2 | 6 | 3.6 | 4.1 | 10.8 | 4.3 | 10 | 2.7 | 3.5 | 3.4 | 3 | 3.6 | 3.3 | 0.1 | 27.5 | 21,850 |
** denotes cells with values supressed as they contain fewer than 5 respondents.
This table can be used to establish the percentage of employed adults in a given council area who work in that and other council areas
For example, the percentage of employed adults living in Fife who work in Edinburgh can be found by locating the horizontal row labelled Fife under Council area of residence and looking across to the figure appearing in the vertical column labelled Edinburgh. In this case 8 per cent of those who live in Fife work in Edinburgh.
| Council area of residence | |||||||||||||||
|---|---|---|---|---|---|---|---|---|---|---|---|---|---|---|---|
| Highlands / Islands | Grampian | Tayside | Central | Fife | Edinburgh | Lothians | Glasgow | Dunbartonshire / Argyll & Bute | Renfrewshire / Inverclyde | North Lanarkshire | South Lanarkshire | Ayrshire | Borders / Dumfries & Galloway | Sample size (=100%) | |
| Council area of workplace | Row percentages | ||||||||||||||
| Highlands / Islands | 97.8 | 1.4 | 0.2 | 0.1 | 0.1 | . | 0.1 | . | 0.2 | . | 0.1 | . | . | . | 1,710 |
| Grampian | 0.5 | 95.9 | 2.4 | 0.1 | 0.3 | 0.2 | . | 0.1 | 0.1 | 0.2 | 0.1 | . | 0.1 | 0.1 | 1,880 |
| Tayside | 0.2 | 0.3 | 91.7 | 0.6 | 6.1 | 0.6 | 0.2 | 0.4 | . | . | . | . | . | 0.1 | 1,220 |
| Central | . | . | 2.2 | 84 | 1.4 | 2 | 3 | 1.1 | 1.3 | 0.8 | 3.5 | 0.4 | 0.3 | 0.1 | 1,040 |
| Fife | 0 | 0.1 | 4.1 | 2.1 | 87.7 | 3.5 | 0.7 | 0.5 | 0.2 | 0.2 | 0.5 | 0.1 | 0.3 | . | 680 |
| Edinburgh | 0.1 | 0 | 0.6 | 3 | 4.4 | 66.6 | 20.4 | 0.6 | 0.3 | 0.5 | 1 | 0.8 | 0 | 1.7 | 2,090 |
| Lothians | . | 0.1 | 0.2 | 4.4 | 1.9 | 14.7 | 69.6 | 1.1 | 0 | 0.5 | 3.9 | 1.9 | . | 1.7 | 870 |
| Glasgow | 0.1 | . | 0.4 | 1.2 | 0.3 | 0.8 | 0.8 | 50.7 | 10 | 13 | 8 | 9.5 | 5.1 | 0.1 | 2,020 |
| Dunbartonshire / Argyll & Bute | 0.1 | 0.1 | . | 2.1 | . | 0.3 | . | 13.4 | 71.7 | 5.7 | 4.2 | 0.8 | 1.6 | . | 780 |
| Renfrewshire / Inverclyde | 0 | . | 0.2 | 0.3 | . | 0.3 | 0.1 | 13.4 | 5.3 | 69 | 1.7 | 4.3 | 5.4 | . | 850 |
| North Lanarkshire | . | . | . | 3.9 | 0.7 | 0.8 | 1.8 | 6.5 | 3 | 1.8 | 67.8 | 13.3 | 0.1 | 0.3 | 570 |
| South Lanarkshire | . | . | . | 0.7 | 0.2 | 0.1 | 1.1 | 11.2 | 1.2 | 4.1 | 14.4 | 64.9 | 1.9 | 0.3 | 510 |
| Ayrshire | 0.2 | 0.1 | . | . | . | 0.1 | . | 1.7 | 0.8 | 2.3 | 0.5 | 1 | 92.7 | 0.8 | 830 |
| Borders / Dumfries & Galloway | . | . | 0.5 | 0.2 | . | 0.2 | 1.1 | 0.1 | . | . | . | 0.2 | 0.8 | 96.9 | 700 |
| Outside Scotland | 4.6 | 1.2 | 7 | . | 3.4 | 7.3 | 2 | 1.8 | 8.3 | 10.8 | 3.2 | . | 29 | 21.3 | 30 |
| Not Known | 7.3 | 7.5 | 4.8 | 6.3 | 7 | 6.7 | 5.2 | 13.9 | 5.8 | 7.1 | 8.4 | 8.8 | 7.8 | 3.4 | 6,070 |
| All working repsondents (other than from home) | 5.8 | 11.9 | 7.4 | 5.7 | 6.6 | 10.1 | 7 | 10.6 | 5 | 6.2 | 6.5 | 6.2 | 6.4 | 4.5 | 21,850 |
** denotes cells with values supressed as they contain fewer than 5 respondents.
This table can be used to establish the percentage of employed adults working in a given council area who reside in that or other council areas.
For example, the percentage of employed adults working in Fife who live in Edinburgh can be found by locating the horizontal row labelled Fife beneath Council area of workplace and looking across to the figure appearing in the vertical column labelled Edinburgh. In this case 3 per cent of those who work in Fife live in Edinburgh.
Notes: In publications prior to 2011 this table has been orientated the opposite way to the above - with the council area of residence forming the rows and the council area of workplace forming the columns.
| (if used ordering services the previous day) did this impact on the number of trips you made yesterday? | |||||||||
|---|---|---|---|---|---|---|---|---|---|
| Supermarket home delivery | Internet shopping | Mail order | Ordered goods by phone | Ordered takeaway food delivery | Sample size (=100%) | Yes | No | Sample size (=100%) | |
| percent | |||||||||
| All people: | 0.7 | 8.5 | 1.0 | 0.8 | 3.3 | 6960 | 17.9 | 82.1 | 790 |
| by gender: | |||||||||
| Male | 0.6 | 8.2 | 0.9 | 1.0 | 3.4 | 3220 | 20.0 | 80.0 | 350 |
| Female | 0.7 | 8.8 | 1.0 | 0.5 | 3.3 | 3740 | 15.9 | 84.1 | 430 |
| by age: | |||||||||
| 16-19 | 0.1 | 7.4 | 1.0 | 0.8 | 6.1 | 200 | * | * | 30 |
| 20-29 | 0.7 | 10.4 | 0.5 | 0.4 | 7.0 | 840 | 21.8 | 78.2 | 130 |
| 30-39 | 1.1 | 9.5 | 1.4 | 1.3 | 4.4 | 1050 | 13.6 | 86.4 | 160 |
| 40-49 | 1.2 | 12.5 | 1.8 | 0.7 | 3.3 | 1200 | 20.6 | 79.4 | 180 |
| 50-59 | 0.5 | 8.9 | 1.2 | 0.9 | 2.1 | 1270 | 19.4 | 80.6 | 170 |
| 60-69 | 0.5 | 5.4 | 0.6 | 0.5 | 0.7 | 1240 | 18.2 | 81.8 | 80 |
| 70-79 | 0.1 | 2.4 | 0.1 | 0.8 | 0.2 | 810 | * | * | 30 |
| 80+ | 0.5 | 1.0 | 0.5 | 0.5 | 1.2 | 340 | * | * | 10 |
| by current situation: | |||||||||
| Self employed | 0.9 | 11.8 | 1.4 | 3.8 | 1.9 | 430 | 10.2 | 89.8 | 70 |
| Employed full time | 0.7 | 10.6 | 1.4 | 0.6 | 4.8 | 2660 | 20.8 | 79.2 | 400 |
| Employed part time | 1.1 | 8.8 | 1.0 | 0.3 | 3.5 | 820 | 12.7 | 87.3 | 100 |
| Looking after the home/family | 0.4 | 8.4 | 0.4 | 1.2 | 2.5 | 310 | * | * | 40 |
| Permanently retired from work | 0.4 | 4.1 | 0.5 | 0.5 | 0.4 | 1940 | 19.7 | 80.3 | 90 |
| Unemployed/seeking work | 0.0 | 1.5 | 0.0 | 0.9 | 2.1 | 210 | * | * | 10 |
| In further/higher education | 0.8 | 11.6 | 1.4 | 0.7 | 4.6 | 230 | * | * | 40 |
| Permanently sick or disabled | 0.8 | 3.8 | 0.3 | 0.5 | 5.8 | 230 | * | * | 20 |
| by annual net household income: | |||||||||
| up to £10,000 p.a. | 0.9 | 4.7 | 0.4 | 0.1 | 1.2 | 700 | * | * | 40 |
| over £10,000 - £15,000 | 0.0 | 4.0 | 0.2 | 0.6 | 2.5 | 1140 | 14.5 | 85.5 | 70 |
| over £15,000 - £20,000 | 0.7 | 5.9 | 0.9 | 0.3 | 4.2 | 1050 | 9.6 | 90.4 | 100 |
| over £20,000 - £25,000 | 0.6 | 7.9 | 0.5 | 0.6 | 4.2 | 840 | 11.9 | 88.1 | 100 |
| over £25,000 - £30,000 | 0.4 | 9.7 | 0.5 | 0.9 | 3.4 | 690 | 14.4 | 85.6 | 90 |
| over £30,000 - £40,000 | 1.0 | 8.7 | 1.5 | 1.6 | 3.7 | 1020 | 22.5 | 77.5 | 140 |
| over £40,000 p.a. | 0.8 | 13.7 | 1.7 | 0.8 | 3.3 | 1340 | 20.8 | 79.2 | 230 |
| by Scottish Index of Multiple Deprivation quintiles: | |||||||||
| 1 (20% most deprived) | 0.7 | 5.3 | 0.6 | 0.6 | 4.2 | 1210 | 13.8 | 86.2 | 120 |
| 2' | 0.5 | 7.3 | 0.9 | 0.3 | 2.4 | 1390 | 13.4 | 86.6 | 130 |
| 3' | 1.3 | 10.5 | 1.4 | 0.6 | 4.0 | 1510 | 23.6 | 76.4 | 190 |
| 4' | 0.4 | 8.6 | 1.0 | 1.0 | 3.1 | 1550 | 18.6 | 81.4 | 190 |
| 5 (20% least deprived) | 0.5 | 10.2 | 1.0 | 1.2 | 3.0 | 1300 | 16.7 | 83.3 | 160 |
| by urban/rural classification: | |||||||||
| Large urban areas | 0.5 | 8.6 | 0.9 | 0.7 | 3.8 | 2080 | 16.8 | 83.2 | 250 |
| Other urban | 0.6 | 8.1 | 0.9 | 0.5 | 4.0 | 2390 | 19.2 | 80.8 | 260 |
| Small accessible towns | 1.1 | 7.9 | 1.0 | 1.4 | 3.3 | 650 | 22.2 | 77.8 | 70 |
| Small remote towns | 1.3 | 6.1 | 0.2 | 2.3 | 1.1 | 420 | * | * | 40 |
| Accessible rural | 0.4 | 9.9 | 0.9 | 0.9 | 1.5 | 760 | 17.0 | 83.0 | 80 |
| Remote rural | 1.7 | 9.8 | 3.3 | 0.2 | 1.5 | 660 | 18.2 | 81.8 | 70 |
| by frequency of driving†: | |||||||||
| Every day | 0.6 | 10.4 | 1.4 | 1.1 | 3.1 | 3160 | 16.5 | 83.5 | 430 |
| At least three times a week | 0.5 | 9.6 | 1.2 | 0.4 | 2.9 | 1080 | 24.6 | 75.4 | 120 |
| Once or twice a week | 1.0 | 9.6 | 0.3 | 1.2 | 4.7 | 400 | * | * | 40 |
| Less often | 0.6 | 5.8 | 0.4 | 0.0 | 2.9 | 190 | * | * | 20 |
| Never, but holds full driving licence | 0.8 | 8.9 | 0.2 | 0.4 | 5.2 | 480 | 13.8 | 86.2 | 60 |
| Main Mode of Transport | |||||||||||
|---|---|---|---|---|---|---|---|---|---|---|---|
| Walking | Driver car | Driver van | Passenger car | Passenger van | Bicycle | Bus | Taxi/ minicab | Rail | Other | Sample size | |
| row percentages | |||||||||||
| All | 21.6 | 48.7 | 2 | 12.8 | 0.5 | 1.2 | 9.5 | 1.3 | 1.7 | 0.6 | 18,710 |
| by distance: | |||||||||||
| Under 1 km | 60.0 | 28.1 | 1.5 | 5.5 | 0.3 | 0.6 | 2.7 | 0.6 | 0.2 | 0.5 | 3,850 |
| 1 to under 2km | 43.2 | 35.6 | 1.7 | 9.3 | 0.3 | 1.5 | 5.5 | 2.3 | 0.1 | 0.4 | 2,550 |
| 2 to under 3km | 22.7 | 47.1 | 1.1 | 13.1 | 0.3 | 2.2 | 11.0 | 2.1 | 0.1 | 0.3 | 1,720 |
| 3 to under 5km | 10.3 | 49.8 | 1.2 | 15.6 | 0.1 | 1.7 | 16.3 | 2.3 | 0.8 | 1.7 | 2,310 |
| 5 to under 10km | 3.6 | 57.4 | 2.0 | 15.1 | 0.4 | 1.4 | 15.8 | 1.4 | 2.4 | 0.4 | 2,810 |
| 10 to under 15km | 2.9 | 62.5 | 1.2 | 17.4 | 0.9 | 1.2 | 10.1 | 0.8 | 2.4 | 0.4 | 1,570 |
| 15 to 20km | 0.6 | 63.6 | 3.0 | 17.5 | 0.7 | 0.5 | 9.9 | 1.2 | 2.3 | 0.8 | 910 |
| 20 to 40km | 1.3 | 64.2 | 3.4 | 15.6 | 0.5 | 0.9 | 7.7 | 0.6 | 5.6 | 0.3 | 1,640 |
| 40km and over | 1.1 | 62.4 | 5.5 | 16.3 | 1.6 | 0.5 | 6.9 | 0.3 | 5.0 | 0.6 | 1,120 |
| 2012 2 | 2013 | 2014 | 2015 | |
|---|---|---|---|---|
| column percentages | ||||
| Under 1 km | 24.2 | 16.3 | 17.2 | 19.1 |
| 1 to under 2km | 13.7 | 15.0 | 14.7 | 12.8 |
| 2 to under 3km | 8.8 | 9.6 | 9.6 | 9.8 |
| 3 to under 5km | 12.4 | 13.3 | 13.1 | 13.0 |
| 5 to under 10km | 14.6 | 16.4 | 16.8 | 16.6 |
| 10 to under 15km | 8.4 | 9.4 | 8.7 | 8.4 |
| 15 to 20km | 4.2 | 5.0 | 4.9 | 4.7 |
| 20 to 40km | 8.4 | 8.9 | 9.5 | 9.1 |
| 40km and over | 5.4 | 6.2 | 5.4 | 6.6 |
| Sample size (=100%) | 19,290 | 20,180 | 19,930 | 18,490 |
1 Note that 1km = 0.6 miles
2 The questionnaire was changed in 2012 and as a result more walking journeys are recorded so there is a break in the time series between 2011 and 2012.
| Under 1 km | 1 to under 2km | 2 to under 3km | 3 to under 5km | 5 to under 10km | 10 to under 15km | 15 to 20km | 20 to 40km | 40km and over | Sample size | |
|---|---|---|---|---|---|---|---|---|---|---|
| Row percentages | ||||||||||
| All | 19.1 | 12.8 | 9.8 | 13.0 | 16.6 | 8.4 | 4.7 | 9.1 | 6.6 | 18,490 |
| by mainmode: | ||||||||||
| Walking | 53.1 | 25.6 | 10.3 | 6.2 | 2.7 | 1.1 | 0.1 | 0.5 | 0.3 | 4,110 |
| Driver car | 11.0 | 9.4 | 9.4 | 13.2 | 19.5 | 10.7 | 6.1 | 12.0 | 8.5 | 9,190 |
| Driver van | 14.2 | 10.7 | 5.2 | 7.8 | 16.9 | 4.8 | 7.0 | 15.4 | 18.0 | 370 |
| Passenger car | 8.2 | 9.3 | 10.0 | 15.8 | 19.5 | 11.3 | 6.4 | 11.1 | 8.4 | 2,230 |
| Passenger van | 12.2 | 7.7 | 6.2 | 3.9 | 15.1 | 16.4 | 7.0 | 9.0 | 22.6 | 70 |
| Bicycle | 9.6 | 16.0 | 17.9 | 18.4 | 18.7 | 8.6 | 1.8 | 6.6 | 2.5 | 200 |
| Bus | 5.4 | 7.5 | 11.3 | 22.2 | 27.6 | 8.9 | 4.9 | 7.4 | 4.8 | 1,710 |
| Taxi/minicab | 8.7 | 22.3 | 15.4 | 21.8 | 17.3 | 4.9 | 4.2 | 3.8 | 1.5 | 250 |
| Rail | 2.4 | 0.9 | 0.7 | 6.2 | 23.3 | 11.9 | 6.2 | 29.4 | 19.1 | 270 |
| Other | 15.1 | 8.5 | 4.8 | 37.9 | 10.1 | 5.7 | 6.4 | 4.9 | 6.6 | 100 |
| 2012 2 | 2013 | 2014 | 2015 | |
|---|---|---|---|---|
| Kilometres | ||||
| Lower Decile | 0.2 | 0.7 | 0.6 | 0.4 |
| Lower Quartile | 1.0 | 1.5 | 1.5 | 1.4 |
| Median | 3.4 | 4.2 | 4.2 | 4.1 |
| Upper Quartile | 10.7 | 11.9 | 11.8 | 12.1 |
| Upper Decile | 26.1 | 27.6 | 26.9 | 29.0 |
| Mean | 10.5 | 11.6 | 11.4 | 16.7 |
| Sample size | 19,290 | 20,180 | 19,930 | 18,490 |
1 Note that 1km = 0.6 miles
2 The questionnaire was changed in 2012 and as a result more walking journeys are recorded so there is a break in the time series between 2011 and 2012.
| Main Mode of Transport | |||||||||||
|---|---|---|---|---|---|---|---|---|---|---|---|
| Walking | Driver car | Driver van | Passenger car | Passenger van | Bicycle | Bus | Taxi/ minicab | Rail | Other | All modes | |
| Kilometres | |||||||||||
| Lower Decile | 0.0 | 0.9 | 0.7 | 1.2 | 0.0 | 1.0 | 1.7 | 1.1 | 4.9 | 0.2 | 0.4 |
| Lower Quartile | 0.4 | 2.5 | 2.0 | 2.7 | 2.5 | 1.9 | 3.0 | 1.7 | 7.7 | 2.6 | 1.4 |
| Median | 0.9 | 6.3 | 8.2 | 6.4 | 11.4 | 3.4 | 5.4 | 3.1 | 18.6 | 4.0 | 4.1 |
| Upper Quartile | 1.7 | 16.0 | 30.1 | 15.6 | 37.6 | 6.9 | 10.8 | 7.1 | 35.7 | 6.3 | 12.1 |
| Upper Decile | 3.2 | 34.9 | 50.9 | 35.1 | 72.3 | 18.2 | 22.6 | 12.6 | 54.2 | 20.9 | 29.0 |
| Mean | 1.5 | 20.6 | 22.4 | 21.6 | 27.1 | 13.9 | 18.8 | 6.1 | 38.0 | 59.2 | 16.7 |
| Sample size | 4,110 | 9,190 | 370 | 2,230 | 70 | 200 | 1,710 | 250 | 270 | 100 | 18,490 |
| Sub-sample size (=100%) | Estimate | |||||||||
|---|---|---|---|---|---|---|---|---|---|---|
| 5% or 95% |
10% or 90% |
15% or 85% |
20% or 80% |
25% or 75% |
30% or 70% |
35% or 65% |
40% or 60% |
45% or 55% |
50% | |
| percentage points (+/-) | ||||||||||
| 100 | 5.0 | 6.8 | 8.1 | 9.1 | 9.8 | 10.4 | 10.8 | 11.1 | 11.3 | 11.4 |
| 200 | 3.5 | 4.8 | 5.7 | 6.4 | 7.0 | 7.4 | 7.7 | 7.9 | 8.0 | 8.0 |
| 300 | 2.9 | 3.9 | 4.7 | 5.3 | 5.7 | 6.0 | 6.3 | 6.4 | 6.5 | 6.6 |
| 400 | 2.5 | 3.4 | 4.1 | 4.5 | 4.9 | 5.2 | 5.4 | 5.6 | 5.7 | 5.7 |
| 500 | 2.2 | 3.1 | 3.6 | 4.1 | 4.4 | 4.7 | 4.8 | 5.0 | 5.1 | 5.1 |
| 600 | 2.0 | 2.8 | 3.3 | 3.7 | 4.0 | 4.3 | 4.4 | 4.5 | 4.6 | 4.6 |
| 700 | 1.9 | 2.6 | 3.1 | 3.4 | 3.7 | 3.9 | 4.1 | 4.2 | 4.3 | 4.3 |
| 800 | 1.8 | 2.4 | 2.9 | 3.2 | 3.5 | 3.7 | 3.8 | 3.9 | 4.0 | 4.0 |
| 900 | 1.7 | 2.3 | 2.7 | 3.0 | 3.3 | 3.5 | 3.6 | 3.7 | 3.8 | 3.8 |
| 1,000 | 1.6 | 2.2 | 2.6 | 2.9 | 3.1 | 3.3 | 3.4 | 3.5 | 3.6 | 3.6 |
| 1,200 | 1.4 | 2.0 | 2.3 | 2.6 | 2.8 | 3.0 | 3.1 | 3.2 | 3.3 | 3.3 |
| 1,400 | 1.3 | 1.8 | 2.2 | 2.4 | 2.6 | 2.8 | 2.9 | 3.0 | 3.0 | 3.0 |
| 1,600 | 1.2 | 1.7 | 2.0 | 2.3 | 2.5 | 2.6 | 2.7 | 2.8 | 2.8 | 2.8 |
| 1,800 | 1.2 | 1.6 | 1.9 | 2.1 | 2.3 | 2.5 | 2.6 | 2.6 | 2.7 | 2.7 |
| 2,000 | 1.1 | 1.5 | 1.8 | 2.0 | 2.2 | 2.3 | 2.4 | 2.5 | 2.5 | 2.5 |
| 2,500 | 1.0 | 1.4 | 1.6 | 1.8 | 2.0 | 2.1 | 2.2 | 2.2 | 2.3 | 2.3 |
| 3,000 | 0.9 | 1.2 | 1.5 | 1.7 | 1.8 | 1.9 | 2.0 | 2.0 | 2.1 | 2.1 |
| 3,500 | 0.8 | 1.2 | 1.4 | 1.5 | 1.7 | 1.8 | 1.8 | 1.9 | 1.9 | 1.9 |
| 4,000 | 0.8 | 1.1 | 1.3 | 1.4 | 1.6 | 1.6 | 1.7 | 1.8 | 1.8 | 1.8 |
| 5,000 | 0.7 | 1.0 | 1.1 | 1.3 | 1.4 | 1.5 | 1.5 | 1.6 | 1.6 | 1.6 |
| 6,000 | 0.6 | 0.9 | 1.0 | 1.2 | 1.3 | 1.3 | 1.4 | 1.4 | 1.5 | 1.5 |
| 7,000 | 0.6 | 0.8 | 1.0 | 1.1 | 1.2 | 1.2 | 1.3 | 1.3 | 1.4 | 1.4 |
| 8,000 | 0.6 | 0.8 | 0.9 | 1.0 | 1.1 | 1.2 | 1.2 | 1.2 | 1.3 | 1.3 |
| 9,000 | 0.5 | 0.7 | 0.9 | 1.0 | 1.0 | 1.1 | 1.1 | 1.2 | 1.2 | 1.2 |
| 10,000 | 0.5 | 0.7 | 0.8 | 0.9 | 1.0 | 1.0 | 1.1 | 1.1 | 1.1 | 1.1 |
| 12,000 | 0.5 | 0.6 | 0.7 | 0.8 | 0.9 | 1.0 | 1.0 | 1.0 | 1.0 | 1.0 |
| 14,000 | 0.4 | 0.6 | 0.7 | 0.8 | 0.8 | 0.9 | 0.9 | 0.9 | 1.0 | 1.0 |
| 16,000 | 0.4 | 0.5 | 0.6 | 0.7 | 0.8 | 0.8 | 0.9 | 0.9 | 0.9 | 0.9 |
| 18,000 | 0.4 | 0.5 | 0.6 | 0.7 | 0.7 | 0.8 | 0.8 | 0.8 | 0.8 | 0.8 |
| 20,000 | 0.4 | 0.5 | 0.6 | 0.6 | 0.7 | 0.7 | 0.8 | 0.8 | 0.8 | 0.8 |
| 25,000 | 0.3 | 0.4 | 0.5 | 0.6 | 0.6 | 0.7 | 0.7 | 0.7 | 0.7 | 0.7 |
| 30,000 | 0.3 | 0.4 | 0.5 | 0.5 | 0.6 | 0.6 | 0.6 | 0.6 | 0.7 | 0.7 |
| 35,000 | 0.3 | 0.4 | 0.4 | 0.5 | 0.5 | 0.6 | 0.6 | 0.6 | 0.6 | 0.6 |
| 40,000 | 0.2 | 0.3 | 0.4 | 0.5 | 0.5 | 0.5 | 0.5 | 0.6 | 0.6 | 0.6 |
| 45,000 | 0.2 | 0.3 | 0.4 | 0.4 | 0.5 | 0.5 | 0.5 | 0.5 | 0.5 | 0.5 |
| 50,000 | 0.2 | 0.3 | 0.4 | 0.4 | 0.4 | 0.5 | 0.5 | 0.5 | 0.5 | 0.5 |
e.g. an estimate of 55% that is based on a sample of 800 has 95% confidence limits of 55% ± 4.1% points
2013 Design factor = 1.16
Formula used is CI = 1.16 x 1.96 x SQRT((% x (1-%)) / n )