Personal Travel
How much are people travelling?
In 2022, 61% of people had travelled the day before their survey interview. This is well below the 2019 figure of 74%, and the lowest figure recorded since the current version of the travel diary was introduced in 2012 [Table TD1].
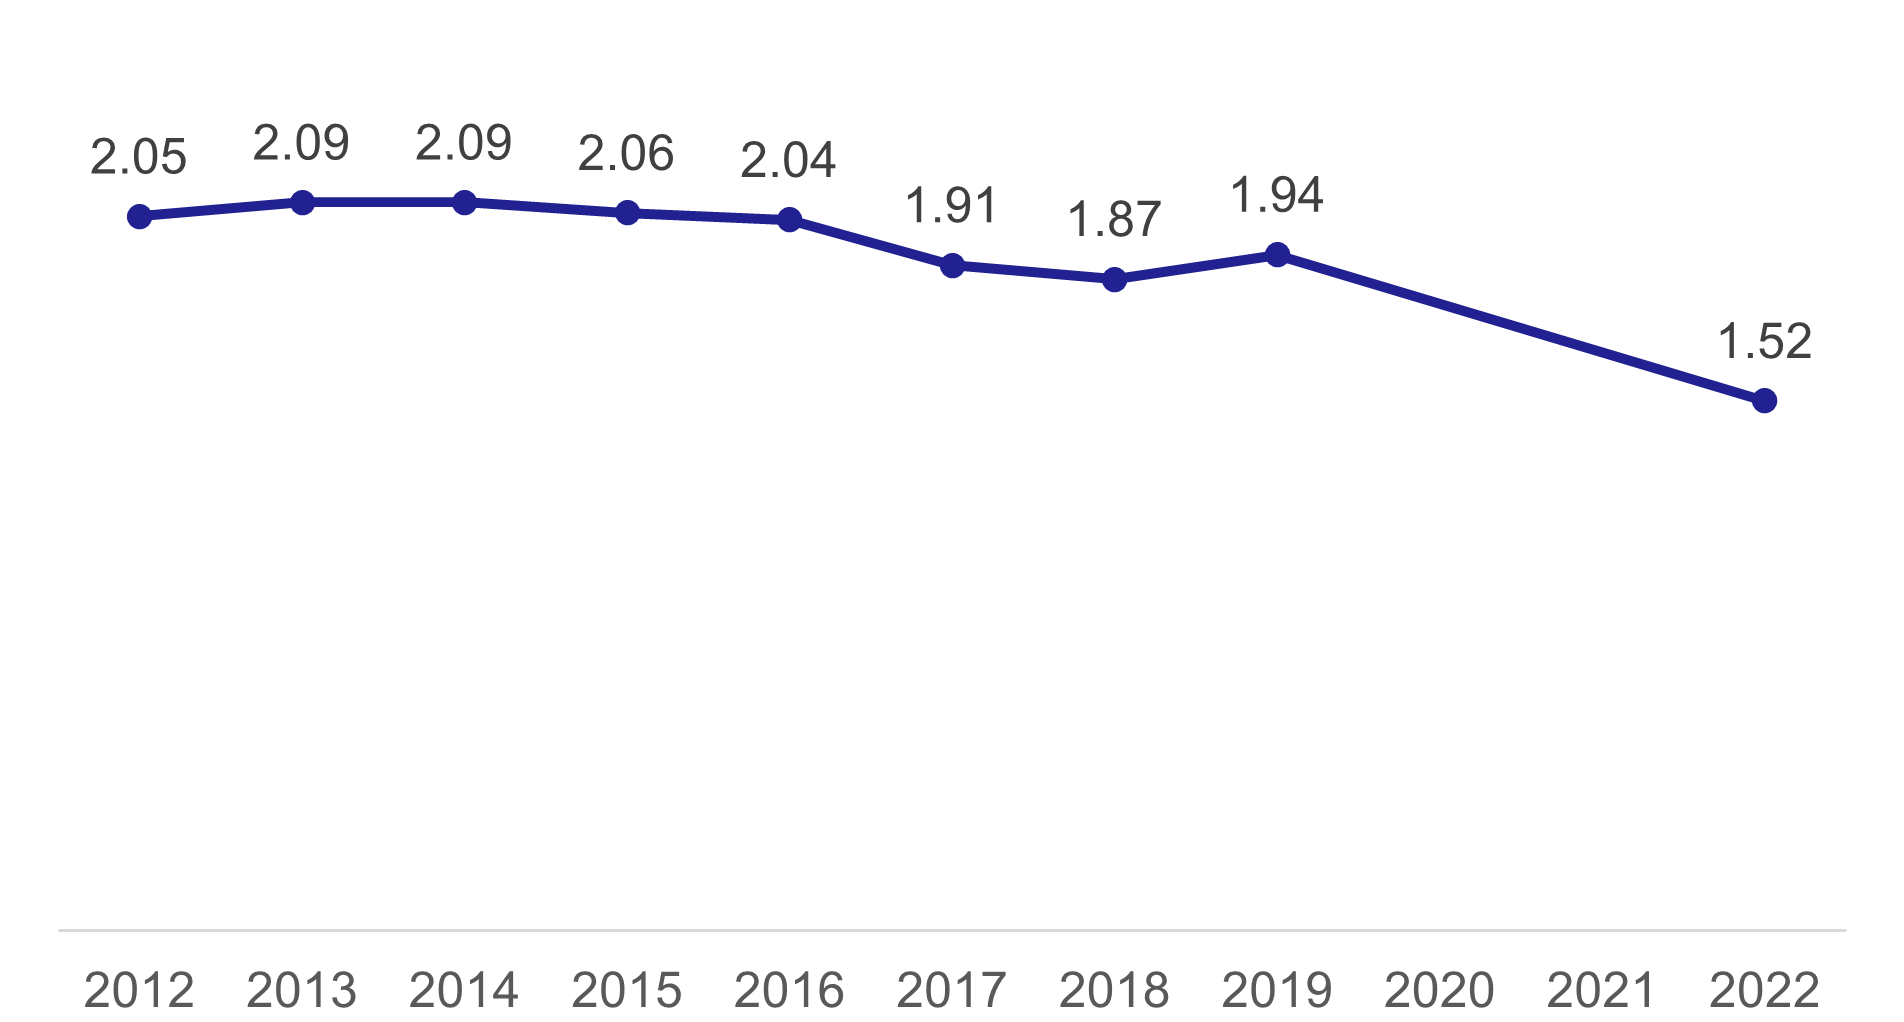
The number of trips per adult the day before their survey interview was 1.52 in 2022. This is lower than the 2019 figure of 1.94, and for any year from 2012 to 2019. [Table TD2e, TD3a, Figure 1].
Who travels?
The reduction in travel between 2019 and 2022 has been seen across the population, with decreases seen for males and females, all age groups, and all geographic sub-groups. [Table TD1]
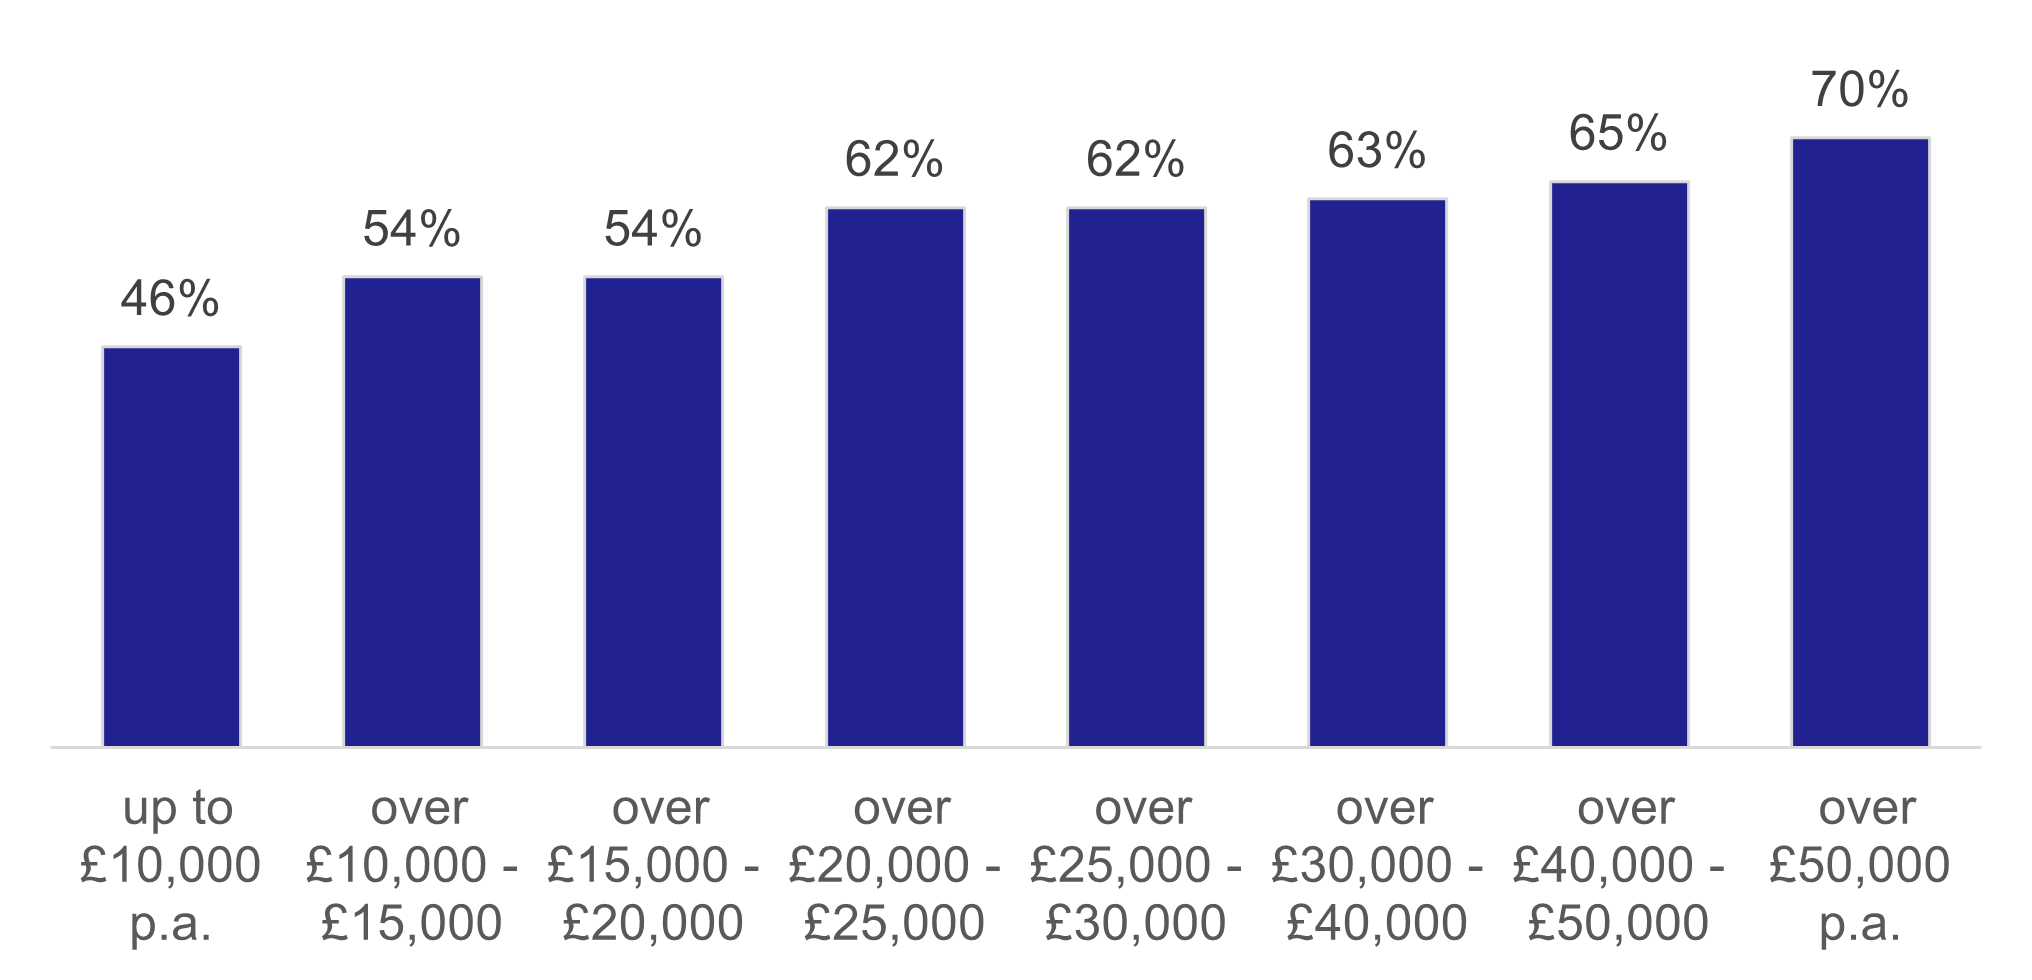
The percentage travelling increased with income, with 46% of those with a household income below £10,000 travelling compared to 70% of those with an income above £50,000. [Table TD1 and Figure 2]
How do people travel?
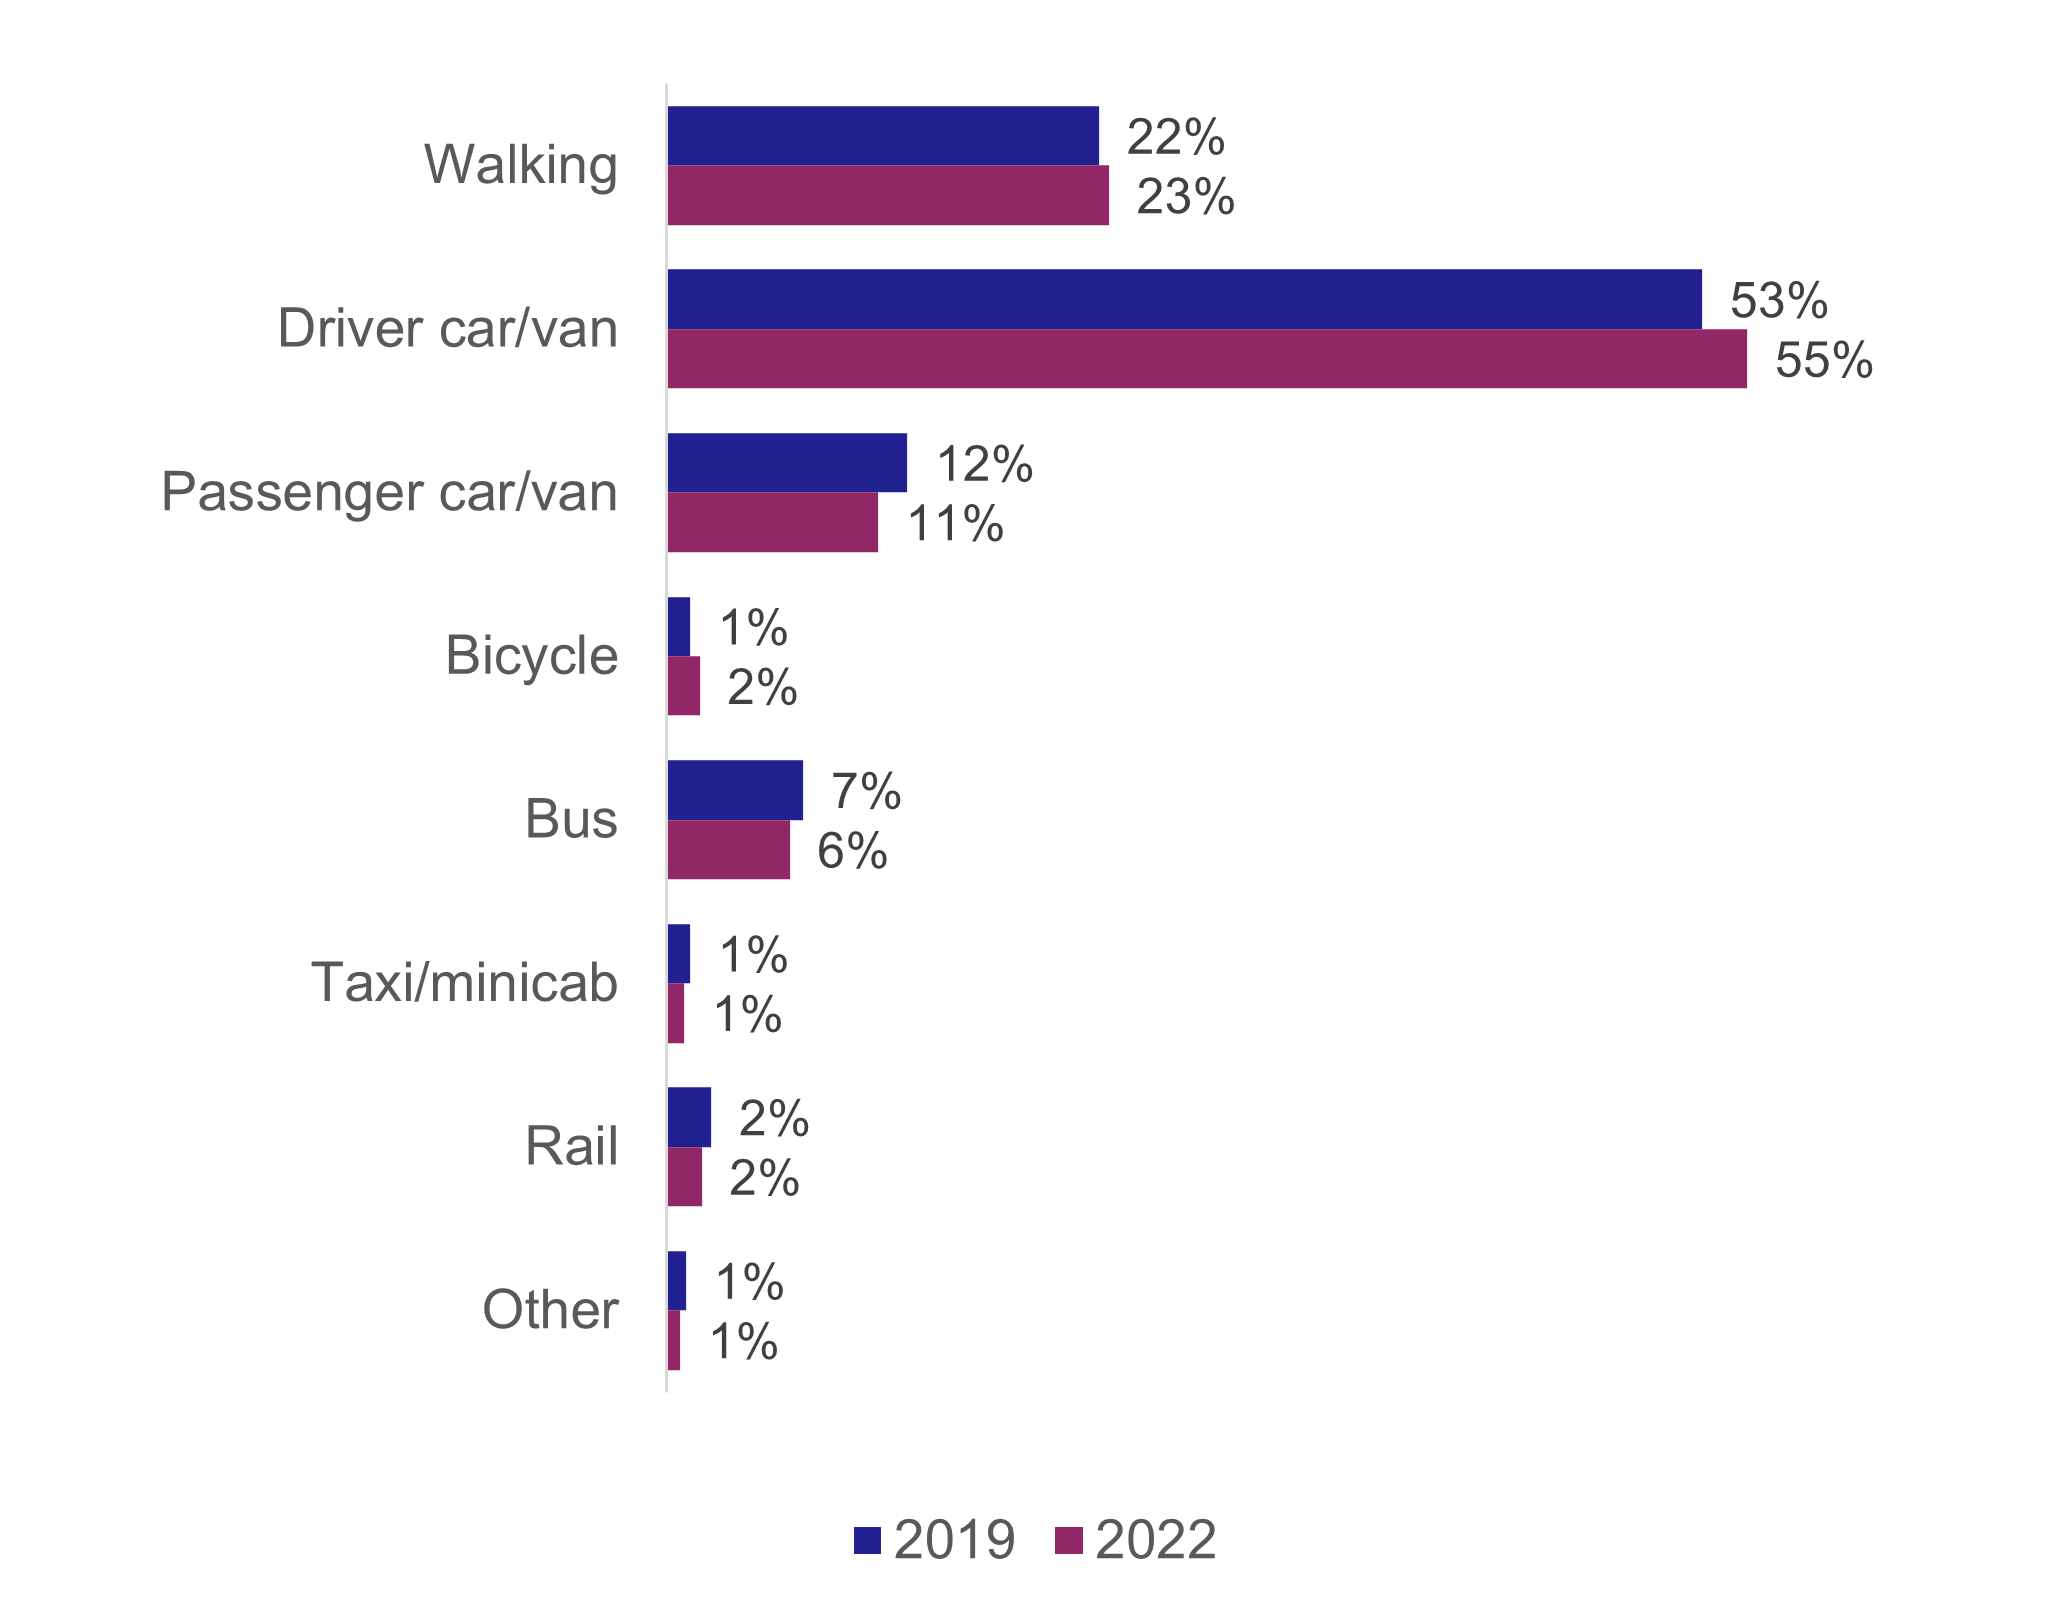
When people did travel, the share of journeys made by each mode in 2022 was broadly similar to 2019.
Driving a car or van was the most common mode of transport, accounting for 55% of journeys. Walking was the next most popular mode of transport (23% of journeys). 11% of journeys were as car or van passenger, 6% by bus and 2% by rail. [Table TD2, Table SUM1, and Figure 3]
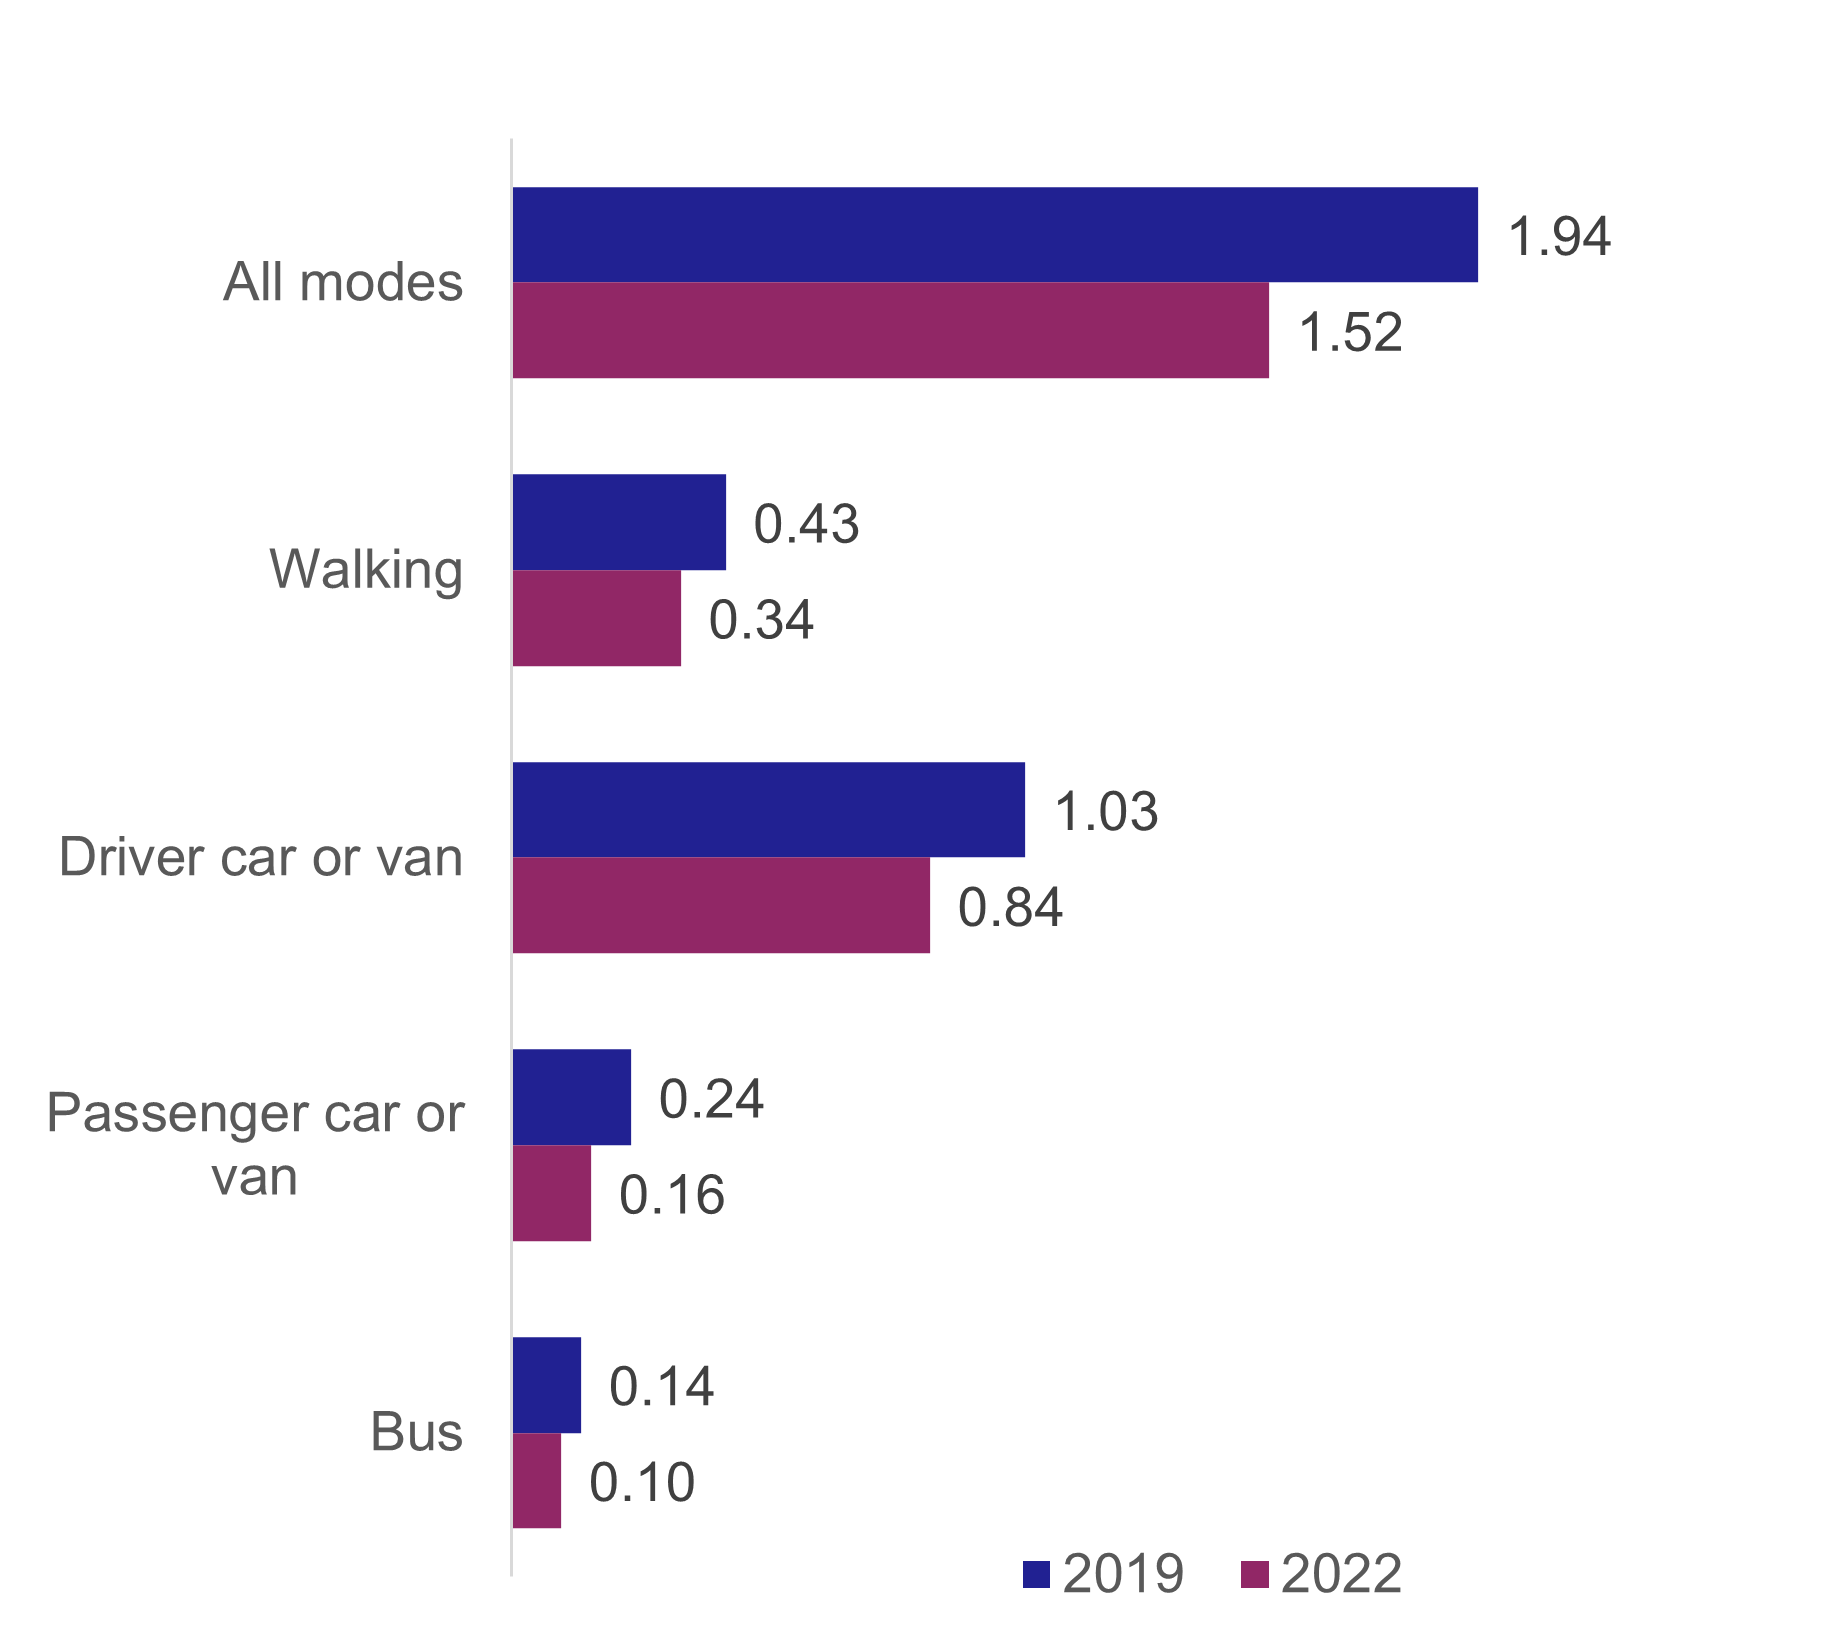
Given the overall drop in the number of journeys in 2022, most major modes saw a drop in the number of journeys in 2019. For example, although the percentage of journeys by car increased slightly between 2019 and 2022, the number of journeys per person by car in the day before the interview fell from 1.03 to 0.84 per person. Similarly, the number of journeys by walking fell from 0.43 to 0.34, and by bus from 0.14 to 0.10. [Table TD2e]
Why do people travel?
When people did travel, the share of journeys made for each purpose in 2022 was broadly similar to 2019.
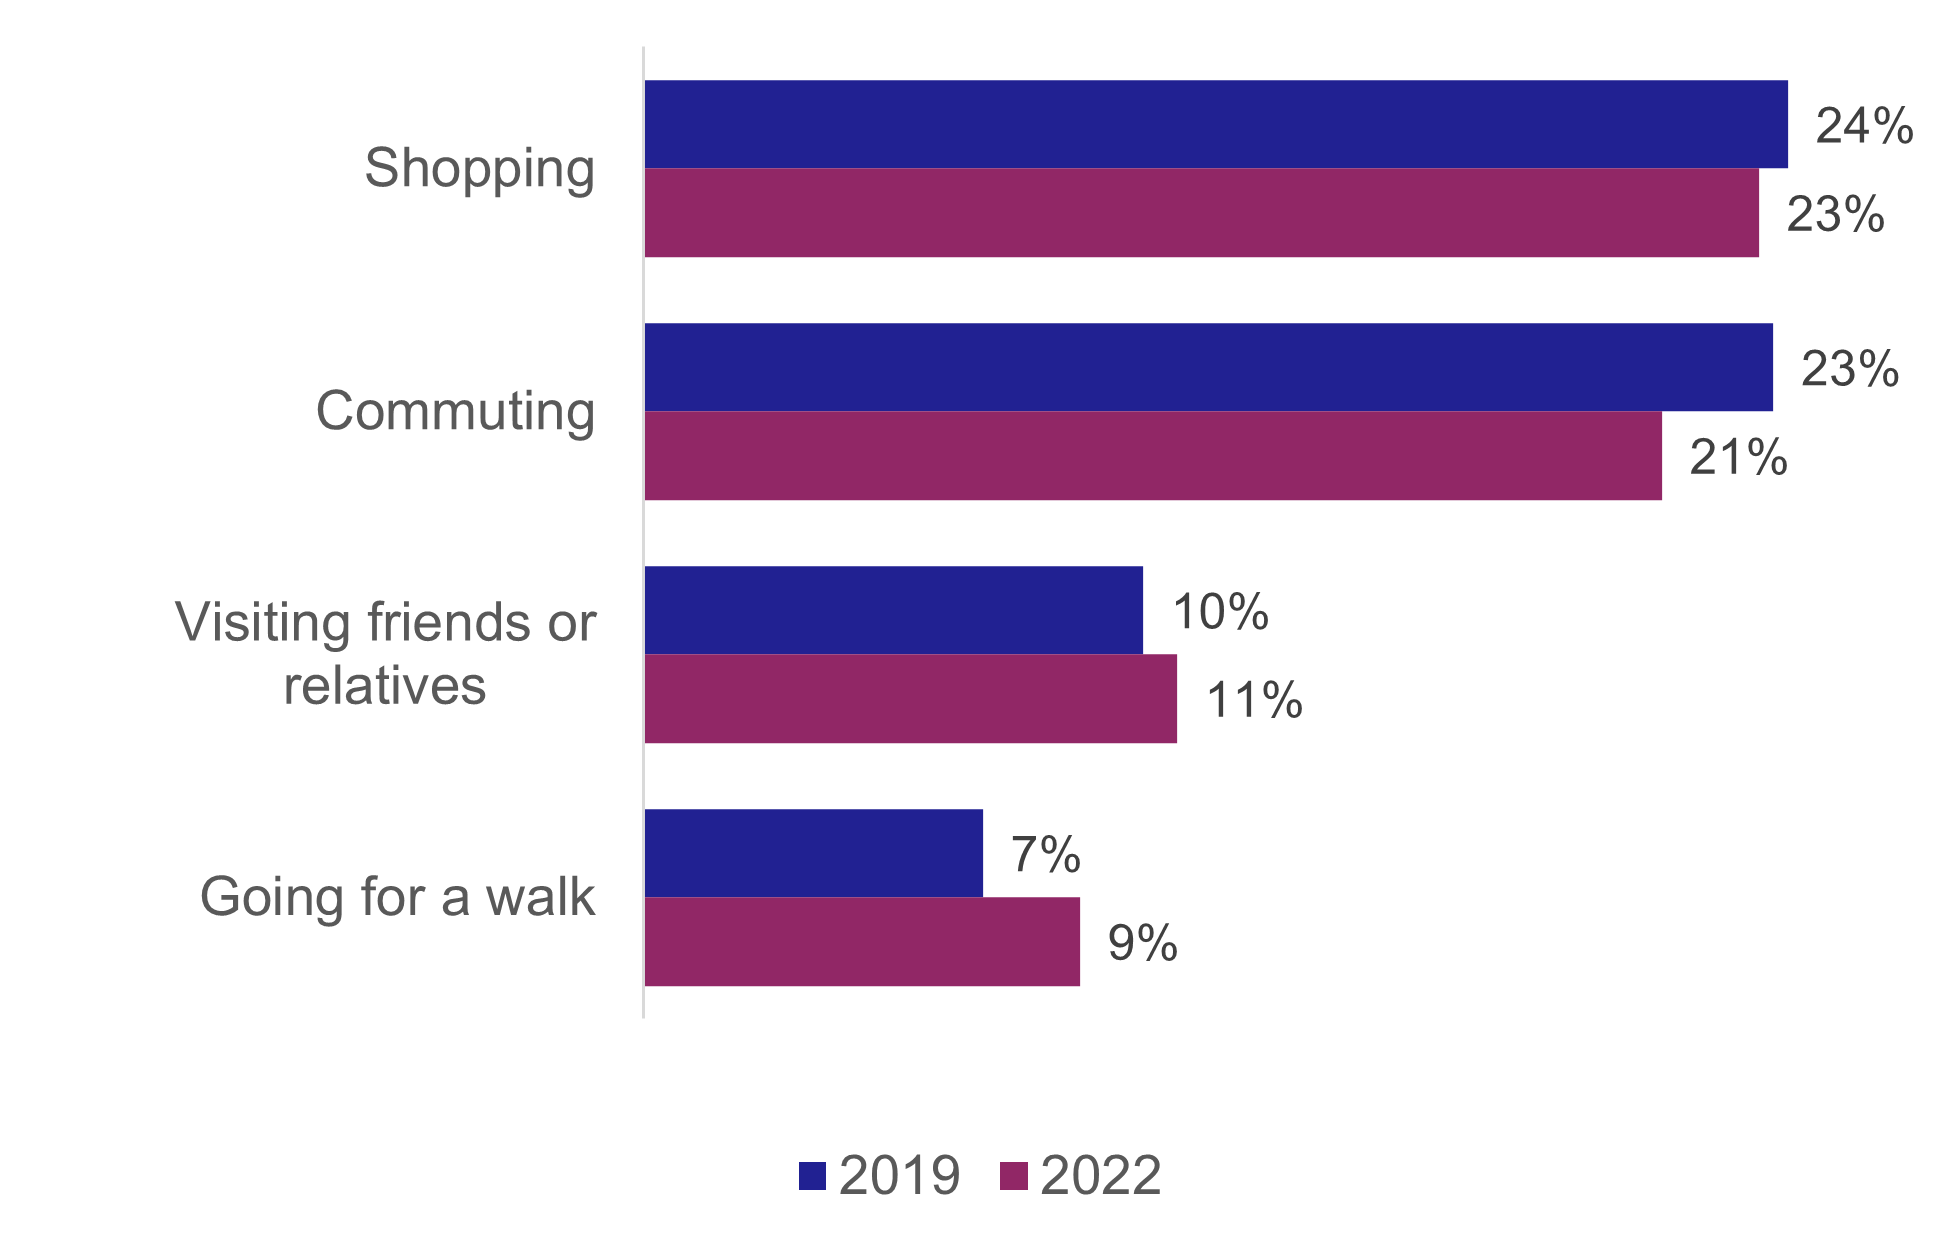
Shopping was the most frequent reason for travel (23% of journeys). Commuting was the next most common at 21% of journeys [Table TD3 and Figure 5].
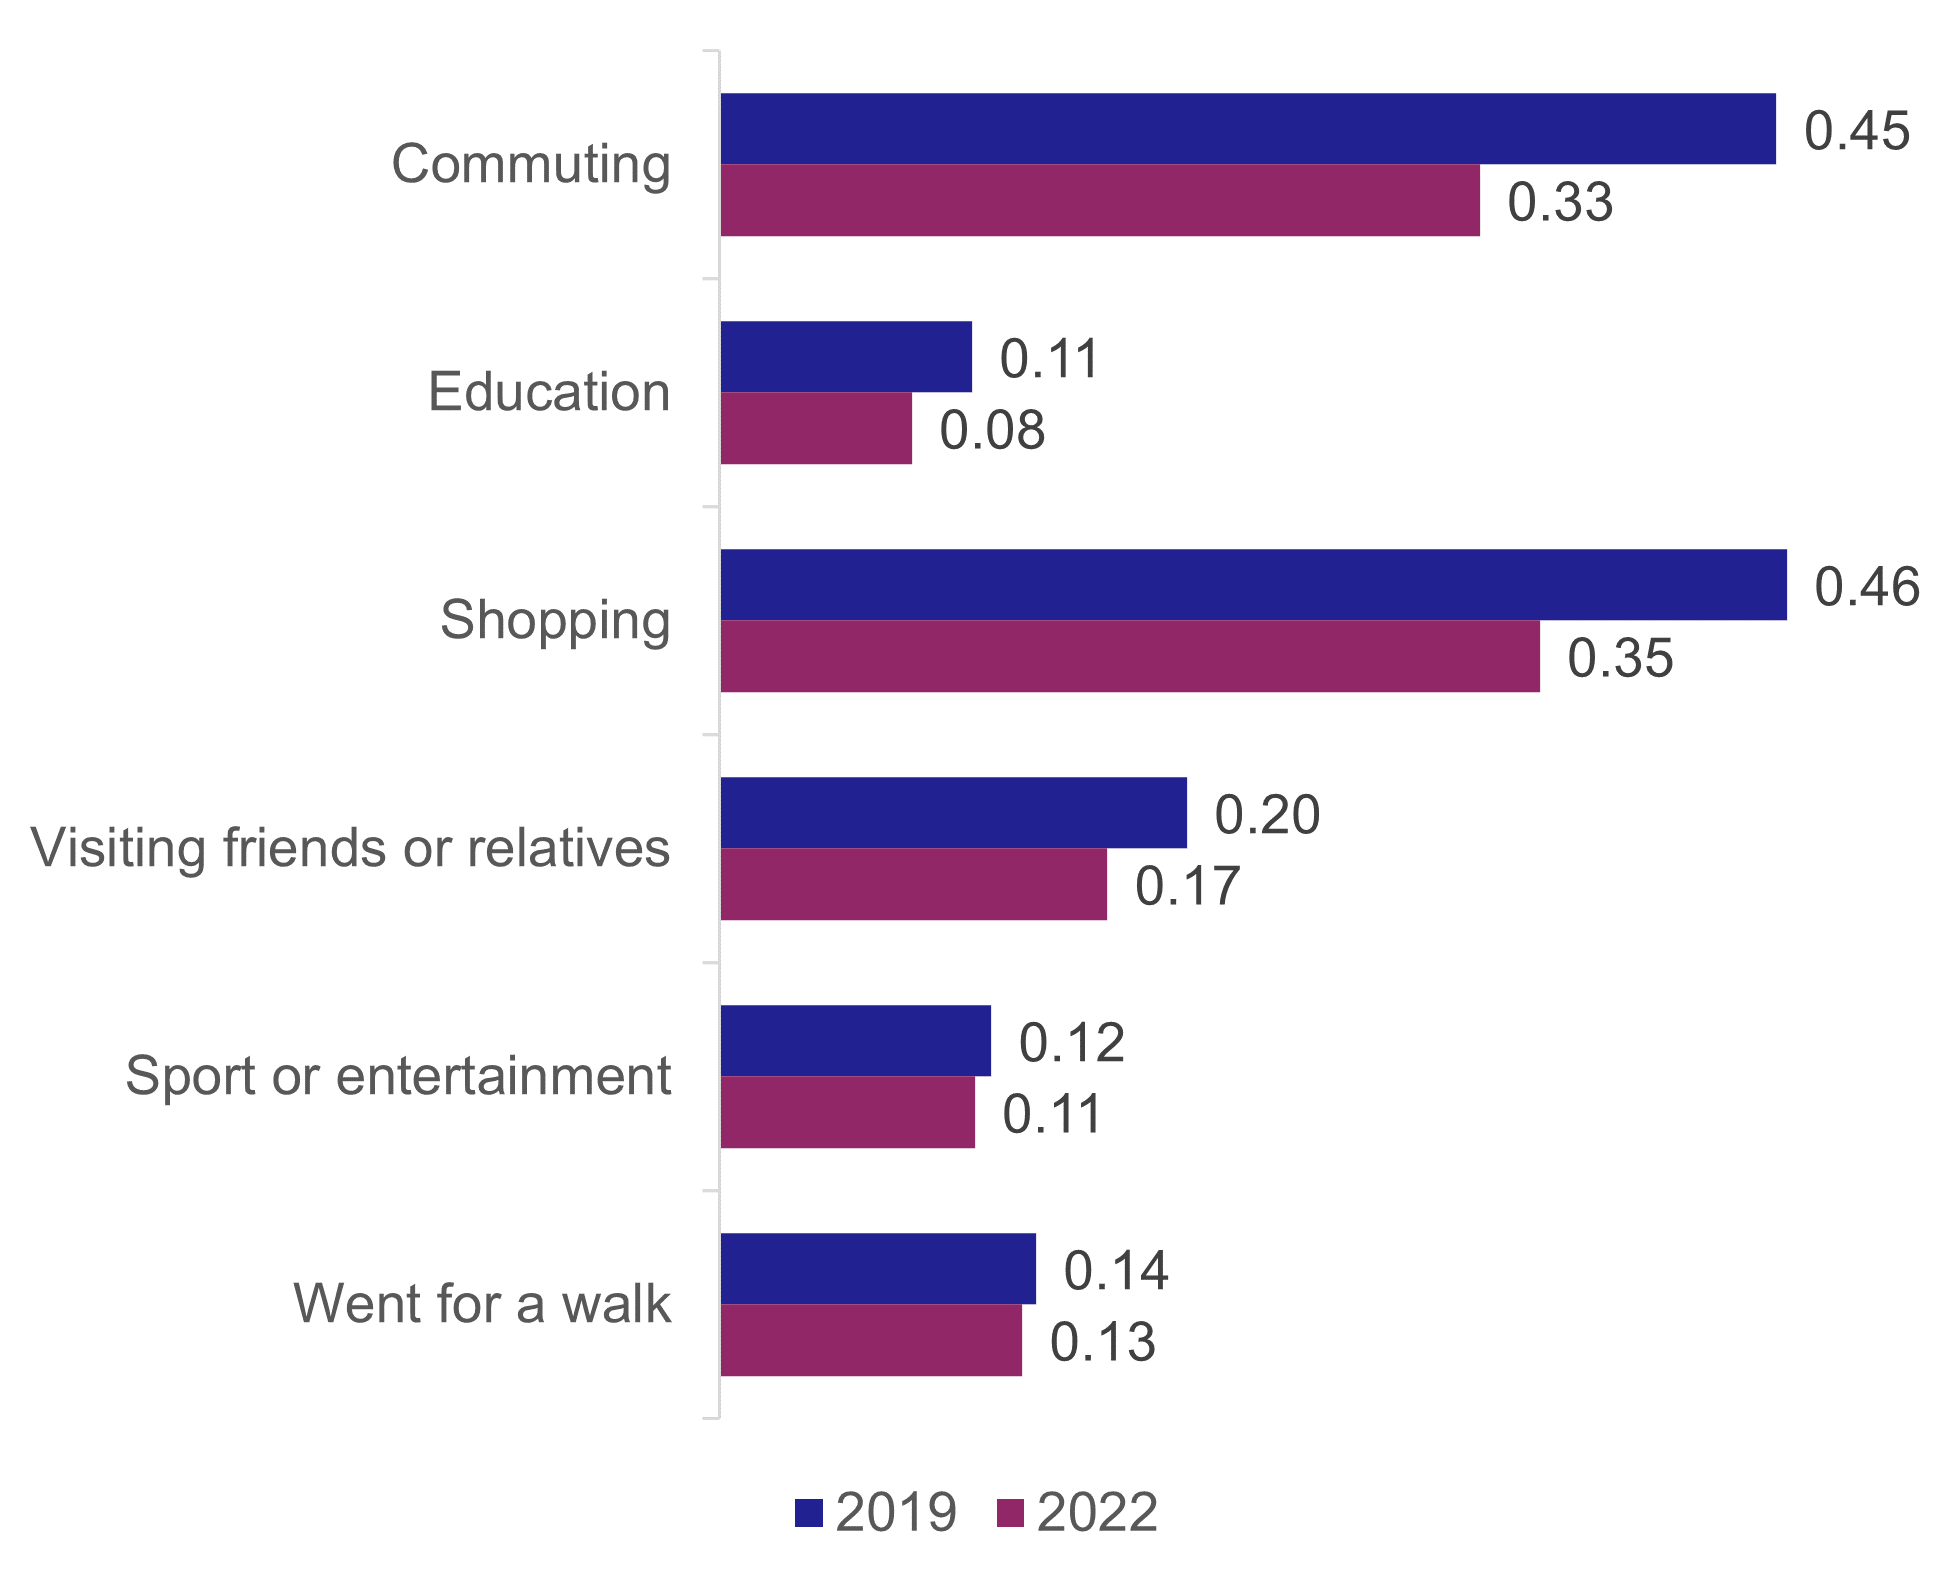
Due to the overall decrease in travel, there was a drop in the number of journeys made for most purposes in 2022. Shopping and commuting showed substantial falls between 2019 and 2022. Commuting trips per adult per day were down from 0.45 to 0.33 and Shopping trips fell from 0.46 to 0.35. [Table TD3a and Figure 6]
Travel to Work
Working from home
The proportion of people who reported working from home saw a significant increase between 2019 and 2022, and the proportion of people travelling to work 5 days a week dropped markedly.
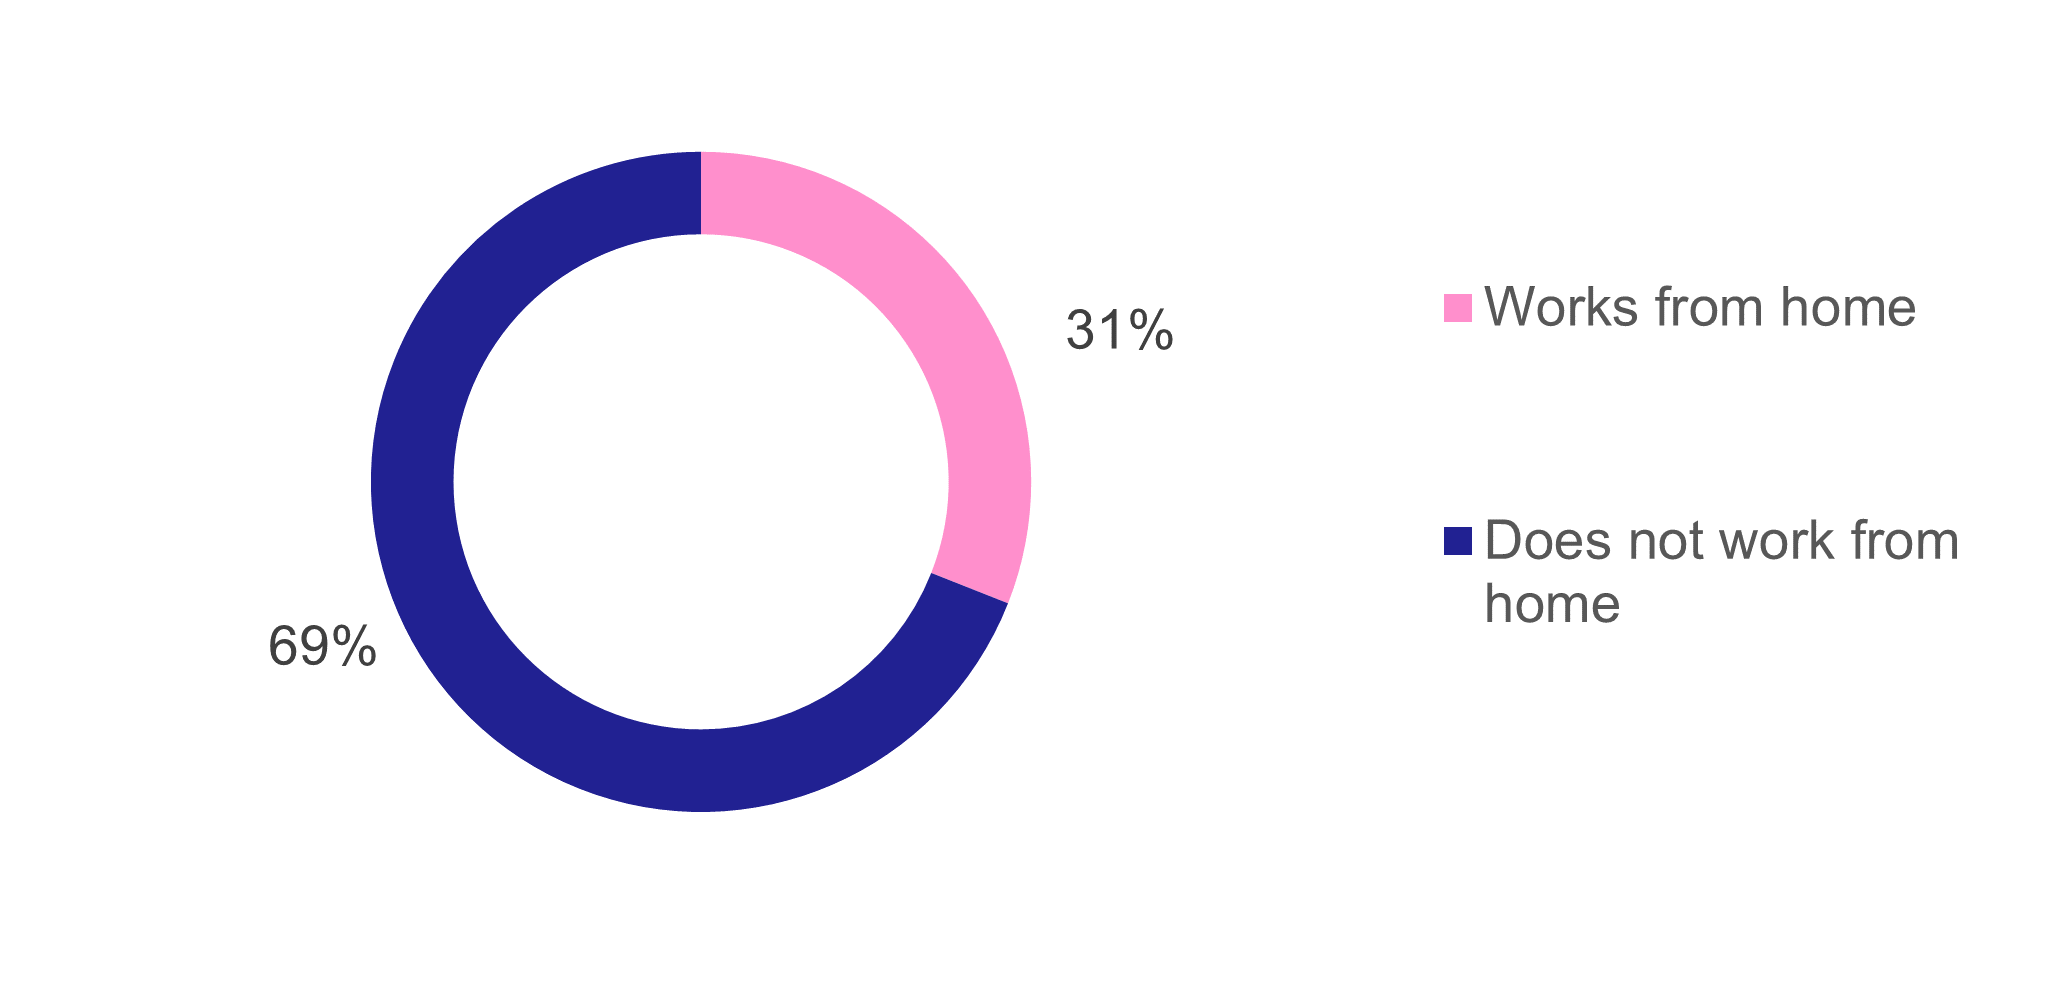
31% of employed people described themselves as working from home in 2022. This was almost double the 2019 figure of 16%. [Table 7a and Figure 7]
Figure 7: Percentage of employed people working from home, 2022
27% of those who earnt up to £20,000 worked from home, compared to 36% of those with incomes above £50,000. [Table 7a]
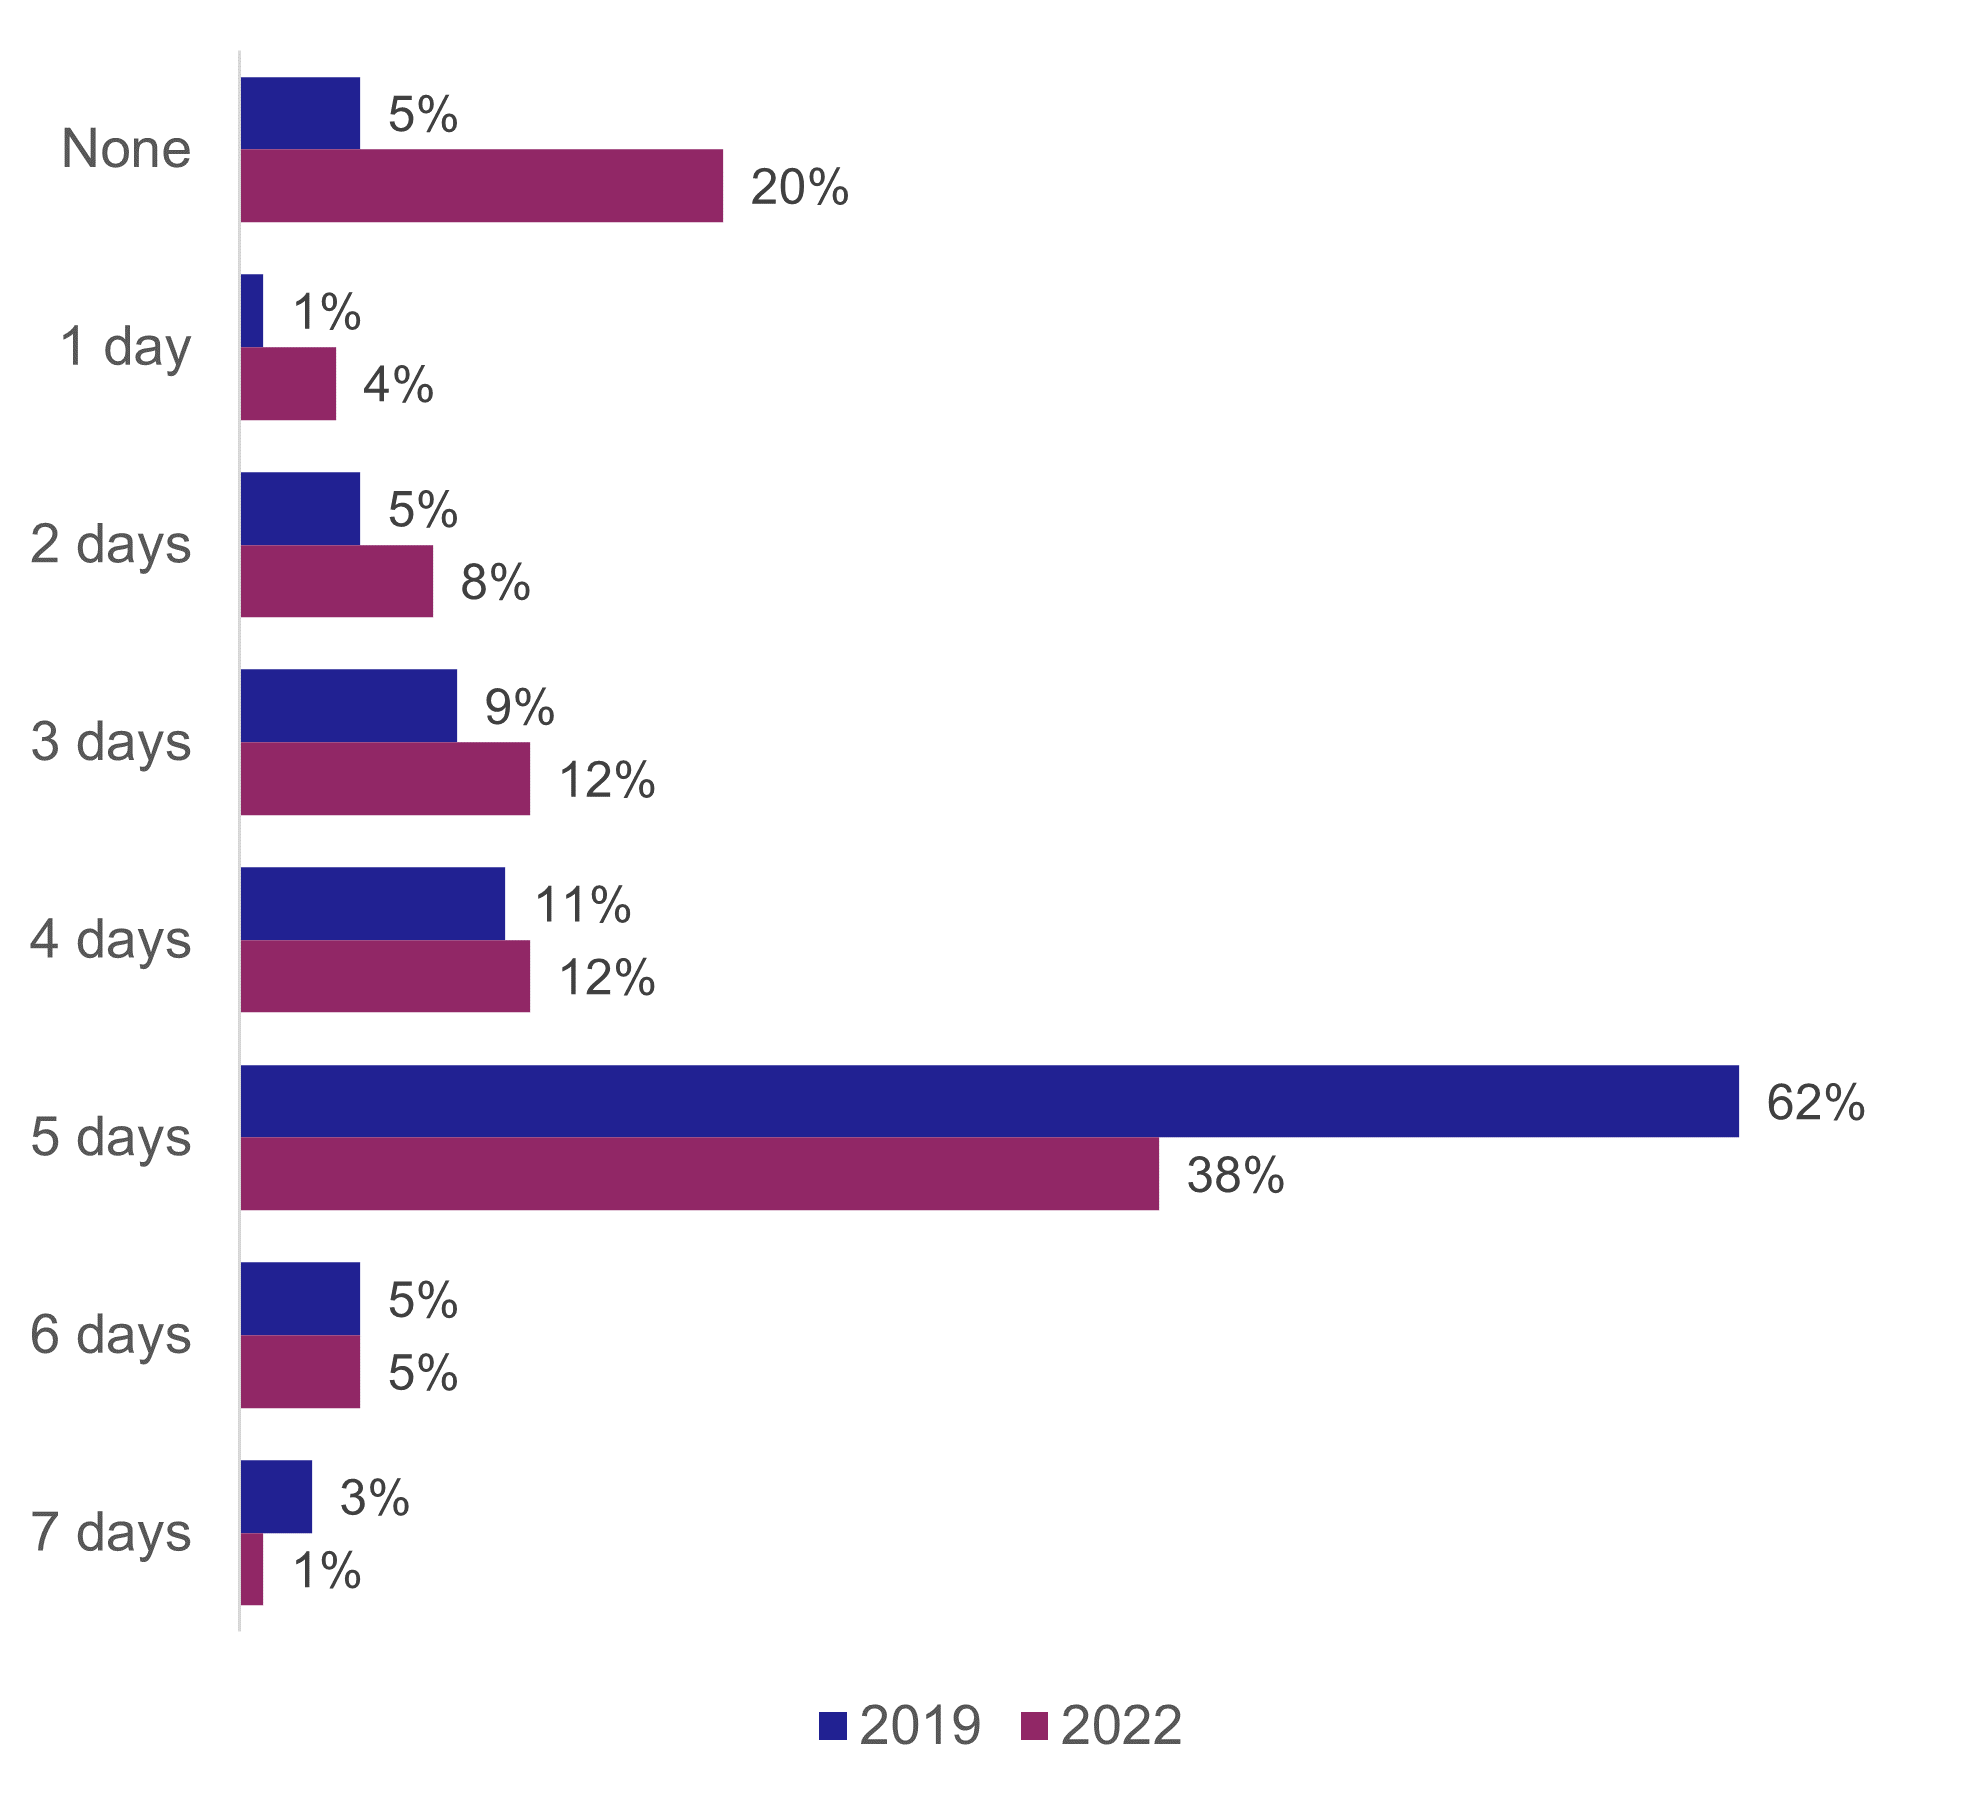
When asked specifically how many days a week they travelled to work, 20% said ‘none’, a notable rise from 5% in 2019. The proportion of people who reported travelling to work 5 days a week dropped from 62% in 2019 to 38% in 2022. [Table 56 and Figure 8]
How do people travel to work?
People’s choice of transport mode for travel to work was broadly similar in 2022 to 2019.
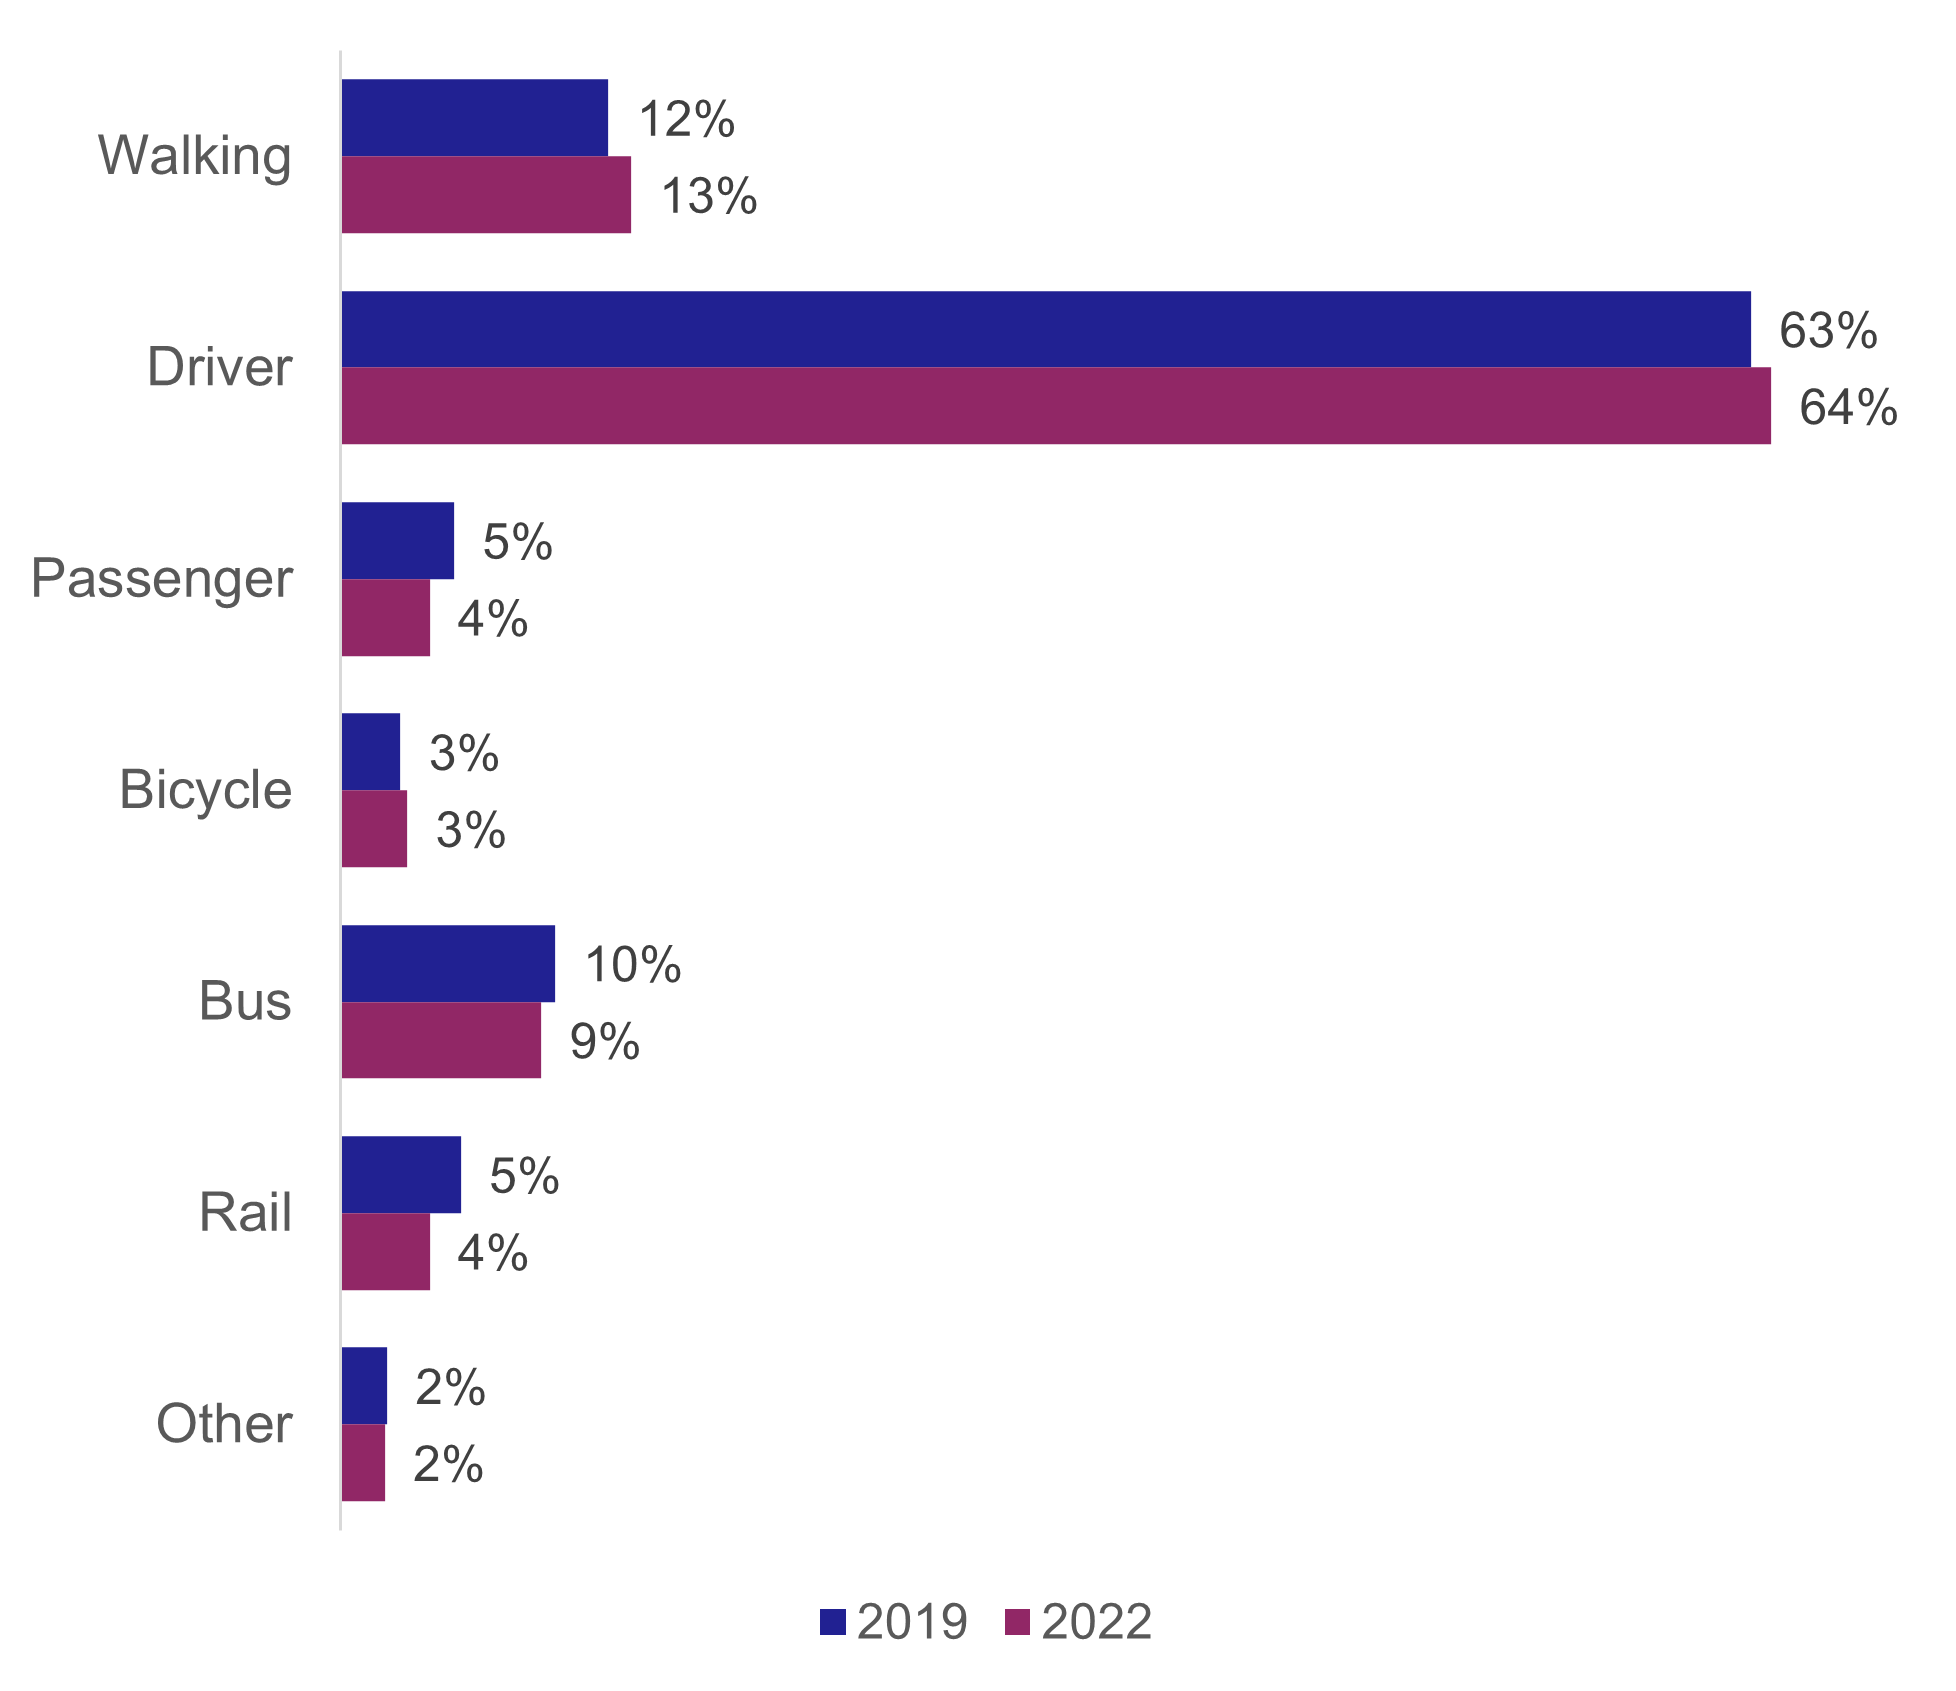
Amongst those who travelled to work, 68% of people usually travelled by car or van, usually as a driver (64%). 13% of people usually walked to work, while 9% usually took the bus. [Table Sum 1, Table 7 and Figure 9]
Who travels to work by which mode?
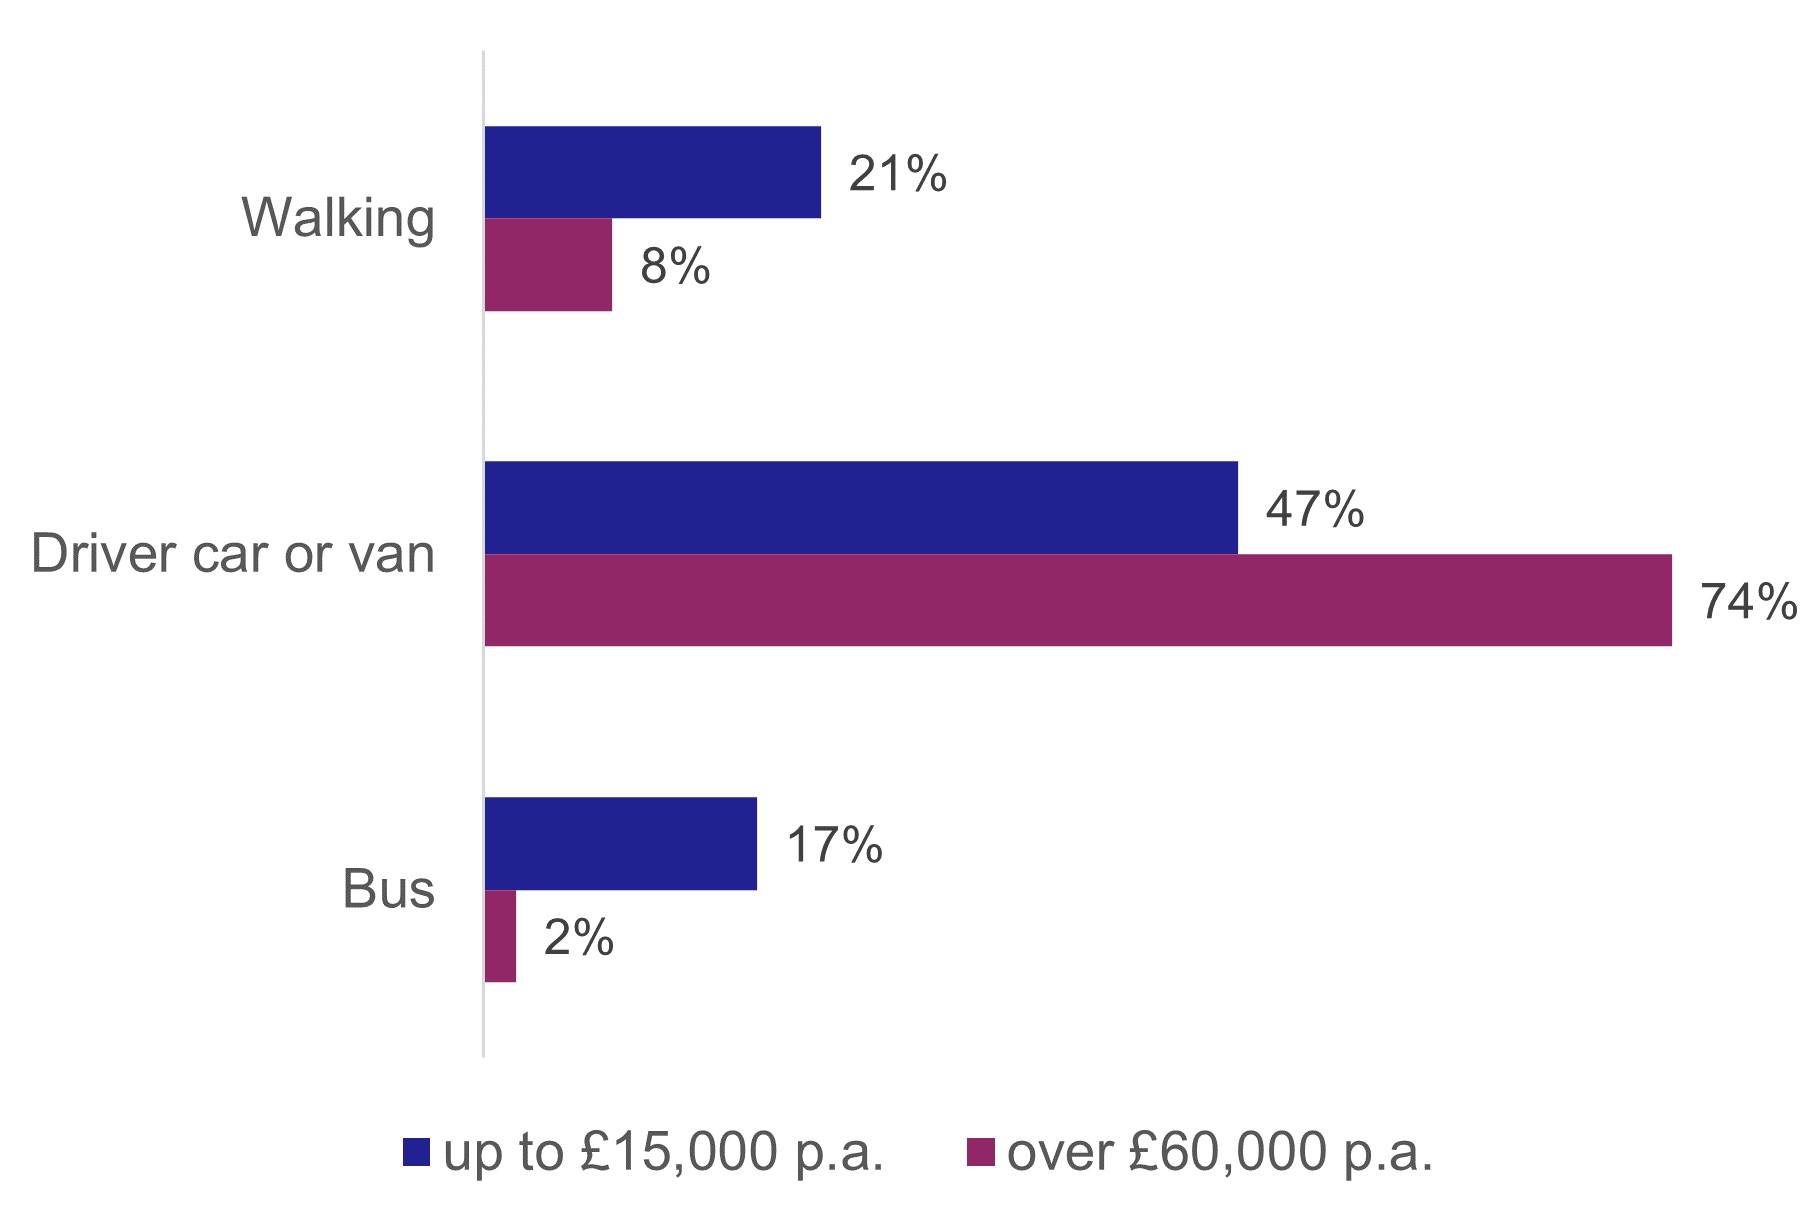
Those on an income below £15,000 were less likely to travel by car (47%), and more likely to walk (21%) or get the bus (17%) than those on incomes over £60,000 (74%, 8% and 2% respectively). [Table 7 and Figure 10]
Travel to School
How do children travel to school?
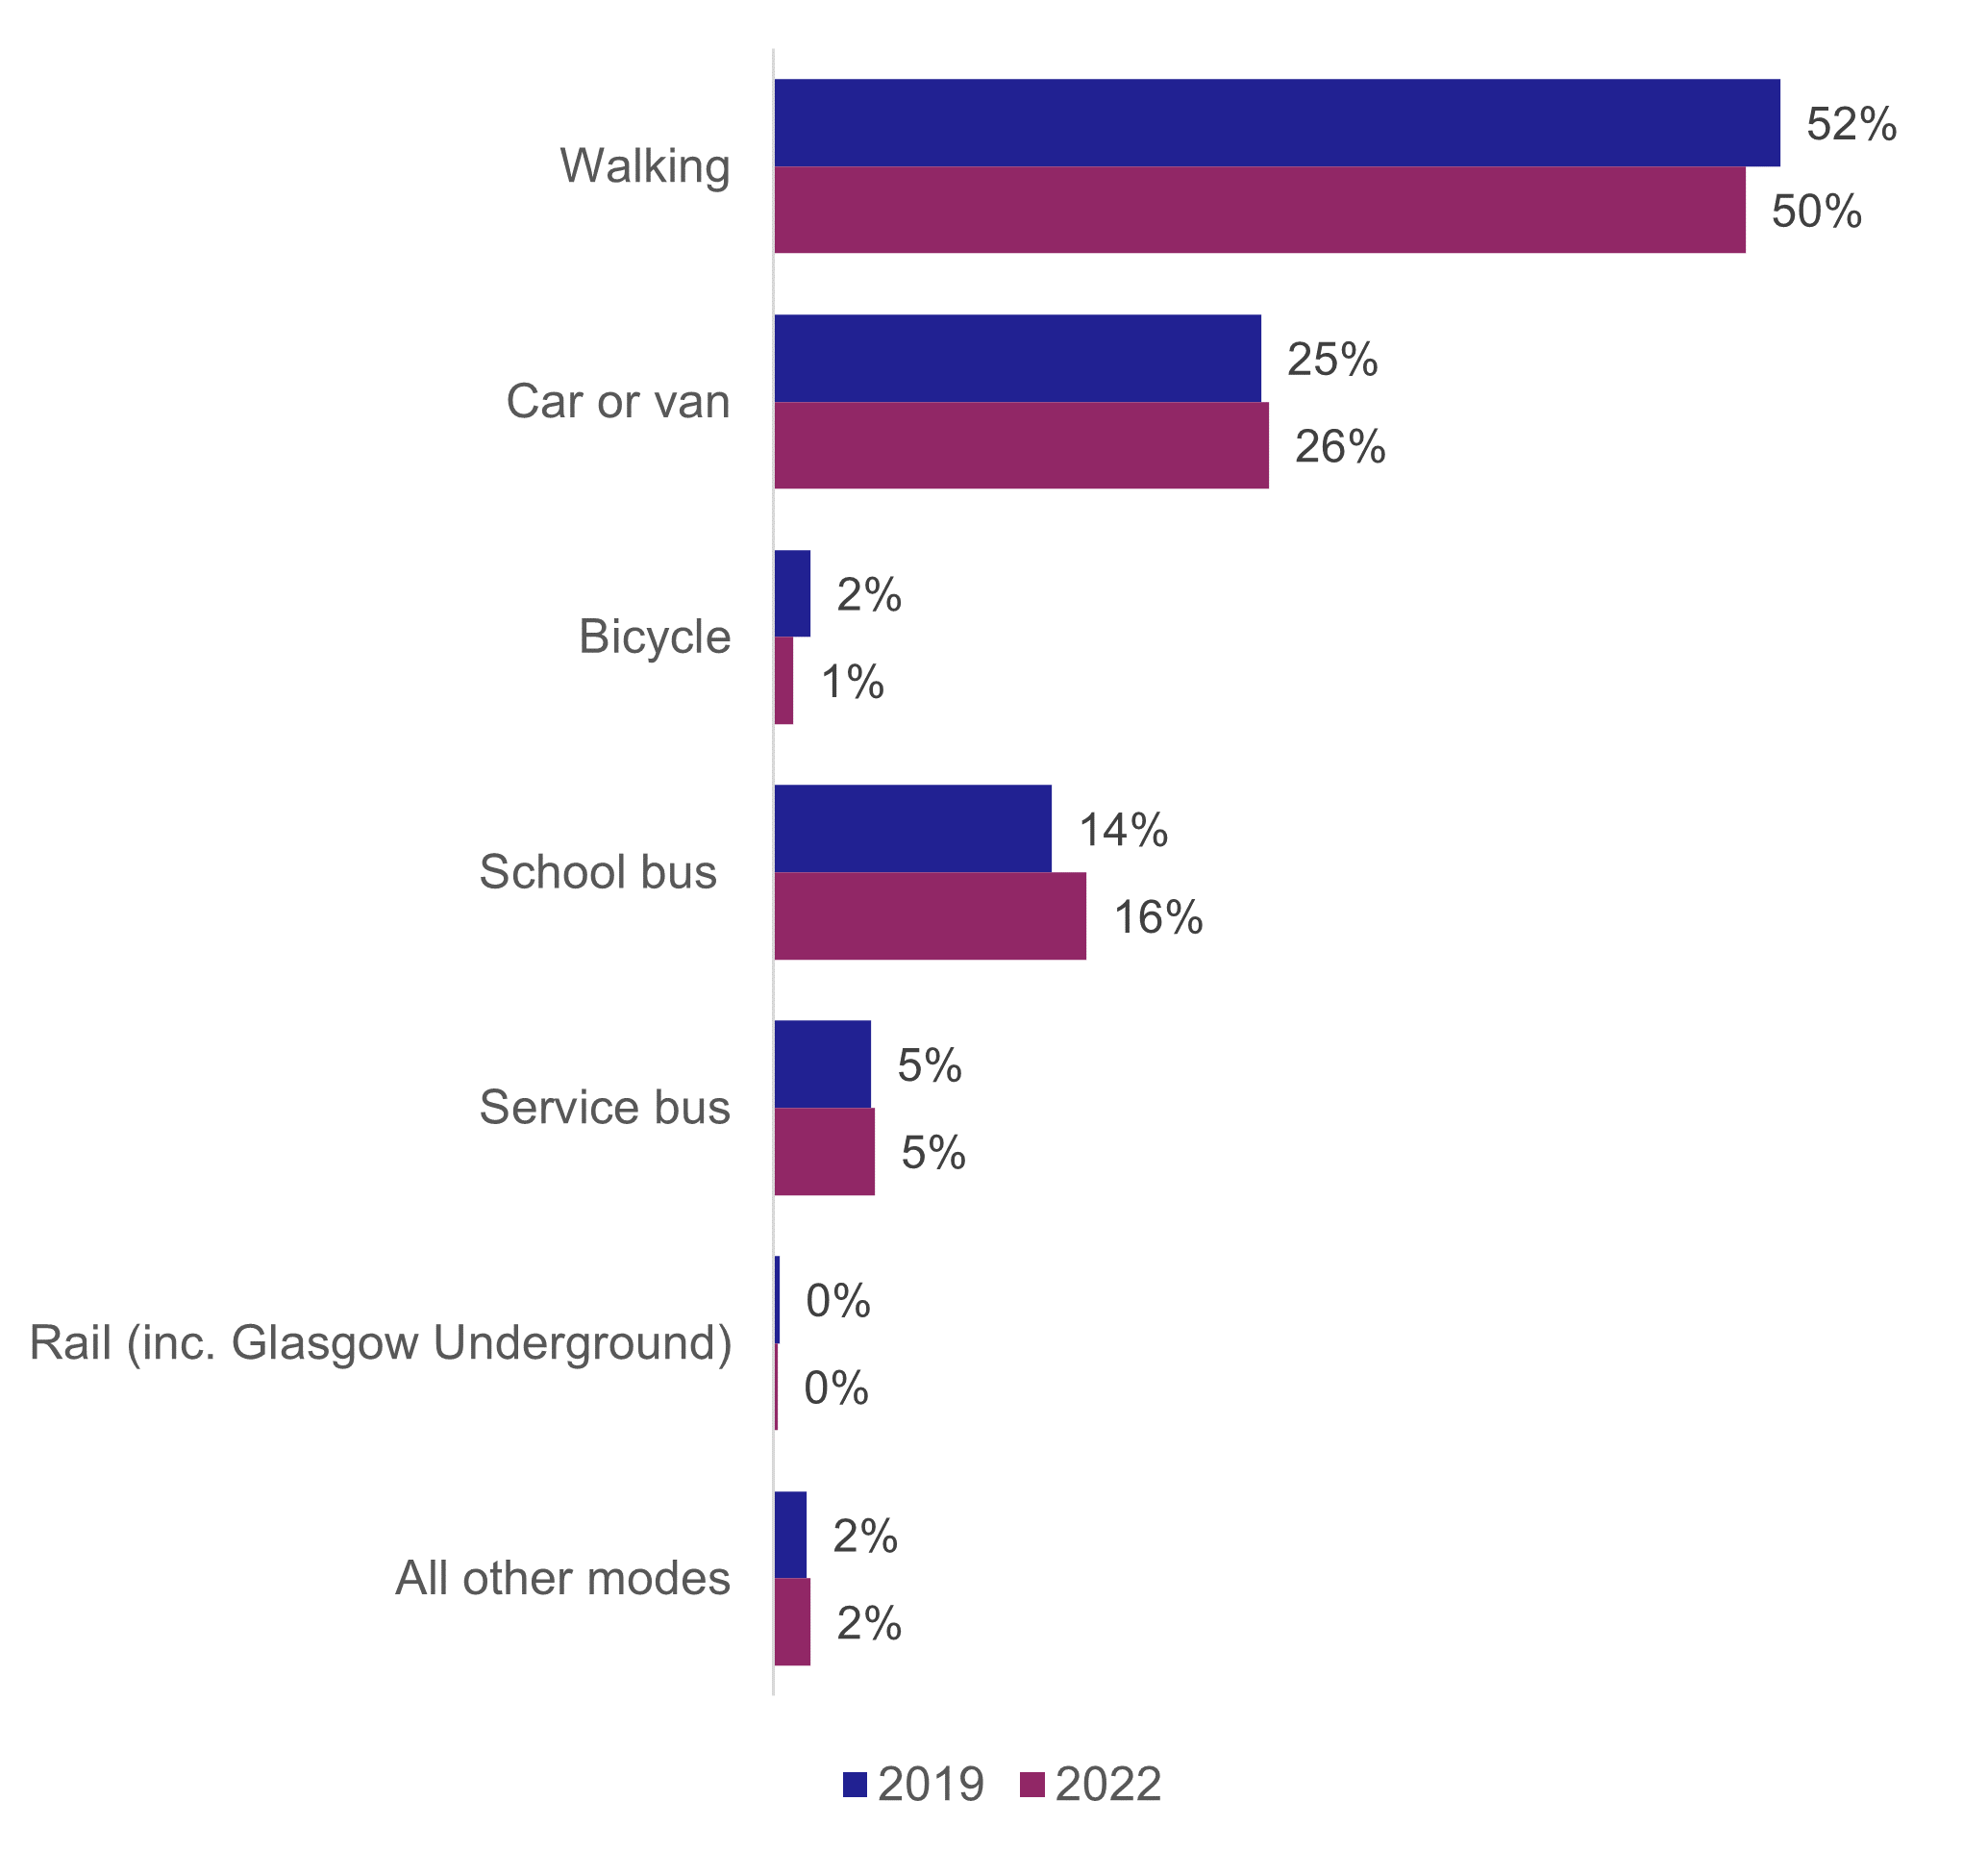
In 2022, children’s mode of travel to school was broadly similar to 2019 [Figure 11].
Half of children (50%) walked to school, around a quarter (26%) travelled by car and around a fifth (21%) used a bus. [Table SUM1, Table 15 and Figure 11]
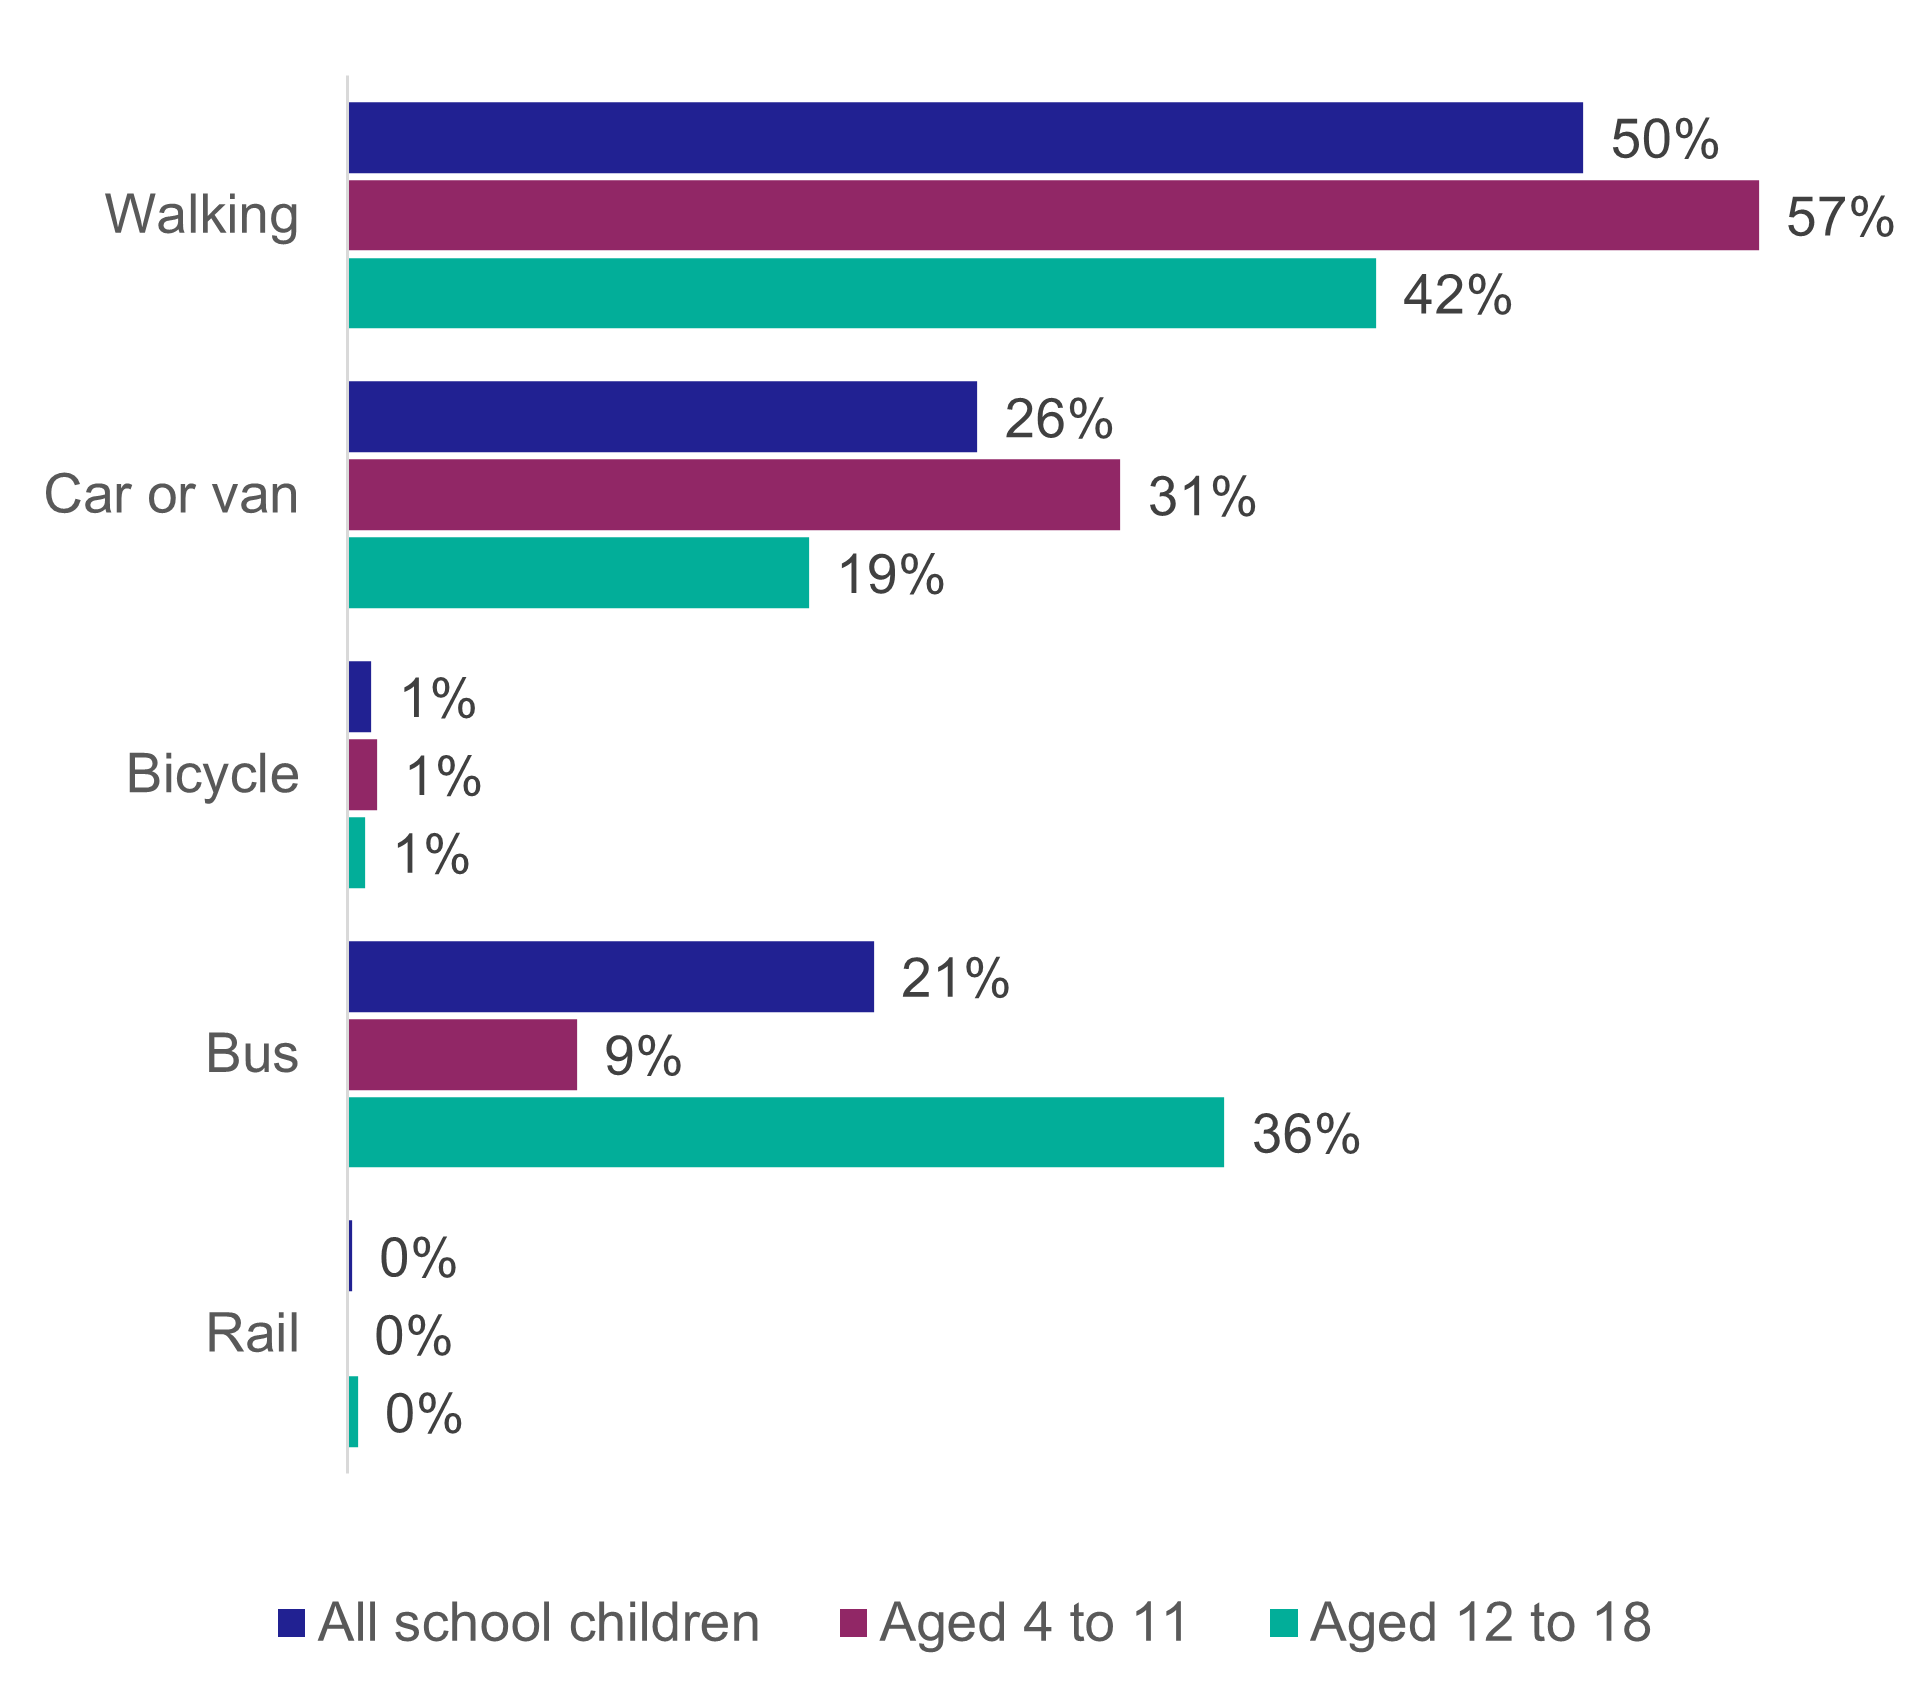
There was variation in mode of travel by age. In the 4 to 11 age group, 57% reported walking to school, compared to 42% in the 12 to 18 age group. The older age group were more likely to catch a bus than younger children (36% compared to 9%). [Table 15 and Figure 12].
How long do people travel for?
Journey length has remained relatively similar to 2019 in terms of the percentage of individual journeys being a given duration or distance. However, it should be noted that since 2019 the number of journeys occurring has decreased and therefore the total time people have spent traveling and the total distance travelled have reduced.
Duration of travel
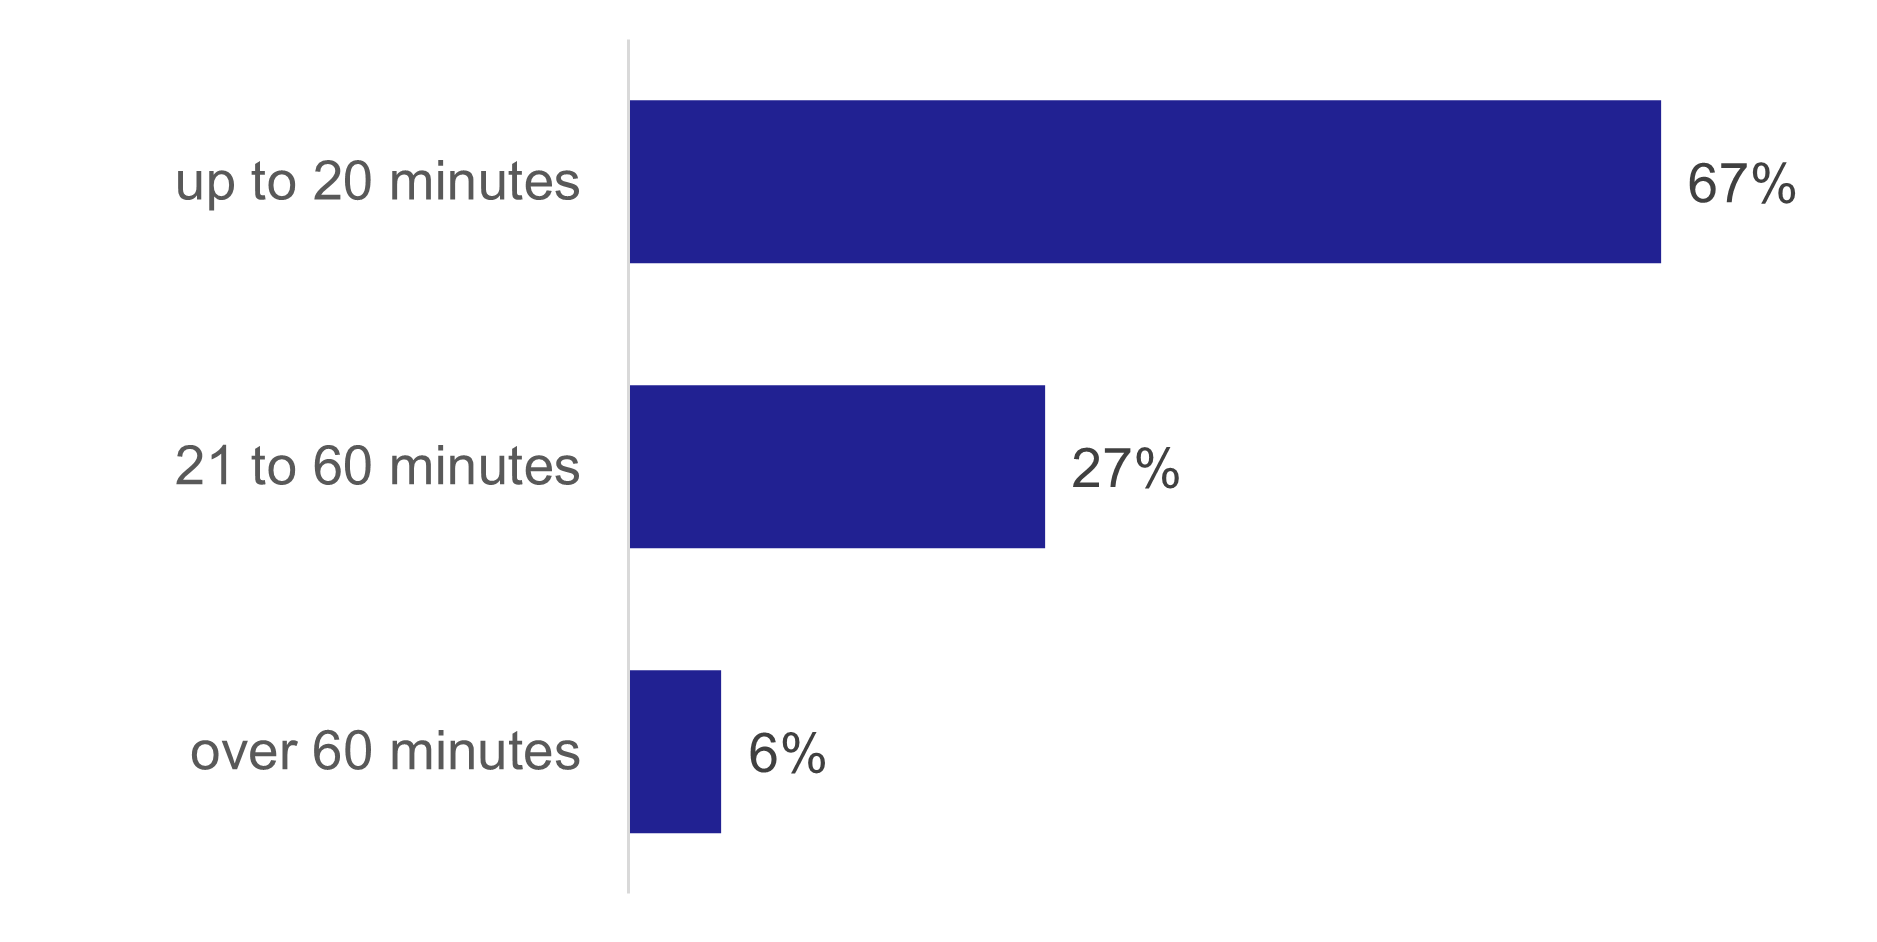
The majority of journeys reported were of short duration. 67% of journeys lasted up to 20 minutes. Only 6% lasted more than an hour. [Table TD6 and Figure 13]
Distance travelled
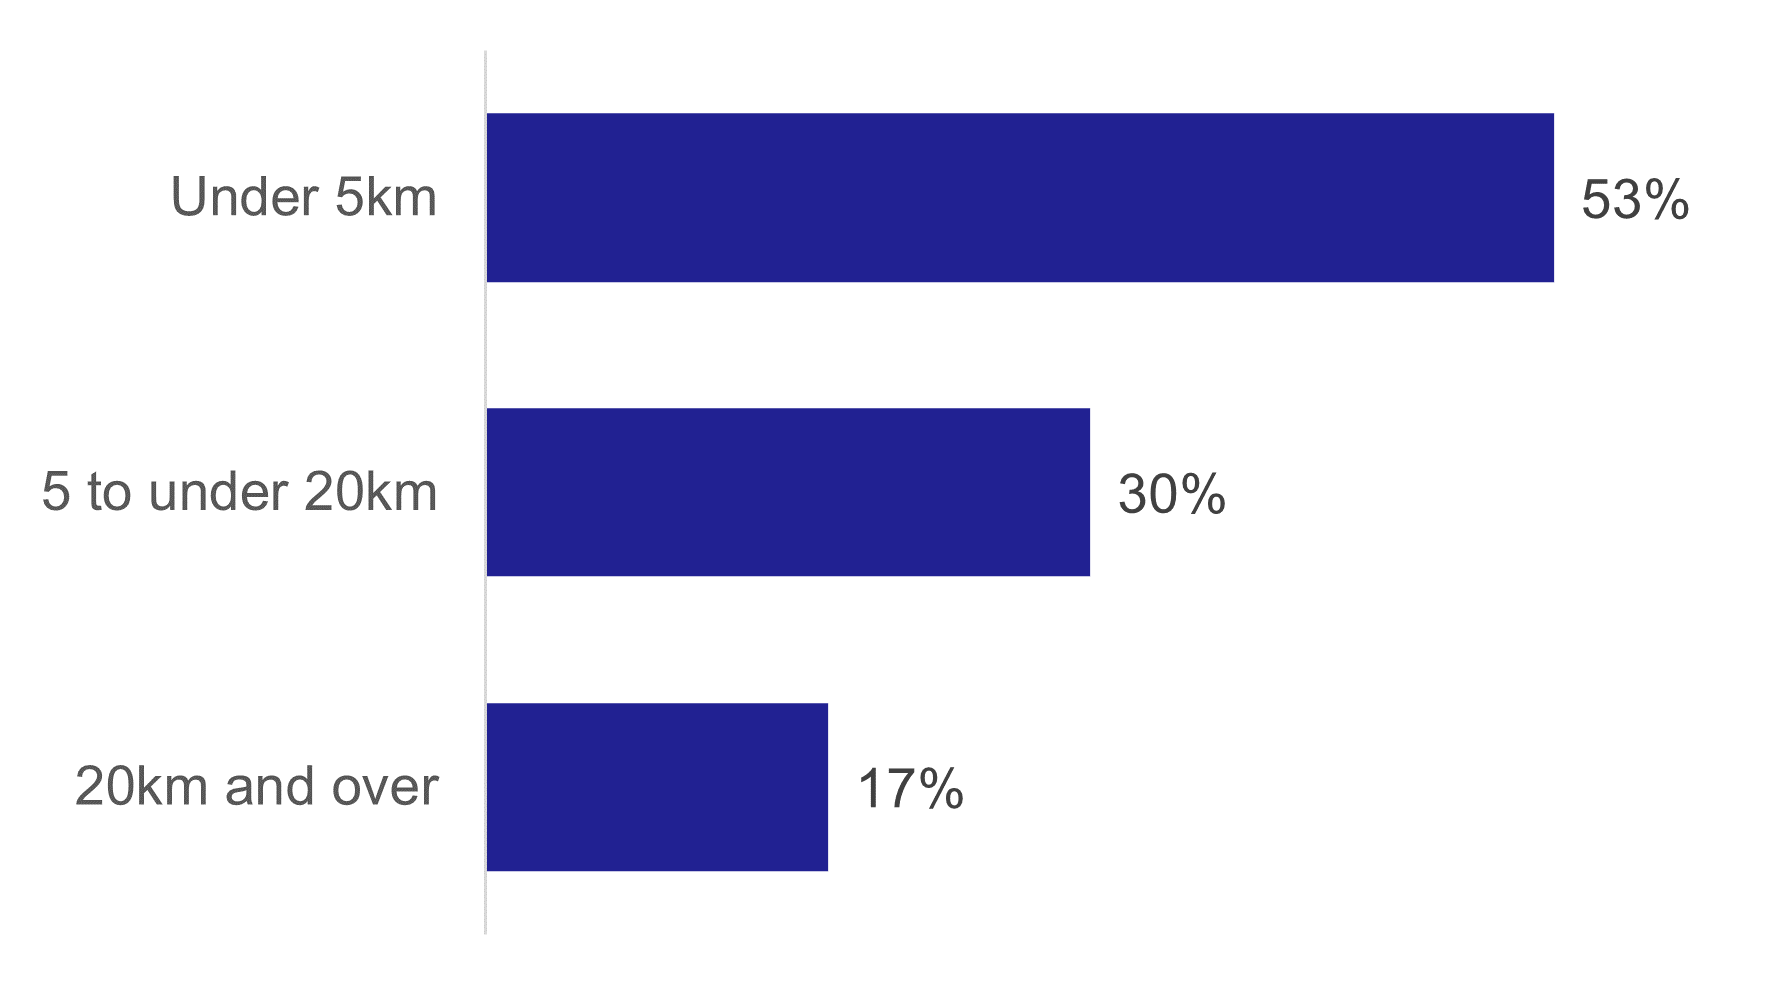
Over half (53%) of journeys were under 5 km. [Table TD4 and Figure 14]
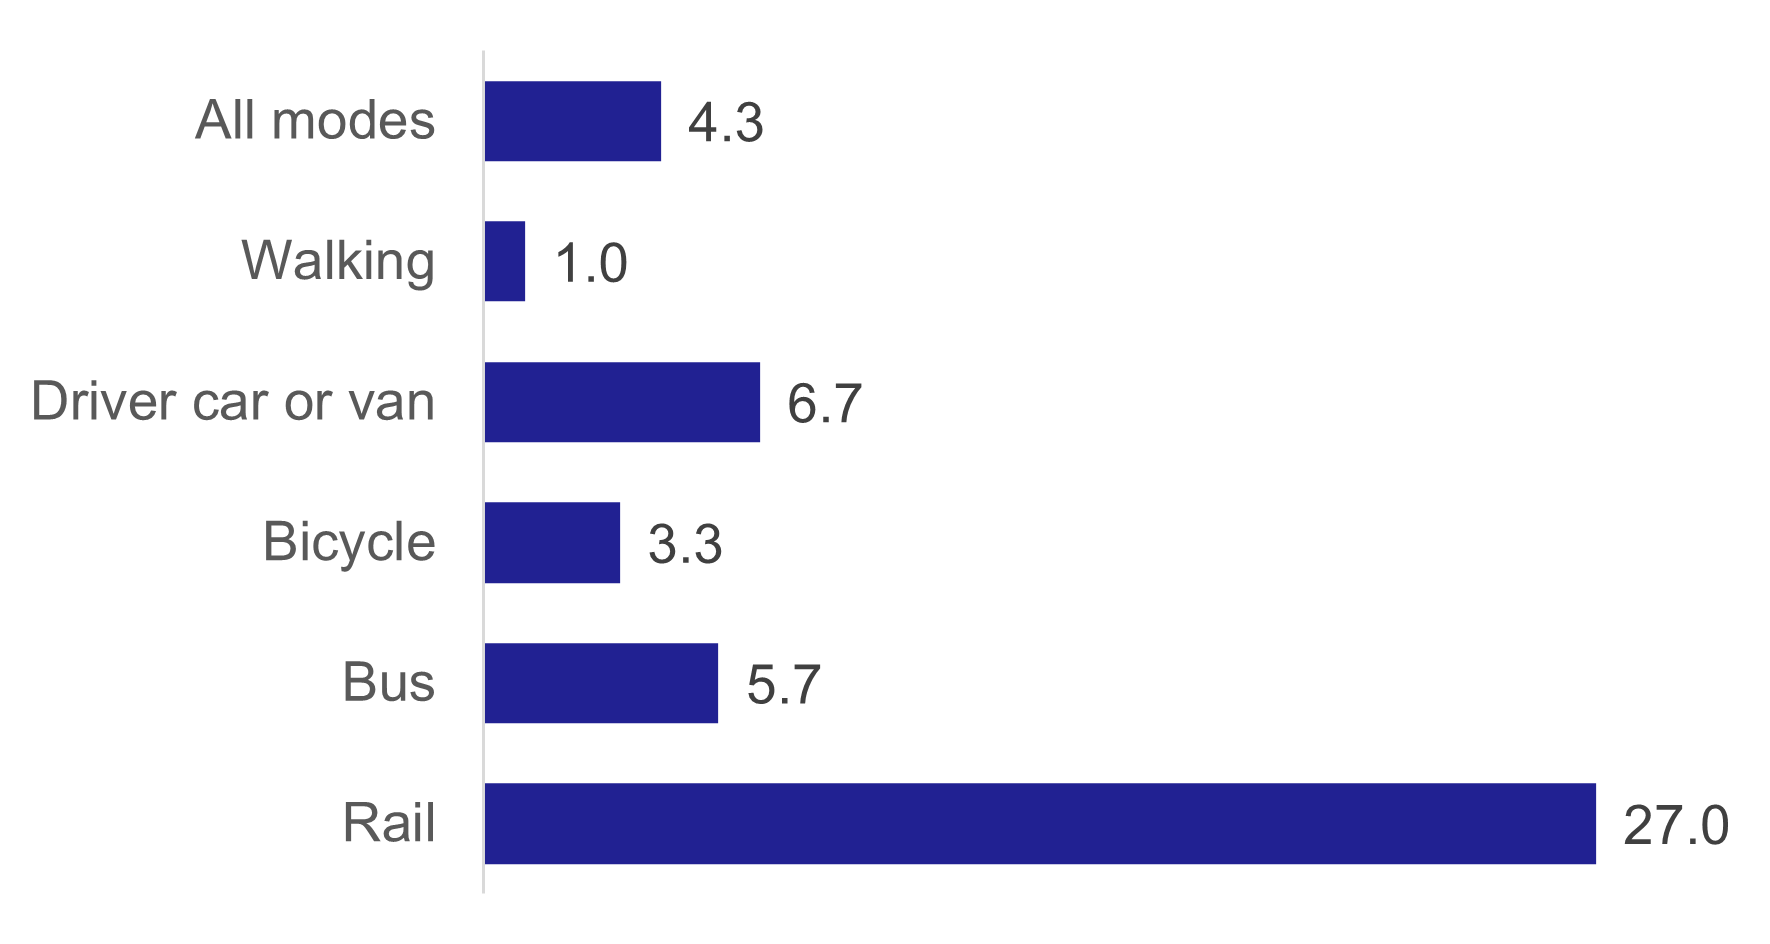
The median journey length was 4.3 km, and the mean journey length was 13.2km. [Table TD5]
Walking journeys were an average (median) length of 1.0 km, with car driver journeys at 6.7 km and rail the longest at 27.0 km. [Table TD 5a and Figure 15]
The median length of journey was similar across all modes of travel other than rail, which increased from 20.8 km in 2019.
66% of journeys under 1 km were made on foot; car journeys (whether as a driver or passenger) accounted for most of the remainder (26%). Car was the most common mode of travel for all distance groupings greater than 2 km. [Table TD2a]