Public Transport
Public transport satisfaction
Overall, satisfaction with public transport was lower in 2022 than in 2019.
The proportion of all survey respondents stating that they were very or fairly satisfied with public transport in 2022 was 58%, a ten percentage point drop from 2019 (68%) [Table 4]
Satisfaction with public transport was higher amongst actual users of public transport (those that had used bus or train in the past month) with 67% of users reporting that they were satisfied in 2022. However, this also represented a drop in satisfaction compared with 2019 (76%).
Satisfaction with public transport was lowest in rural areas. Satisfaction rates for those living in remote rural and accessible rural areas (40% and 42% respectively) contrasted with a satisfaction rate of 68% for those living in large urban areas.
Local bus services
37% of survey respondents had used the bus in the past month, which is a decrease from 39% in 2019. This decrease has been mainly driven by a reduction in the percentage of men using the bus (34% had used the bus in the last month in 2022, compared to 37% in 2019). Only 5% of survey respondents used the bus every day or almost every day, down from 8% in 2019. [Table SUM1, Table 28a]
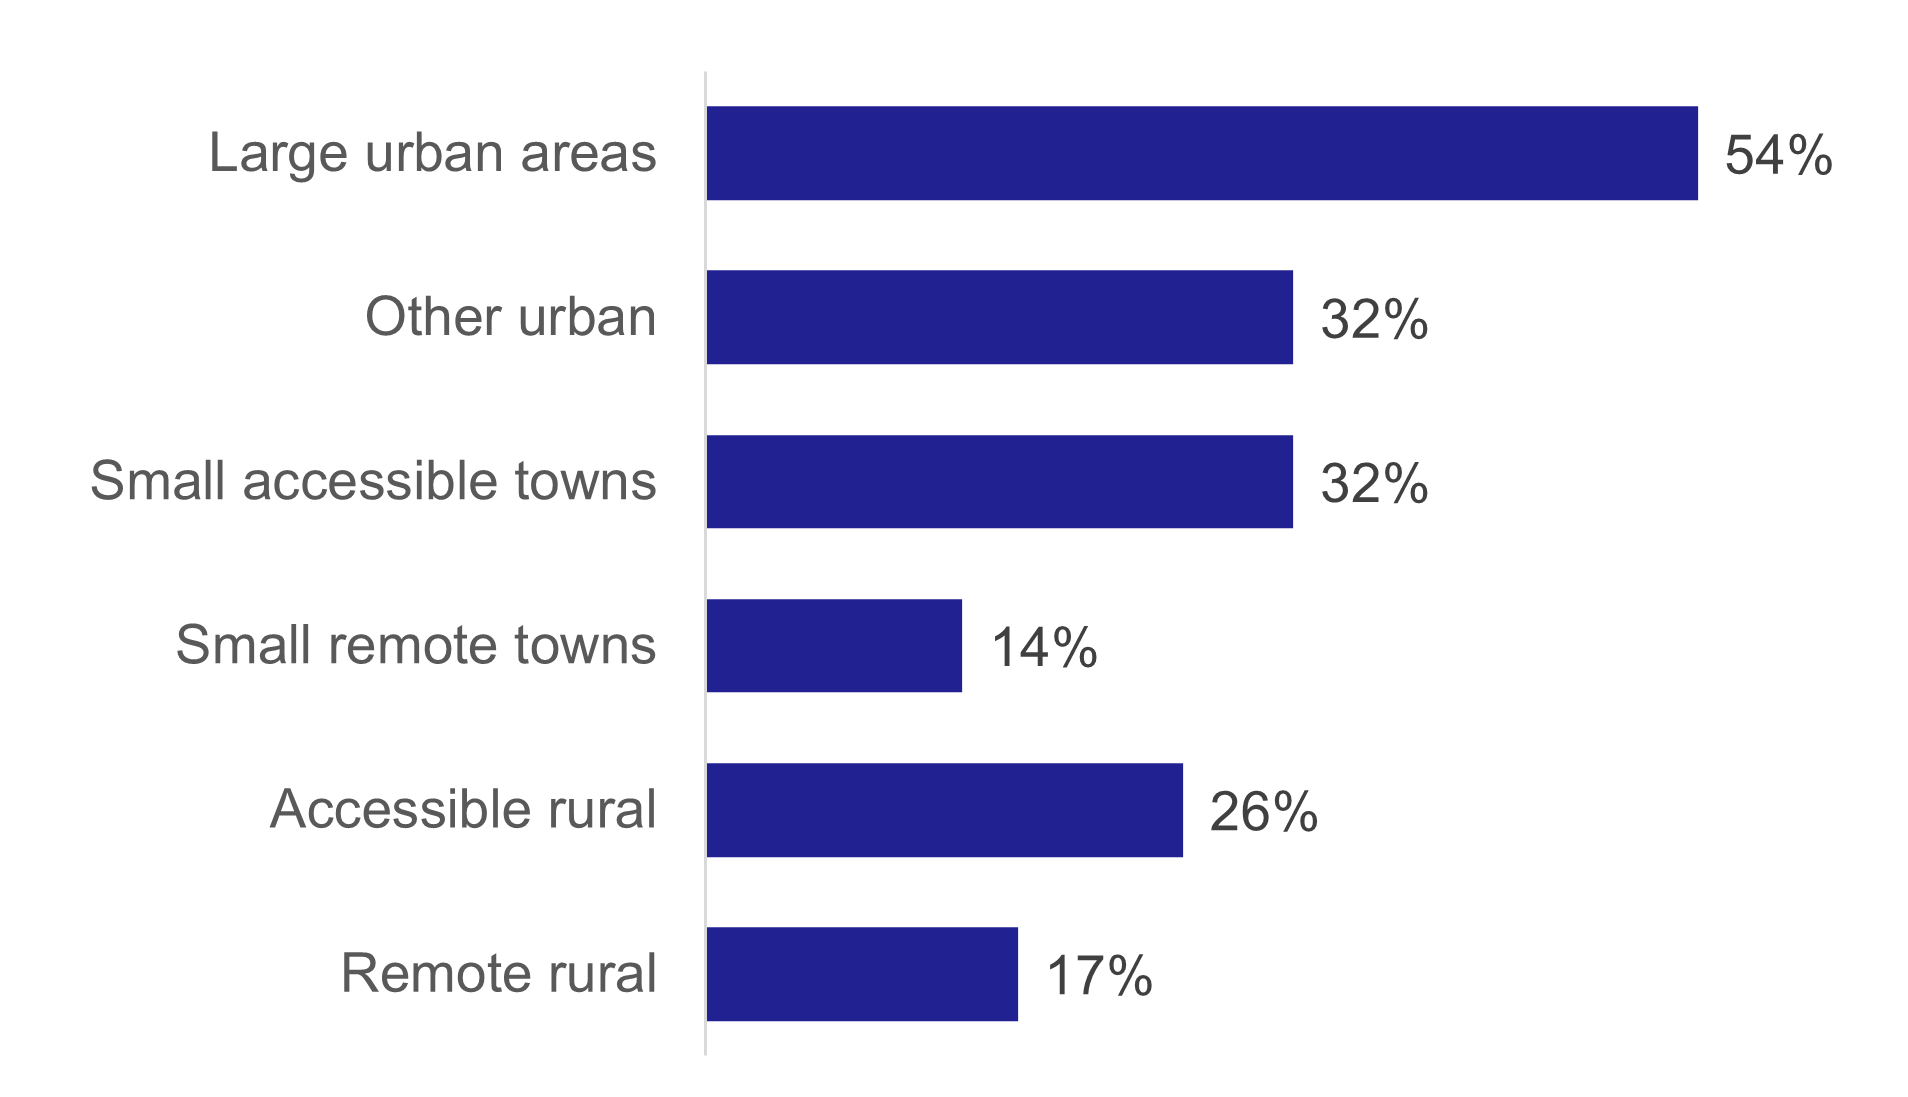
Frequency of bus use was higher in urban areas: 54% of people in large urban areas used the bus at least once a month compared to 14% in small remote towns and 17% in remote rural areas. [Table 28a and Figure 19]

Rail travel
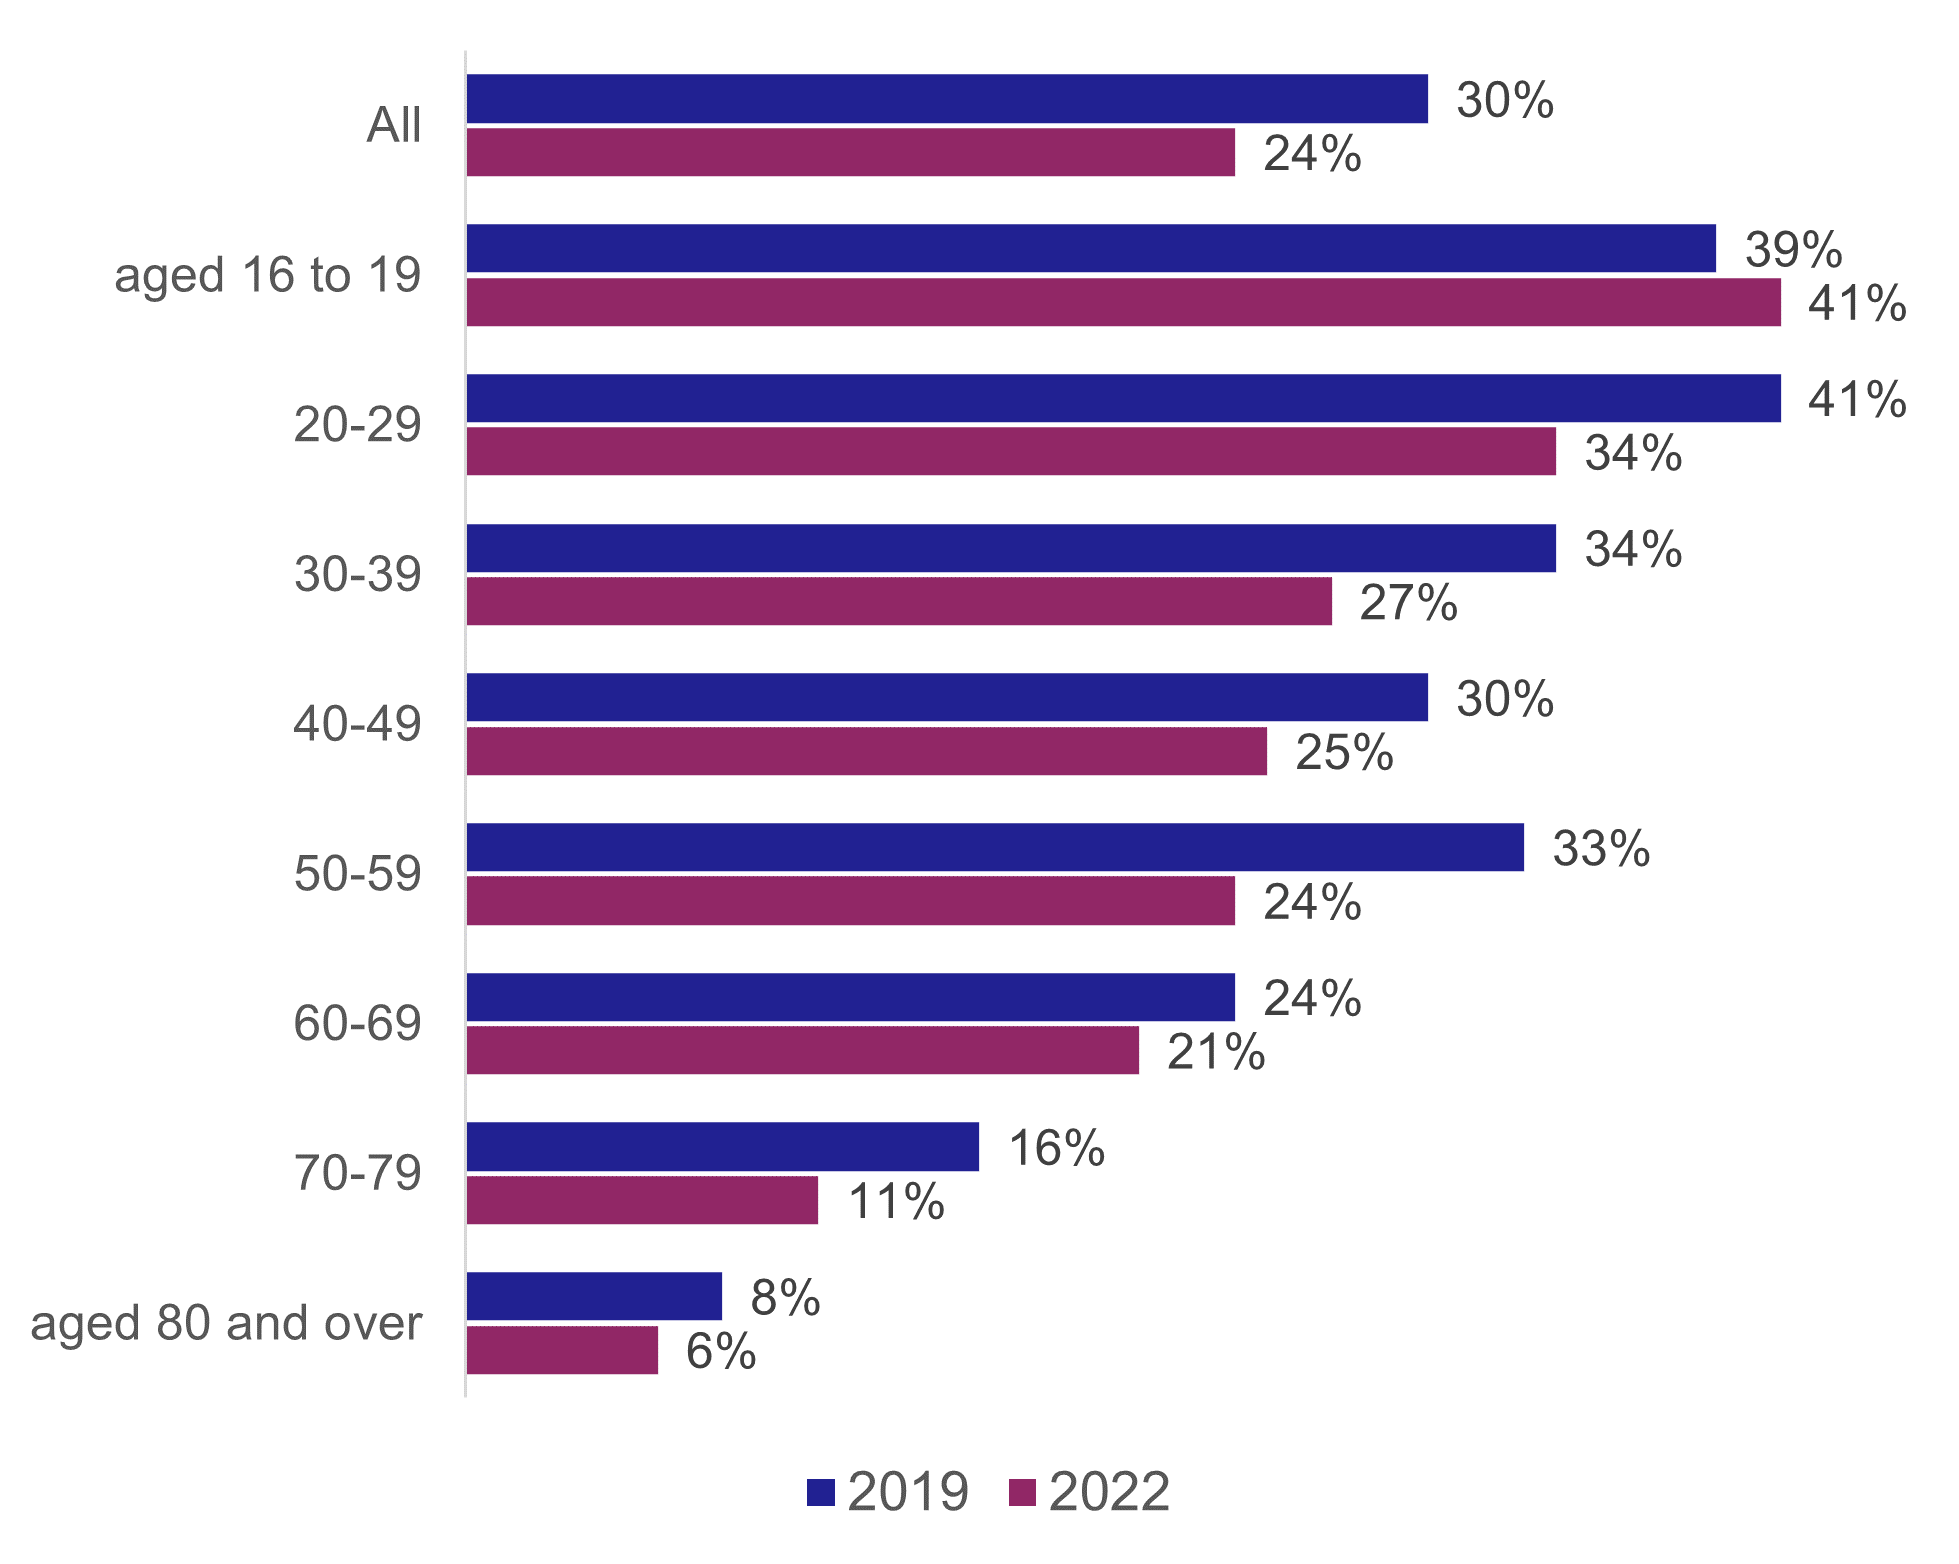
About a quarter (24%) of survey respondents had used the train in the last month, which is a decrease from 30% in 2019. [Table 28b, Table SUM1]
The proportion of people who reported that they had used the train in the last month decreased with age: 41% of those aged 16-19 had used the train in the last month, compared to 11% aged 70 to 79 and 6% of those aged 80 and over. [Table 28b and Figure 20]
Contrary to the pattern shown in bus travel, the decrease in use in the last month has been seen by both males and females. However the decrease is most prominent in the age groups between 20 and 59 years old.

Of those who had used the train in the last month, the most frequent journey purpose was shopping (30%) visiting friends or relatives (28%). [Table 44]
Public transport cost
The average amount spent by an adult on public transport in 2022 was £2.20 per week. Most people (84%) spent nothing. This includes those who do not use public transport and holders of a pass for free travel. [Table 53]
For those who said they used public transport at least once a week, the average spent was £6.60 per week and 58% spent nothing (this will include free pass holders). [Table 53]
Affordability of transport
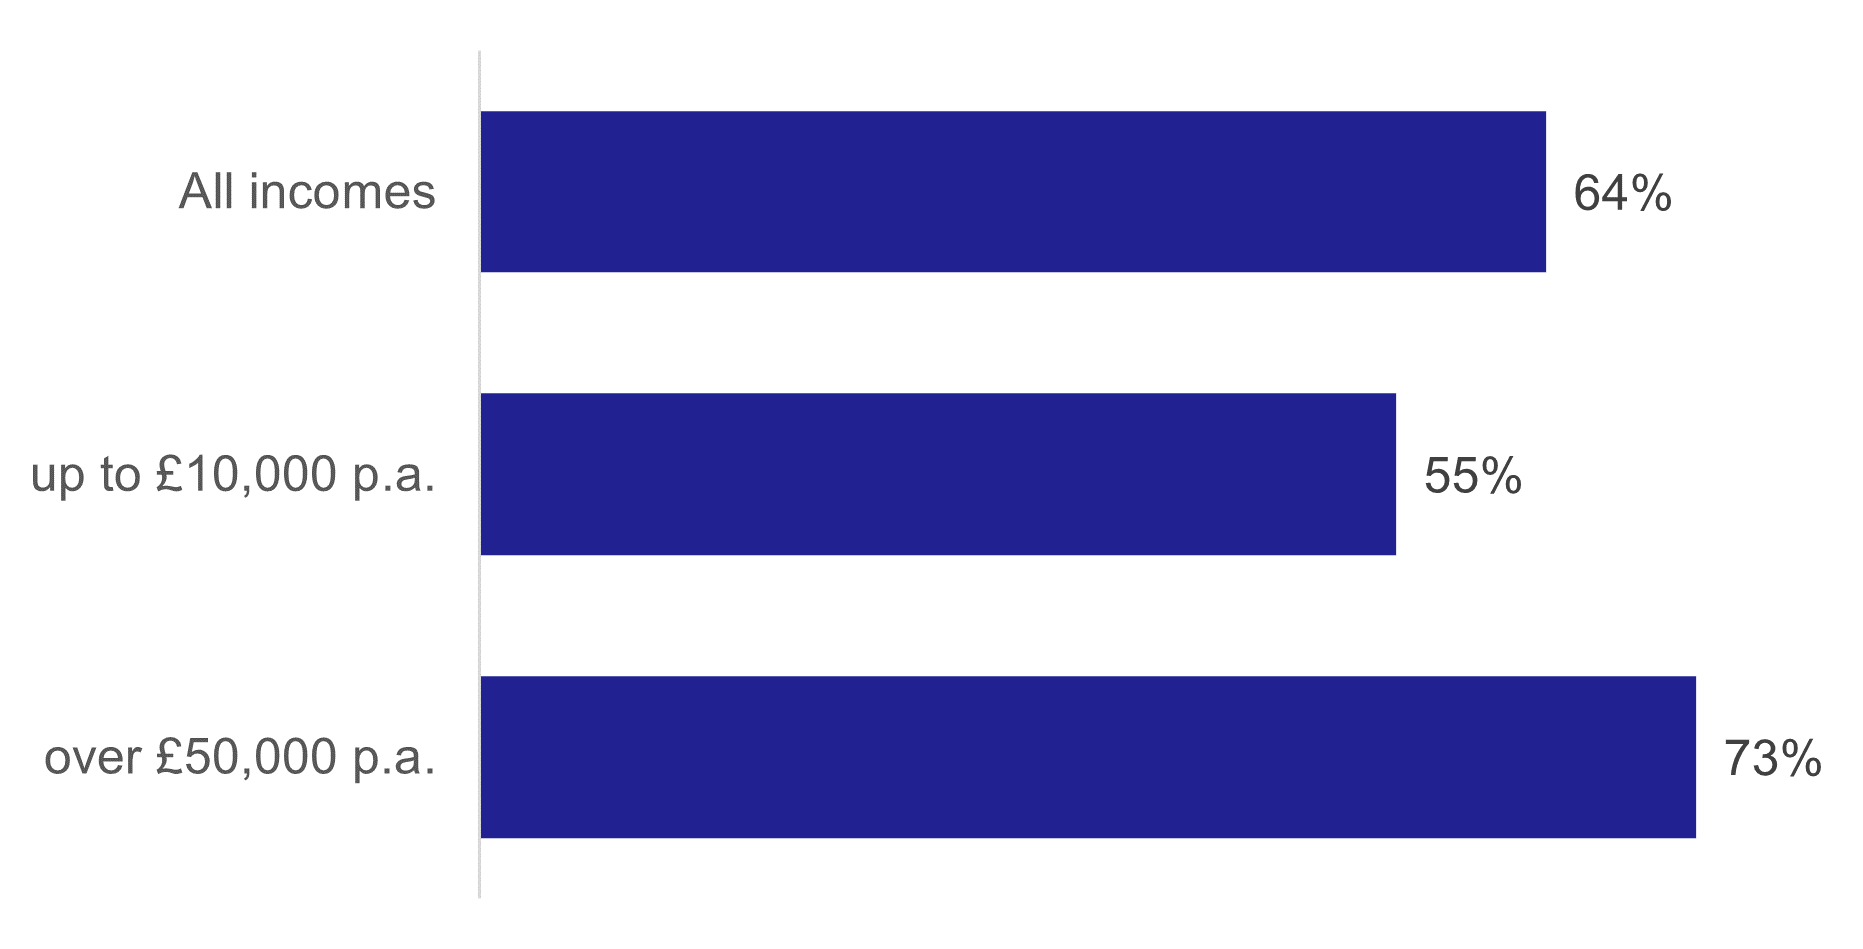
64% of people said their transport costs were either fairly easy or very easy to afford. Those in households on incomes up to £10,000 were less likely to consider their costs affordable (55%). [Table 54 and Figure 21].

48% of respondents said that transport costs affected the method of travel they used. [Table 55]