Impact on travel behaviour
Mode Choice
The Hands Up Survey Scotland (HUSS) data, which was available up to 2022, details the mode used by primary and secondary pupils to travel to school. The survey is undertaken annually in September, and provides a snapshot of how pupils are travelling to school on a ‘neutral’ day. Table 6 shows a slight decline in walking to school, although it continued to remain the most popular form of travel to school, with levels still above those recorded in 2019. Park and stride (where people drive part of the way, park at a distance to their destination walk the rest of the way) also showed a slight decline, with this representing a continued decrease since 2019. Conversely, there was a slight increase in bus use in 2022, the first year when the Young Persons’ Free Bus Travel Scheme was available. This largely returned bus use to pre-Covid-19 levels.
| Mode | 2019 | 2020 | 2021 | 2022 |
|---|---|---|---|---|
| Walk | 41.0% | 44.8% | 43.6% | 42.6% |
| Cycle | 4.1% | 3.8% | 4.0% | 3.9% |
| Scooter / Skate | 2.7% | 2.6% | 2.7% | 2.9% |
| Park & Stride | 10.2% | 9.9% | 9.9% | 9.5% |
| Driven | 23.8% | 22.8% | 23.2% | 23.1% |
| Bus | 16.0% | 14.1% | 14.5% | 15.8% |
| Taxi | 1.7% | 1.6% | 1.5% | 1.6% |
| Other | 0.6% | 0.4% | 0.6% | 0.5% |
| Total (n) | 472,617 | 405,917 | 418,147 | 456,695 |
Baseline vs Follow-Up Surveys
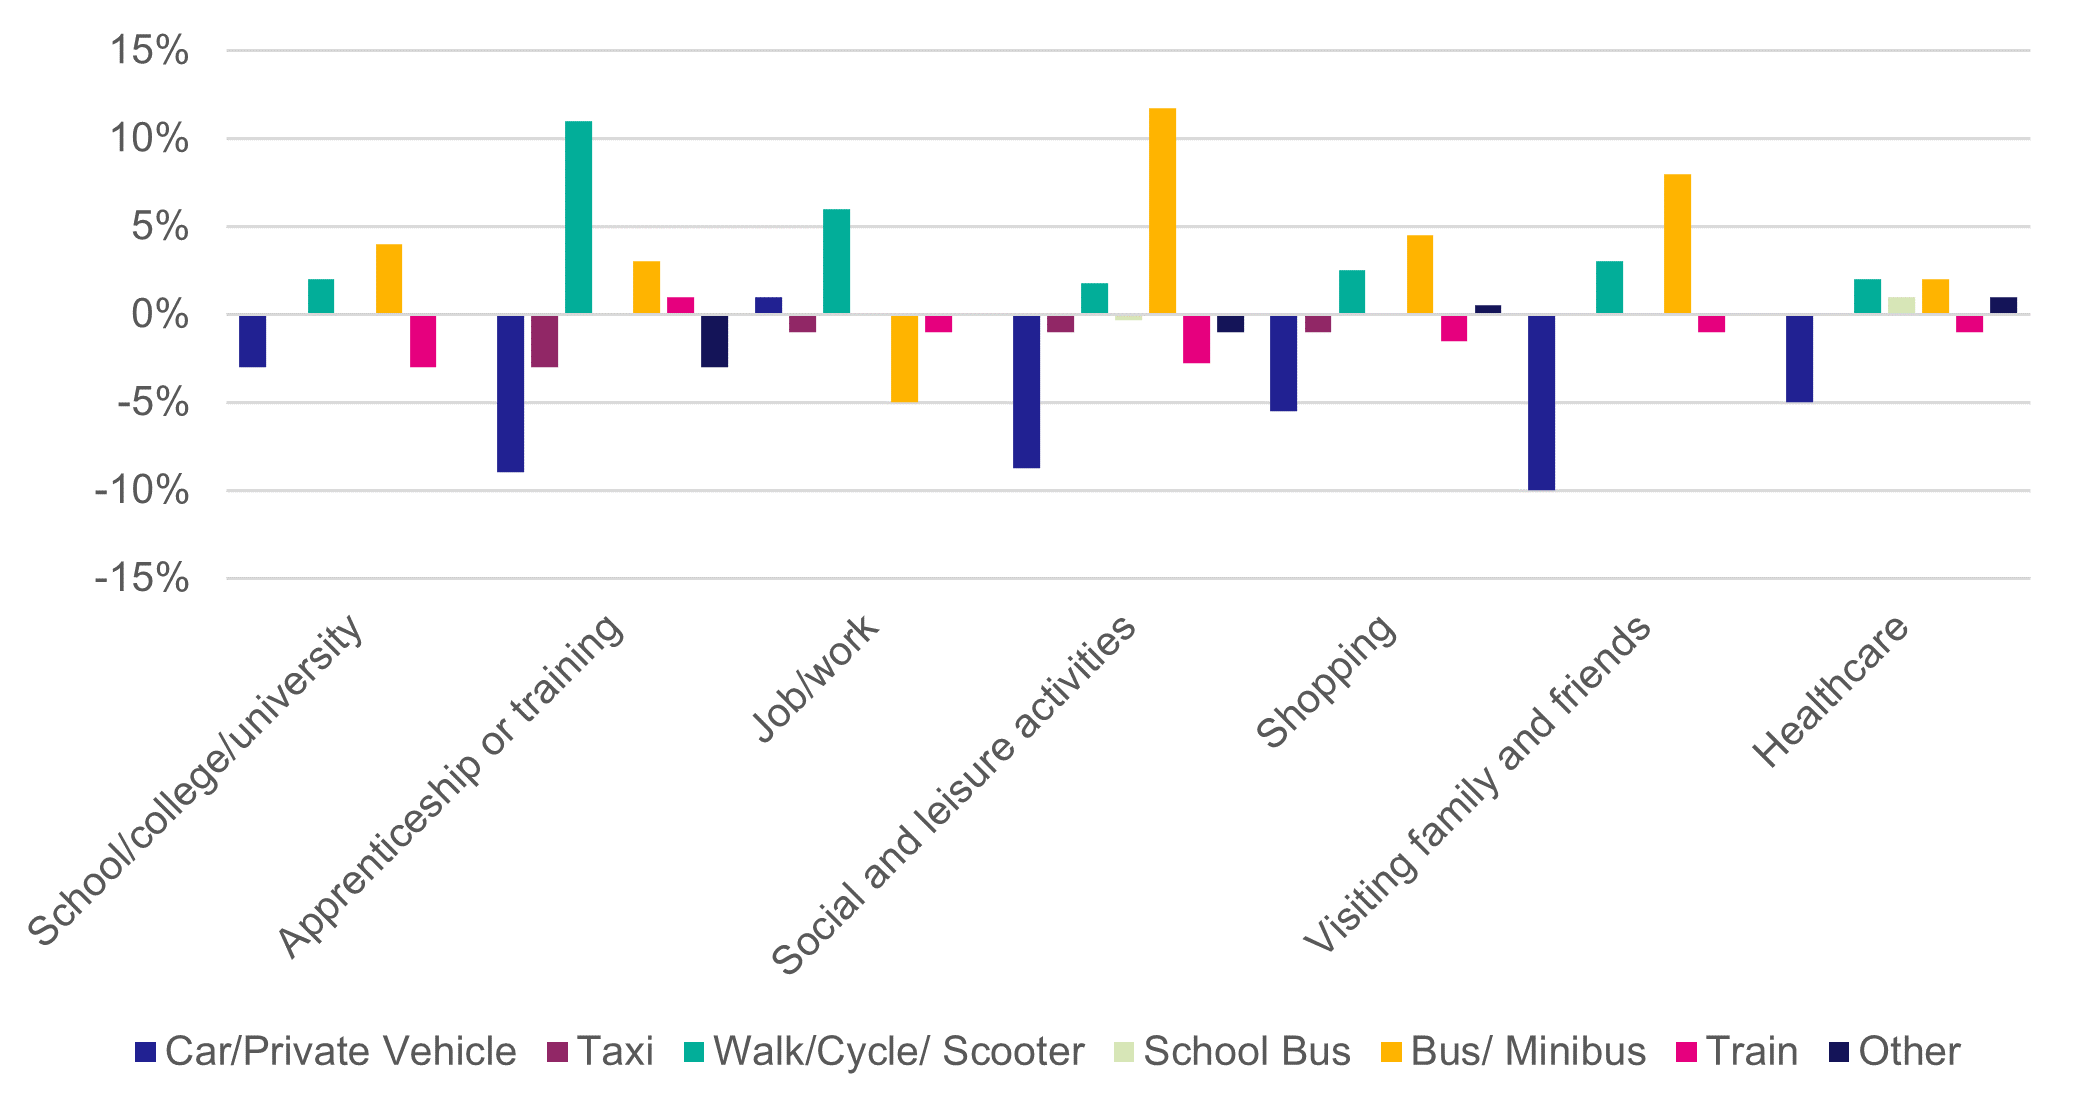
When comparing the modes used to travel for different journey purposes between the baseline and follow-up surveys (see Table B2 in Appendix B) car and train use had both declined across nearly all journey purposes, while bus use and the use of active modes (including walking, cycling and scootering) had increased.
Figure 6 outlines the change in modes used by journey purpose. This shows there was a 10 percentage point decrease in car use for visiting family and friends, and a nine percentage point drop in car use for social and leisure activities (although this varied depending on the nature of the social/leisure activity specified in the baseline survey).
The largest increase in bus use was for social and leisure activities, rising by 12 percentage points from an average of 33% in the baseline survey to 45% in the follow-up survey.
Impact on Other Modes
Follow-up survey responses and focus group participants also suggested at least some modal shift away from car use to buses as children and young people were able to travel more independently and did not have to rely on parents or others driving them to destinations. Some also suggested that family travel by bus had also increased:
“Living in the country meant I was fully reliant on my parents for lifts. I can now take the bus to part-time work/seeing friends more frequently and when I choose.” (Follow-up survey)
“I’m an avid car user myself, but since the introduction of the travel cards it’s been fantastic because now I would say that the majority of the travel that goes on, I would probably say about 90% of it, has changed from car to buses.” (Parent/Carer of Scheme User)
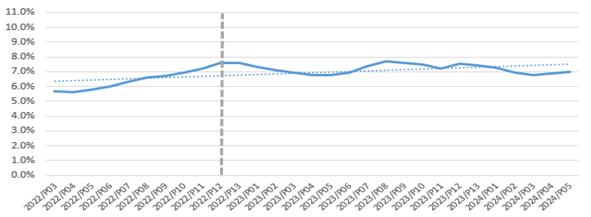
ScotRail data for the Young Persons’ Railcard (for ages 16-25) was also reviewed for the period before and after the implementation of the Young Persons’ Free Bus Travel Scheme. Figure 7 outlines the results. This shows a steady growth in the proportion of ScotRail business made up of this product ahead of the launch of the Young Persons’ Free Bus Travel Scheme, followed by a slight decline following the introduction of the free bus travel. The proportion of business made up of the Young Persons’ RailCard has, however, largely levelled out, showing seasonal peaks around school holiday periods. ScotRail noted that those using the Young Persons’ RailCard were among the most loyal rail users, representing repeat/habitual users. It should be noted, however, that this ticket type collates those aged 16-21 and 22-25, and does not disaggregate the behaviour of these two age groups (i.e. those eligible for the Free Bus Travel Scheme and those who are not). Further, the data is based on the ‘proportion of business’ by ticket type, rather than actual usage numbers. As such, proportions could be driven by changes in the use of other ticket types (e.g. reduction in the use of child tickets, or tickets bought by adults or older passengers who’s travel patterns have been impacted by Covid-19), rather than necessarily being as a direct result of the use of the Young Persons’ Railcard.
Data relating to child tickets (covering ages 5-15) for ScotRail was also analysed (see Figure 8). This shows an overall decline in the percentage of the business made up of child tickets, despite seasonal fluctuations around school holiday periods. There was also a clear decrease at the launch of the Young Persons’ Free Bus Travel Scheme. ScotRail noted that this ticketing type now makes up a significantly smaller proportion of their business compared to August 2021 (where it accounted for 10% of all business). Again, however, it is important to note this is based on ‘proportion of business’ rather than ticketing numbers (as above).
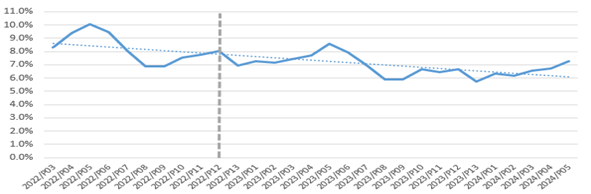
While these changes are likely to have been impacted by the introduction of the Young Persons’ Free Bus Travel Scheme, the use of ScotRail’s own ‘Kids for a Quid’ tickets are also likely to have contributed to the overall reduction in the use of child tickets on rail services. Data for this ticket type was, however, too seasonally driven to provide any useful insights into the impact of this product.
Among focus group attendees, while most young people reported that they definitely used the bus more since the scheme became live, many also reported that they continued to use alternative forms of transport, mainly for speed and convenience:
“I definitely use it [the bus] more and I never really used a bus before it came out. I still use the train sometimes because quite a lot they [buses] break down and don’t turn up and stuff so I have to get the train. And sometimes, if I’m going further, it’s easier to get the train because you’d have to get more than one bus, whereas I can get a train direct. And, if I’m able to get a lift, I will go in the car.” (Scheme User)
Young people reported that they did still sometimes need to be transported by car to places that were further from home and/or were not on bus routes. Both young people and parents/carers said that they would also still choose to walk or cycle to places that were close to home or due to perceived problems with bus routes:
“Sometimes I do go to a sports club on a Sunday or something and if the buses don’t come when I need them to my dad will drive me… otherwise, if it’s a short distance I’d probably just walk.” (Scheme User)
“Because there’s loads of roadworks at the moment between me and my work I have got a bike recently and I have been using it a lot more, but that’s more the fact that a lot of the bus routes are not always very direct. So, quite often you’re just better off walking and cycling.” (Scheme User)
Most (but not all) parents and carers who took part in focus groups indicated that they would also take the train instead of the bus as they perceived it was more efficient. While they would use the bus if travelling with their children (as the children would travel for free) they would still travel more by train when travelling alone. Some adults reported that they would also still use the train to travel longer distances with their children due to the Kids for a Quid tickets and because the train was faster.
Frequency of Travel
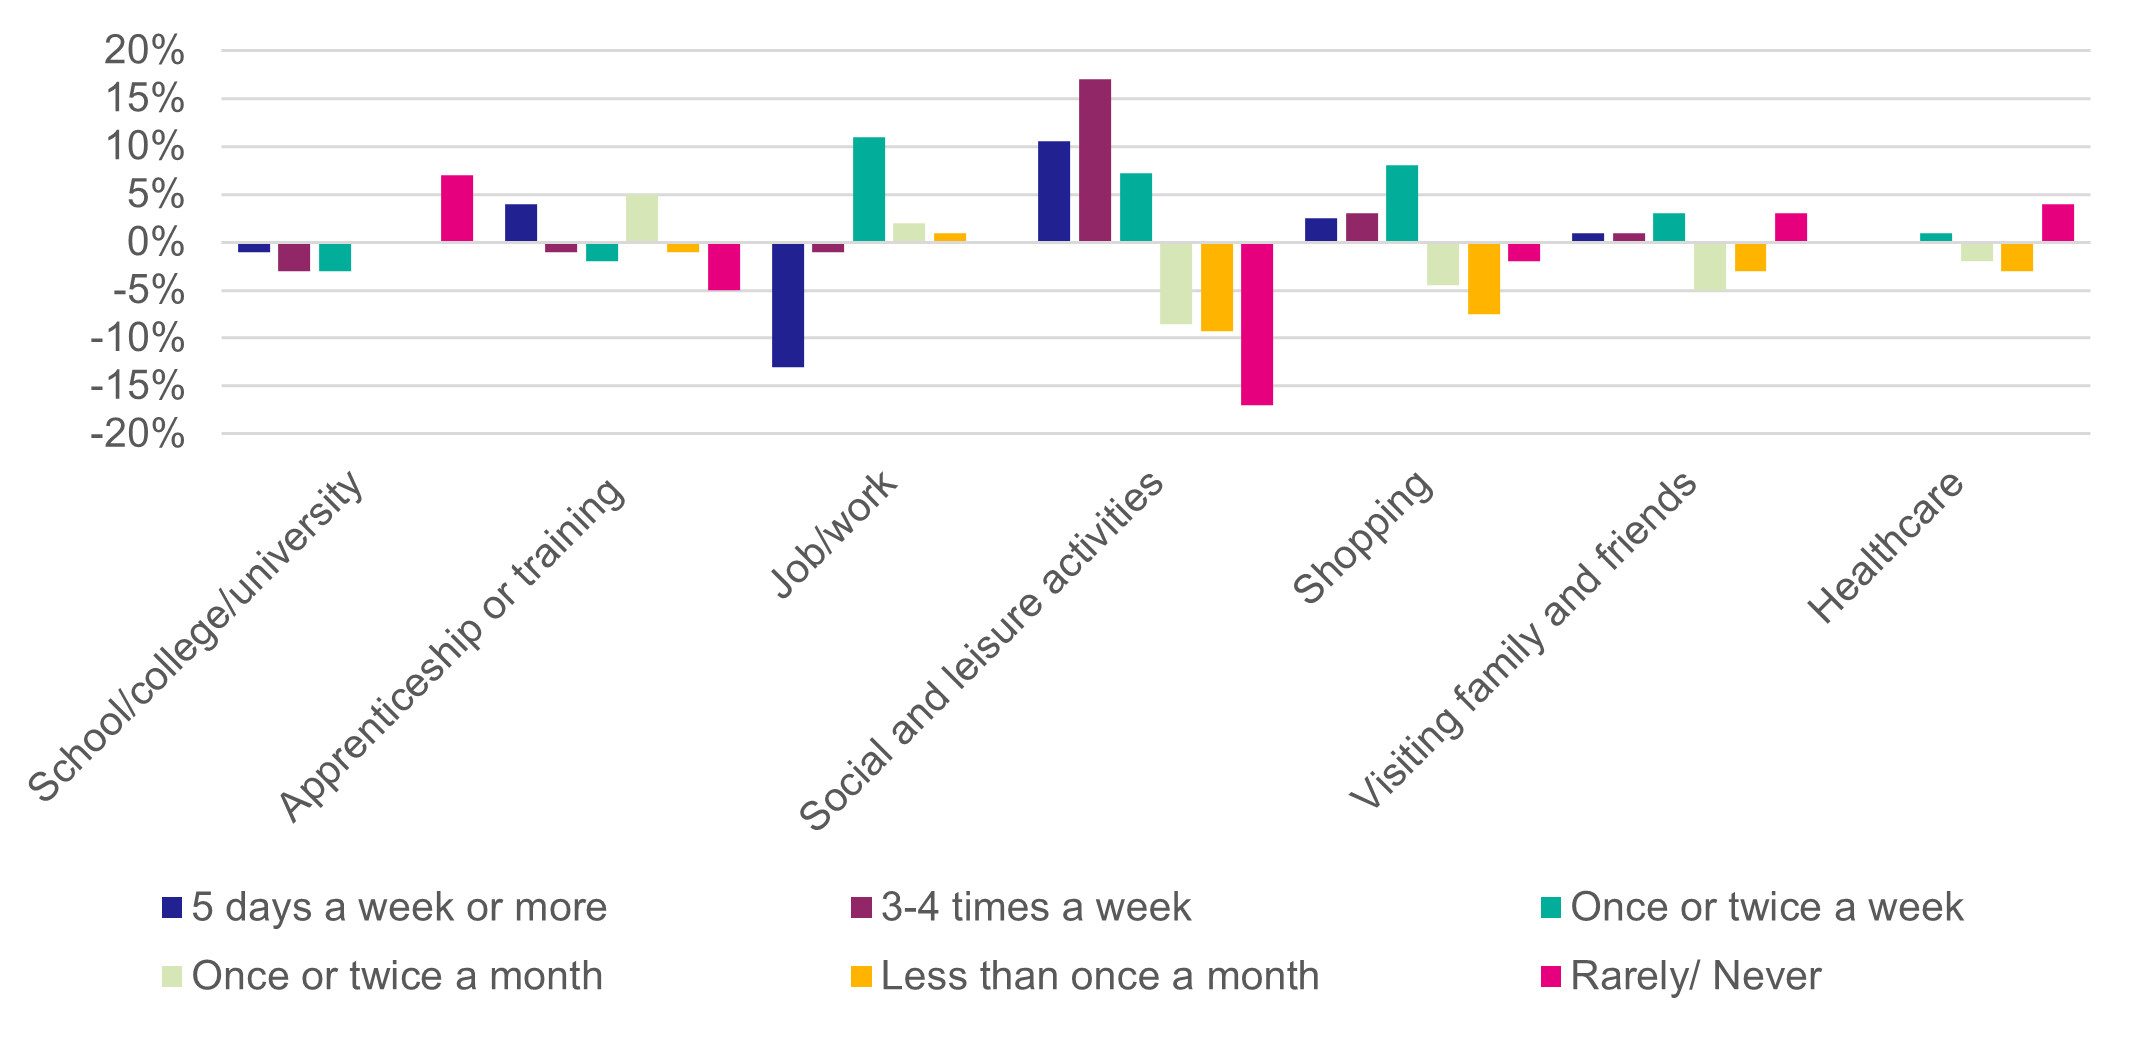
Comparisons between the baseline and follow-up survey suggest that young people were travelling for social and leisure activities, as well as for shopping trips, more often since the introduction of the Young Persons’ Free Bus Travel Scheme (see Table B3 in Appendix B). For these journey purposes, the proportions of respondents travelling at least once a week have increased, while the proportions travelling for social, leisure and shopping activities less than once a week have decreased. The same pattern is observed for those visiting family and friends, albeit to a lesser extent, with the proportions of those visiting family and friends at least once a week increasing, and those travelling once or twice a month, and less than once a month decreasing - however, it should be noted the proportions of respondents travelling rarely or never for this purpose also increased. Changes in the frequency of travel for all other journey purposes were more mixed. Figure 9 outlines the percentage point changes in frequency of travel by journey purpose.
Journey Times
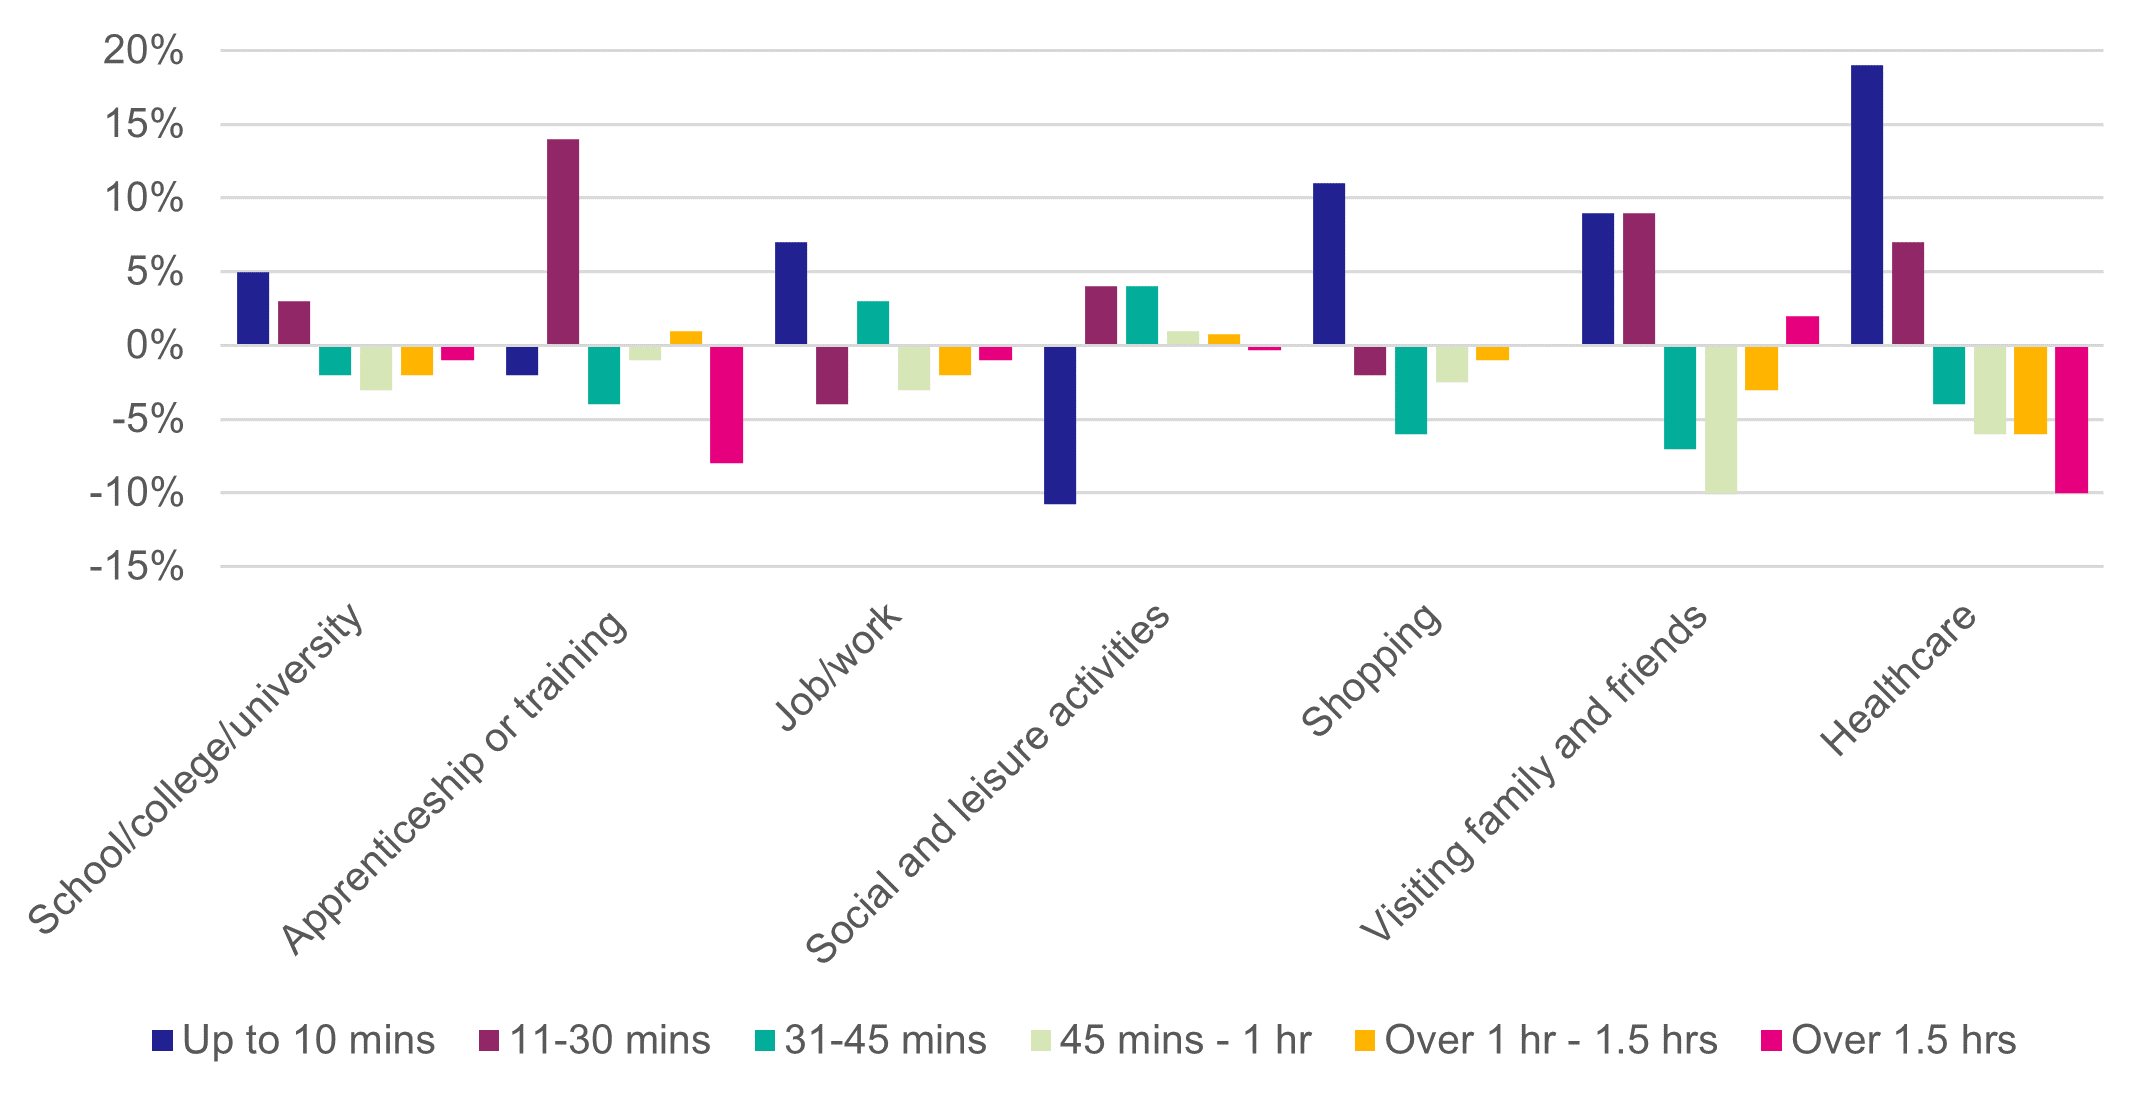
Journey times of 11-30 minutes were the most prevalent for all journey purposes within the follow-up survey, and the majority of journeys took up to 45 minutes (consistent with journeys made in the baseline survey). However, comparisons between the baseline and follow-up survey data suggests there had been an increase in the proportions of young people taking shorter journeys (i.e. those up to 30 minutes) since the introduction of the Young Persons’ Free Bus Pass (see Table B4 in Appendix B).
Journey purposes which showed an increase in the proportion of shorter journey times, while all other times decreased in prevalence or remained fairly static included:
- Shopping, where the proportion of journeys up to 10 minutes increased;
- Education and healthcare, where the proportion of journeys up to 30 minutes increased; and
- Apprenticeship or training programmes, where the proportion of journeys between 11-30 minutes increased.
The proportions of journeys taking 11-45 minutes increased for social and leisure activities. For those travelling for their job/work, the proportion of journeys up to 10 minutes and those 31-45 minutes increased while the proportion of all others decreased. While the proportion of respondents travelling up to 30 minutes increased for those visiting family and friends, so too did the proportion of those travelling over an hour and a half.
Figure 10 details the percentage point difference in journey time by purpose between the baseline and follow-up surveys.
New Journeys vs Those Happening Anyway
The follow-up survey gathered data on the total number of bus journeys made using the Young Persons’ Free Bus Travel Scheme, as well as how many of these journeys would have been made anyway (even if the young person had to pay a fare or use an alternative mode of travel). This allowed the number of ‘new’ journeys to be calculated. While data were requested for the most recent 7 day period, the last month, or since signing up for the scheme (based on frequency of use), this was compared with how long they had been signed up for the scheme, and data factored up to cover the full time period they had been receiving free bus travel. However, caution is required over the accuracy of this number. The nature of the questions involved a number of risks which impact on data quality. Figures presented here are intended to provide an indication around the extent of ‘new’ journeys generated by the scheme and the number of ‘existing’ journeys that are now free for users - they do not represent an accurate measure.
Over one million (n=1,000,952) new bus journeys (i.e. those that would not have been made by any other means) were calculated to have been made by survey respondents since the introduction of the scheme. Meanwhile, just over one million journeys (n=1,023,802) would have been taken regardless of whether the child/young person received free bus travel or not, representing a significant overall cost saving for young people and families.
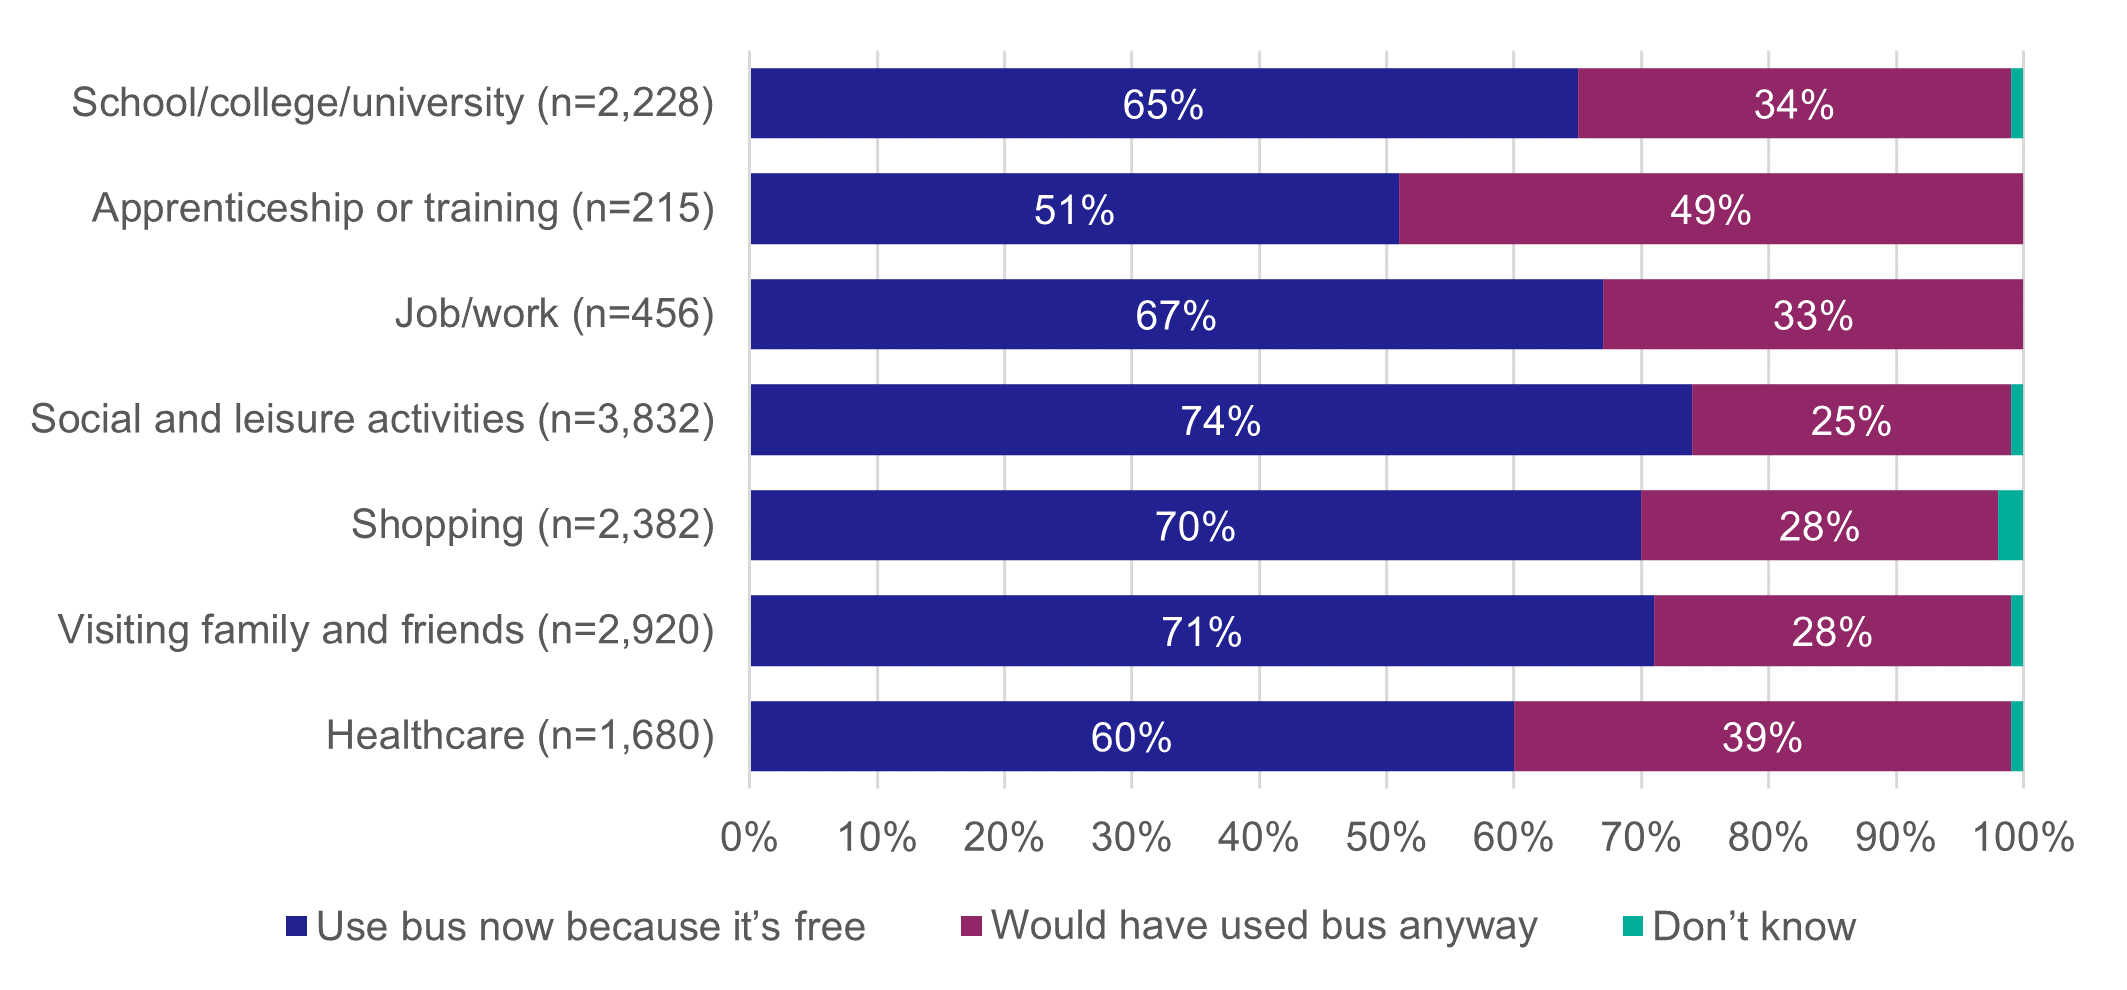
Respondents to the follow-up survey, who used the Young Persons’ Free Bus Travel Scheme, were also asked to indicate whether they used the bus now because it was free, or if they would have used the bus anyway. Figure 11 details the results for those who indicated they used the bus for each journey purpose. Across most journey purposes, the majority of bus users indicated that they used the bus now because it was free, ranging from 60% of those who used it for healthcare to 74% of those using the bus for social and leisure activities. The only exception was for those using the bus to access an apprenticeship or training programme, where around half (51%) used the bus because it was free while the other half (49%) would have used the bus anyway.
Those who used the Young Persons’ Free Bus Travel Scheme were also asked to identify the impact this had on where they went and how often they travelled for each journey purpose. Table 7 outlines the results and shows that across most journey purposes, over two thirds of respondents indicated some form of change to either how often they accessed existing locations and/or accessed new locations (ranging from 68% of those travelling for school/college/university as well as for their job/work, to 81% of those travelling for social and leisure activities). The only exception was for healthcare, where around half (49%) indicated there had been a change in location or frequency of travel.
Those travelling for social and leisure activities were slightly more likely to indicate that they both travel to the same location more often and to new places now (30%). For all other journey purposes, respondents were more likely to travel to the same places but more often.
| Journey Purpose (ALL Scheme Users) | More journeys to same places | Travel to new places | More journeys and new places | No change | Don't know | Total (n) | More journeys and new places: Total |
|---|---|---|---|---|---|---|---|
| School/college/university | 43% | 13% | 12% | 30% | 2% | 3,653 | 68% |
| Apprenticeship or training | 31% | 21.5% | 21.5% | 22% | 4% | 251 | 74% |
| Job/work | 51% | 9% | 8% | 32% | <1% | 636 | 68% |
| Social and leisure activities | 24% | 27% | 30% | 17% | 2% | 6,120 | 81% |
| Shopping | 29% | 19% | 23% | 27% | 2% | 3,780 | 71% |
| Visiting family and friends | 35% | 14% | 23% | 26% | 2% | 4,654 | 72% |
| Healthcare | 33% | 7% | 9% | 45% | 6% | 2,307 | 49% |
Feedback from focus groups also showed that, even where young people reported that they were not necessarily going to ‘new’ places, they still welcomed being able to make journeys more independently and with more frequency:
“Mostly just the things I was doing before but more often… it’s just more easier for me... Sometimes, if my parents are busy or something, I can just tell them I’m going out.” (Scheme User)
Learning to Drive
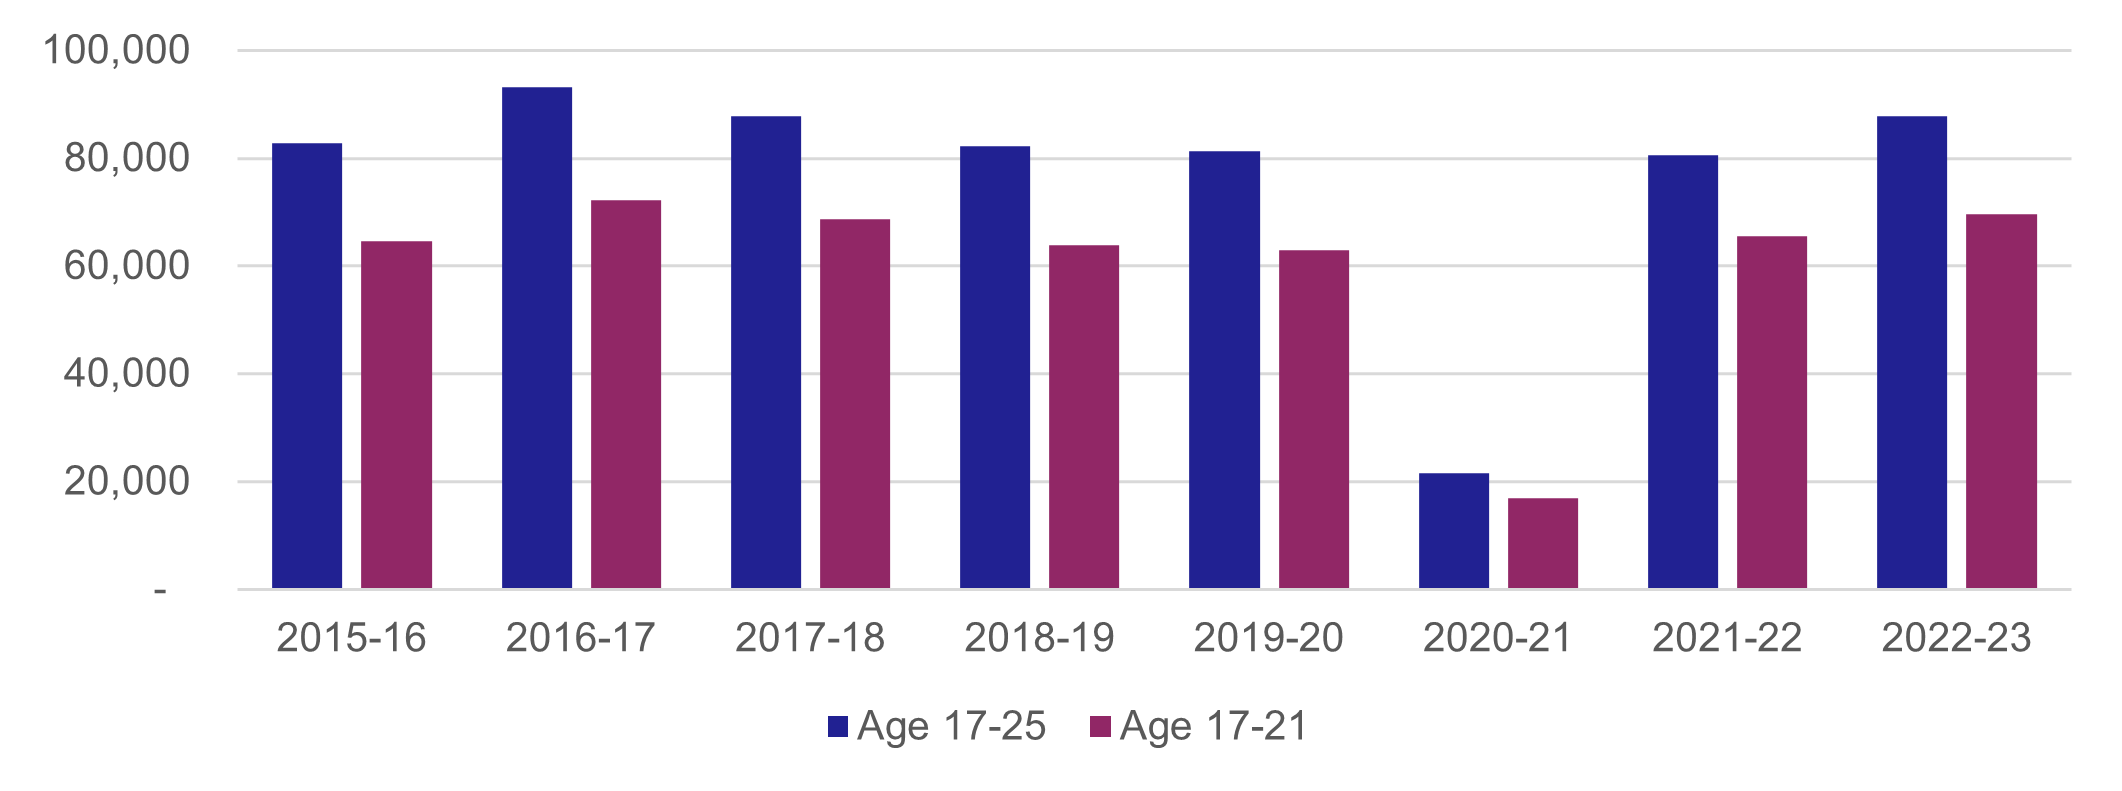
The Driver and Vehicle Standards Agency (DVSA) provides data on the number of tests taken in Scotland for those aged 17-25. The total number of tests taken for this age group, and for those aged 17-21 (i.e. those eligible for the Young Persons’ Free Bus Travel Scheme) shows that test rates have returned to pre-Covid-19 levels, and increased between 2021-22 and 2022-23 (i.e. pre- and post-implementation of the scheme). Figure 12 shows that those aged 17-21 made up the majority of tests taken among the 17-25 age group, with the number of tests taken in 2022-23 (i.e. the first year after the scheme launched) by those aged 17-21 at its highest since 2016-17.
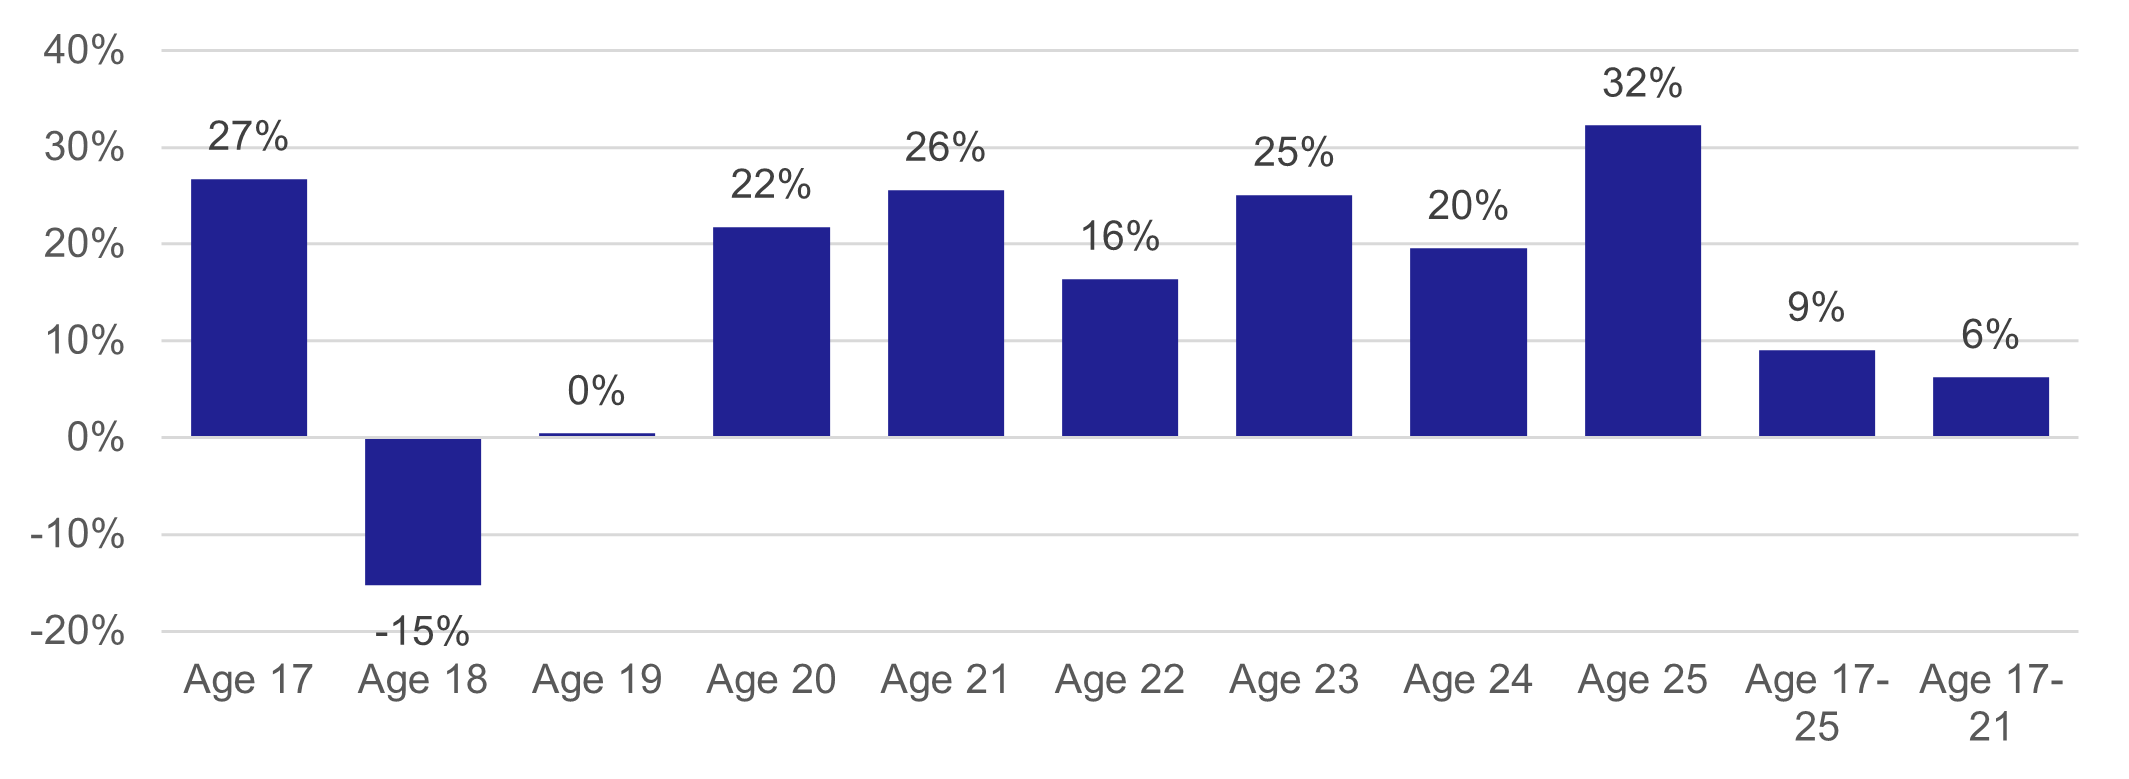
When considering individual age groups, however, the nature and extent of the changes in the number of tests taken varied between the year before and after the introduction of the scheme. Figure 13 shows that the number of tests taken by those aged 17, 20 and 21 increased by around a quarter in the year after the Young Persons’ Free Bus Travel Scheme was introduced. However, there was a 15% decrease in the number of tests taken by those aged 18 and relatively static numbers of tests taken by those aged 19.
Comparison of the baseline and follow-up surveys also indicates an increase in the proportions of young people who either drive or were learning to drive across all ages between 17-20. The only exception was for 21 year olds, where the proportions remained reasonably static.
| Age | Baseline Survey | Follow-Up Survey | Percentage Point Change |
|---|---|---|---|
| Age 17 | 47% | 53% | +6% |
| Age 18 | 50% | 57% | +7% |
| Age 19 | 47% | 55% | +8% |
| Age 20 | 44% | 50% | +6% |
| Age 21 | 56% | 56% | 0% |
| Total (Age 17-21) | 48% | 54% | +6% |
| Age 22 | - | 59% | - |
| Age 23 | - | 50% | - |
While it would appear from the statistical data that the Young Persons’ Free Bus Travel Scheme has not, as yet, had an impact on reducing the numbers of young people learning to drive, caution is required over this assumption. A significant backlog in demand was likely to have been caused by the Covid-19 pandemic, which halted most driving lessons and tests. Current capacity for driving lessons and tests will further impact numbers. It may be that the Young Persons’ Free Bus Travel Scheme has reduced the desire to learn to drive among some young people, but this is not identifiable within the data. In addition, many young people aged 17+ who signed up for the Young Persons’ Free Bus Travel Scheme may have already been taking lessons or have passed their test before the scheme was introduced.
Indeed, those attending the focus groups provided mixed responses in relation to the desire to learn to drive. Some did suggest that they/their child was less enthusiastic about learning to drive and were likely to delay this as a result of the Young Persons’ Free Bus Travel Scheme, either due to cost, environmental concerns, or simply the convenience of bus use. This included some living in rural areas, but with access to buses:
“I think it’s delayed the desire to learn. My son is 17 and is now able to apply for his provisional driving licence, and he literally has said to me, ‘I’m in no rush as I’ve got my free bus pass, I can get anywhere’… It’s definitely holding him off learning to drive.” (Parent/Carer of Scheme User)
“I was going to learn to drive this year, but because I live next to a bus station, I don’t think I’m going to learn to drive any time soon because the bus is just a lot more accessible, and it’s cheaper and it’s a lot more green.” (Scheme User)
“My eldest… he stopped lessons once he got the pass. Because the buses are so frequent, and because he mainly goes to [city] where there is no parking, and also because of the environmental point of view as well, he just said he was going to put it on hold and save the money he would have been spending on driving lessons.” (Parent/Carer of Scheme User)
Some parents also commented that they were less likely to encourage their children to start to learn to drive, mainly due to the cost, both of lessons and the price of insurance for young drivers. Based on estimates outlined by the UK Government, on average, people complete 45 hours of instructor-led driving lessons to pass their test, costing an average of £1,350 to £1,800. This was considered to be unaffordable for many.
In the main, however, parents and young people who attended focus groups reported that they/their children either already drove, were learning to drive, or wanted to learn to drive as soon as they were old enough. This was considered necessary to help them access more opportunities in the future, or to overcome the lack of suitable/any public transport options:
“[My son] was of the view that, from age 17 he’d be learning [to drive]. Again, I think in a more remote area a lot of the kids do try for their test as soon as because it’s a way of getting about when things aren’t as accessible.” (Parent of an Eligible Non-User)
“I want to learn to drive as soon as I can… just because I think everyone should be able to and know how to drive just in case something happens and you can’t take a bus. You should be able to know how to drive.” (Scheme User)
While learning to drive was considered essential for some, many also saw this as a valuable life skill, providing more autonomy, freedom and control.
Environmental Impacts
Young people who attended focus groups spoke about feeling conscious of the environmental benefits of bus travel:
“I feel so much better taking the bus compared to the car because of the greenness and feeling that it is more environmentally friendly.” (Scheme User)
While several 18-21 year olds commented that environmental concerns were in their minds when making travel choices, a few of those at the younger end of the age spectrum were perhaps less driven by environmental concerns in their attitudes towards different modes of transport:
“I don’t really think of the environmental side when I’m thinking of driving… you do a wee bit, but lots of people drive so if it was just me that doesn’t drive it won’t make that much difference.” (Scheme User)
Some parents/carers who attended focus groups also commented (unprompted) on positive environmental impacts and felt that their children’s use of the scheme had encouraged the whole family to consider more sustainable ways of travelling.
Expected Long Term Impact of Travel Choices
Focus group participants (who were users of the scheme) were asked if they thought they/their children were likely to continue to use the bus after they turned 22. For parents and carers, there were mixed responses:
“I think they’ll probably still use it but honestly I think they’ll maybe start thinking about driving again, or maybe the train for speed, but I think if the bus was still evenly priced and frequent, they might still use it.” (Parent/Carer of Scheme User)
“I think my son is quite keen about the environment and so I’d like to think that he would at least think about different ways to travel and not just, you know, use a car. I think he will continue to use the bus for at least some of the time.” (Parent/Carer of Scheme User)
Young people themselves said that, while they would probably continue to use the bus after losing eligibility for the scheme, they felt this use would reduce in frequency, mainly because the cost benefits would disappear, and they could take more efficient or active modes:
“I think I’d probably use it but much less often because there are other modes of transport that are easier and faster.” (Scheme User)
“I probably wouldn’t use it for journeys that could in theory be walked.” (Scheme User)