Current travel patterns
Travel Patterns
Frequency of Travel
Respondents were asked how often they currently travelled for a range of different purposes. Table 5 details the results, and shows that those travelling to education or for an apprenticeship/training programme were more likely to do so daily, those who worked were more likely to travel at least three times a week, while all other activities involved less frequent travel.
| Journey Purpose | At least 5 days a week | 3-4 times a week | 1-2 times a week | 1-2 times a month | Less than once a month | Rarely/ Never | Total |
|---|---|---|---|---|---|---|---|
| School/College/ University | 62% | 15% | 9% | 2% | 1% | 11% | 14,757* |
| Apprenticeship/ Training Programme | 58% | 15% | 16% | 2% | 2% | 7% | 292* |
| Work/Job | 40% | 31% | 16% | 2% | 2% | 9% | 3,502* |
| Sports/Clubs or Other Activities | 6% | 21% | 30% | 7% | 6% | 30% | 17,462 |
| Health Care | 1% | 1% | 3% | 19% | 40% | 36% | 17,462 |
| Grocery Shopping | 2% | 9% | 34% | 14% | 10% | 31% | 17,462 |
| Other Shopping | 1% | 5% | 23% | 33% | 19% | 19% | 17,462 |
| Social Activities (day) | 4% | 12% | 31% | 20% | 12% | 21% | 17,462 |
| Social Activities (evening/night) | 3% | 12% | 26% | 19% | 13% | 27% | 17,462 |
| Day Out for Leisure/ Event | 1% | 3% | 20% | 32% | 22% | 22% | 17,462 |
| Visiting Family/ Friends | 6% | 14% | 32% | 25% | 11% | 12% | 17,462 |
* Note: Only respondents who previously indicated they attended these activities were asked about associated travel patterns, multiple responses were also possible across these activities.
Frequency of Travel - Demographic Analysis
Urban / Rural / Island
- Only minor differences were noted in the frequency with which respondents generally participated in leisure type activities (such as sports/clubs or other activities, non-grocery shopping, and daytime and evening social activities). However, those in towns and rural areas were more likely to report they rarely/never took part in these.
- Across all activities, those living on islands were the most likely to indicate that they only rarely/never participated.
Gender
- Females were less likely than males to travel frequently for sports/clubs or other activities.
- Those who identified as trans, non-binary or in another way were most likely to indicate they rarely/never travel for sports/clubs or other activities, and for days out.
- While still a minority, those who identified as trans, non-binary or in another way were likely to travel more often for health care purposes.
- Males were slightly more likely to indicate that they rarely/never travelled for groceries or other shopping, or did so once a month.
Disability
- Those whose activities were limited due to a health condition were more likely to indicate that they rarely/never took part in certain leisure activities, including sports/clubs or other activities and evening social activities.
- There was little difference for other activities such as non-grocery shopping, daytime social activities, days out, and visiting family/friends.
Income
- Those with household incomes up to £35,000 were more likely to indicate that they/their child rarely/never travelled for sports/clubs or other activities.
- Those with higher incomes travelled for clubs and activities more often.
- As incomes reduced the proportion of respondents who indicated that they rarely/never travelled for a day out increased.
- Those on the lowest incomes (less than £10,000) were more likely to travel for non-grocery shopping once a week or more, and more likely to access daytime social activities at least three times a week, compared to all other income groups.
Where respondents noted that they travelled less than once a month or more, they were also asked to indicate what mode they used and how long their journey took.
Current Mode of Travel
Nearly half (45%) of those travelling to/from education used a bus (either a school bus or service bus), while over a quarter (29%) used active modes (i.e. walking, cycling and scootering). Those travelling to an apprenticeship/training or to work were more likely to use the bus or drive/be driven. For all other activities, the main modes used tend to be to drive/be driven and using the bus. Active modes feature as the main mode for at least 10% across most journey purposes, with the only exceptions being to travel to apprenticeships/training, having a day out for leisure or to attend an event, and for visiting family/friends.
| Journey Purpose | Drive/ Driven | Taxi | Walk/Cycle/ Scoot | School bus | Bus/ Minibus | Train | Other | Total |
|---|---|---|---|---|---|---|---|---|
| School/College/ University | 19% | 1% | 29% | 15% | 30% | 5% | 1% | 13,173 |
| Apprenticeship/ Training | 27% | 3% | 3% | - | 54% | 10% | 3% | 271 |
| Work/Job | 29% | 1% | 11% | - | 51% | 5% | 3% | 3,176 |
| Sports/Clubs or Other Activities | 52% | 1% | 15% | 1% | 27% | 2% | 2% | 12,191 |
| Health Care | 49% | 2% | 15% | <1% | 31% | 2% | 1% | 11,233 |
| Grocery Shopping | 53% | 3% | 16% | <1% | 26% | 1% | 1% | 12,009 |
| Other Shopping | 42% | 1% | 11% | 1% | 37% | 6% | 2% | 14,212 |
| Social Activities (day) | 33% | 1% | 21% | 2% | 37% | 4% | 2% | 13,778 |
| Social Activities (evening/night) | 42% | 5% | 12% | <1% | 33% | 6% | 2% | 12,734 |
| Day Out for Leisure/Event | 44% | 1% | 5% | 1% | 36% | 11% | 2% | 13,695 |
| Visiting Family/ Friends | 51% | 1% | 9% | 1% | 30% | 6% | 2% | 15,418 |
Mode of Travel - Demographic Analysis
Urban / Rural / Island
- Those living in cities were less likely to drive/be driven across all journey purposes.
- Those in rural areas and on the islands were generally more likely to drive, and less likely to use the bus - this is consistent with results from the Scottish National Islands Plan Survey (2020), where 71% of those aged 18-35 used the bus once a year or less, or never.
- Those in rural (mainland) areas were less likely to walk/cycle/scoot.
Gender
- Those who identified as trans, non-binary and other were less likely to drive/be driven and more likely to travel by bus to education, and to take part in sport/clubs or other activities. They were also less likely to drive/be driven and more likely to walk/cycle/scoot across all other journey purposes. Further, they were more likely to use the bus for evening social activities.
- Males were slightly more likely to walk/cycle/scoot to education.
- Females were more likely to drive/be driven to work, while males were more likely to choose an active mode.
- Females were the least likely to walk/cycle/scoot for daytime social activities
Disability
- Those whose activities were limited by a health condition or disability were less likely to travel to education by active modes and more likely to use the bus, compared to those whose activities were not limited.
- For most other journey purposes, those whose activities were limited were less likely to drive/be driven and more likely to travel by bus.
Income
- As income rose so too did the likelihood that children/young people would travel to education via walking/cycling/scootering.
- Similarly, as incomes rose so too did car use across a range of other journey purposes (up to incomes of £100,000 at least).
- As incomes decreased however, bus use increased across most journey purposes - indeed, those on the lowest incomes were the most likely to use the bus across all purposes.
The secondary data analysis considered travel to school data (Hands Up Survey Data 2015-20, Scottish Household Survey 2015-19), as well as reasons for transport choice to children’s full time education establishment from 2015 to 2019 (Scottish Household Survey 2015-19).
Both the Hands Up Survey and the Scottish Household Survey showed that around half of pupils used active modes to travel to school between 2015 and 2020, compared to around a quarter who were driven and between 14% and 21% who used the bus. However, the difference in the age of survey respondents should be noted between the Hands Up Survey and Scottish Household Survey (both focused on school only) and the current research (age 5-21). The Scottish Household Survey also showed that buses scored highly (39%) as being the most convenient method of travel for school compared to other modes. Comparisons between the current survey results and the Scottish Household Survey 2019 data also suggest that this younger cohort are more reliant on bus travel to access their place of employment compared to the general adult population (51% in this survey used bus for work, compared to only 10% in the 2019 Scottish Household Survey who were more likely to travel by car (63%)).
Journey Times
Table 7 below outlines the time it takes respondents to travel to each destination. This shows that, to access education, sports/clubs/other activities, health care, grocery shopping, daytime social activities, at least three quarters of young people were travelling for up to 30 minutes. For all other journey purposes, it was more likely that young people would travel up to an hour.
| Journey Purpose | Up to 10 minutes | 11-30 minutes | 31-45 minutes | 46 minutes-1 hour | 1-1.5 hours | Over 1.5 hours | Total |
|---|---|---|---|---|---|---|---|
| School/College/ University | 28% | 42% | 14% | 9% | 5% | 2% | 13,059 |
| Apprenticeship/ Training Programme | 8% | 29% | 25% | 21% | 7% | 10% | 271 |
| Work/Job | 15% | 43% | 17% | 17% | 7% | 1% | 3,123 |
| Sports/Clubs or Other Activities | 22% | 53% | 17% | 6% | 1% | 1% | 11,982 |
| Health Care | 32% | 44% | 13% | 7% | 3% | 1% | 11,122 |
| Grocery Shopping | 31% | 48% | 15% | 5% | 1% | <1% | 11,869 |
| Other Shopping | 14% | 45% | 23% | 12% | 4% | 2% | 14,031 |
| Social Activities (day) | 18% | 49% | 20% | 9% | 3% | 1% | 13,546 |
| Social Activities (evening/night) | 15% | 49% | 22% | 10% | 3% | 1% | 12,533 |
| Day Out for Leisure/ Event | 5% | 29% | 27% | 22% | 11% | 6% | 13,523 |
| Visiting Family/ Friends | 13% | 36% | 19% | 12% | 9% | 11% | 15,238 |
Journey Times - Demographic Analysis
Urban / Rural / Island
Those in rural areas often (but not always) appear to have to travel for longer across many of the journey purposes compared to their peers in urban areas, towns, and on islands.
Disability
Those whose activities were limited due to a health issue often appear to have longer journey times across most journey purposes.
Income
Those on the lowest incomes often reported longer journey times across most journey purposes.
The secondary data analysis considered the duration of journeys made between 2015 and 2019 (data held by Transport Scotland), and showed that the majority of trips (65%) last between 5 to 20 minutes. In addition, the percentage of journeys by road network and main mode of travel was examined, and showed that over half (58%) of all bus journeys were between 2km to under 10km, which roughly translates to between 6 and 30 minute journey times.
Impact of Covid
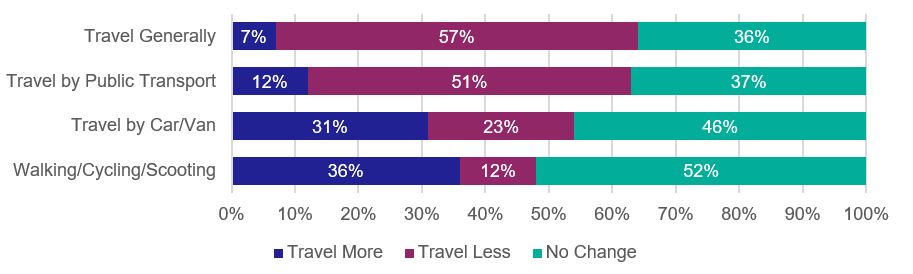
All respondents were asked the ways in which COVID-19 had changed their/their child’s travel behaviour, and how they thought this behaviour might change again when all COVID-19 restrictions had been eased. Figures 2 and 3 outline the results.
Generally, the results show that over half of the respondents indicated that they were travelling less, both in general (57%) and by public transport (51%) as a result of the COVID-19 pandemic. For both travel by car/van and by active modes (such as walking, cycling and scootering), travel was considered to have either stayed the same (46% and 52% respectively) or had increased (31% and 36% respectively).
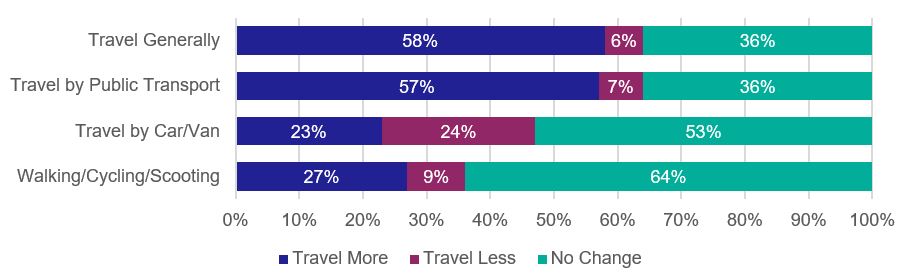
However, once COVID-19 restrictions are eased, most respondents suggested their/their child’s general travel and travel by public transport will either increase (58% and 57% respectively) or remain the same (36% in both cases). Only a small minority expect that these types of travel will decrease (6% and 7%). Travel by car/van and active modes were expected to remain largely the same (53% and 64% respectively), or to increase albeit for a lower proportion of respondents (23% and 27% respectively). Again, walking/cycling/scootering was only considered likely to decrease by a minority of respondents (9%), although nearly a quarter (24%) expected that car/van use would decrease once COVID-19 restrictions were eased.
Impact of Covid - Demographic Analysis
Urban / Rural / Island
- Those living in urban areas were more likely to be travelling more by public transport and active modes as a result of COVID-19, and expected travel by these modes to increase upon the easing of restrictions.
- Those living in rural areas and on islands who were more likely to say that travel patterns remained unchanged and were likely to stay the same going forward.
Gender
- Females were more likely to be travelling by private vehicle more often due to COVID-19.
- Those who identified as trans, non-binary or in another way were more likely to be travelling less often by car, and more likely to be travelling more often by public transport.
- Males were the least likely to think they would travel more by public transport when the restrictions eased.
Disability
- Those whose activities were limited due to a health condition were more likely to be travelling less often, both in general and by each mode, as a result of the COVID-19 pandemic.
- Once restrictions are eased, those whose activities were limited were more likely to indicate that they would travel more by public transport, and more likely to say they would travel more and less often generally (by both private vehicle and by active modes compared to those whose activities were not limited).
Income
- Those on the lowest incomes (less than £10,000) were more likely to be travelling more, both generally and by public transport, and were less likely to be travelling more by private vehicle, compared to other income groups as a result of the COVID-19 pandemic.
- Once restrictions ease, those in lower income groups were more likely to state they would travel more by active modes.
Travel Spend
Discounted Travel
All respondents were asked if they/their child currently used any discounted or free travel (other than child fares). Just over one in five (21%, n=3,581) said they did.
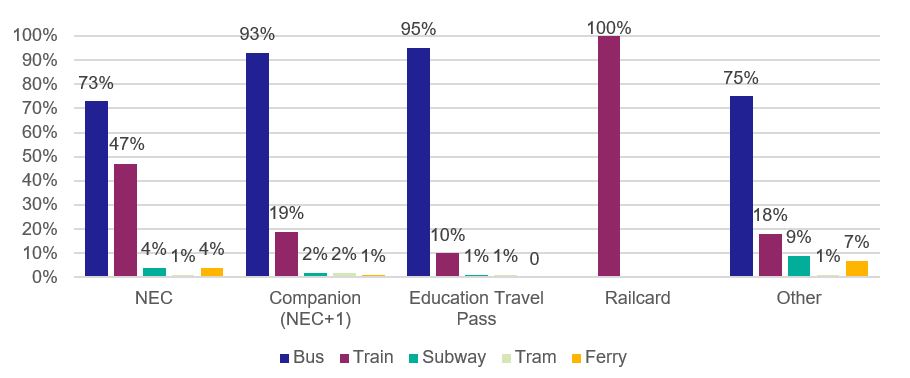
Of the 3,546 respondents who went on to detail the type of card and mode of transport they used, 62% indicated they had a National Entitlement Card (NEC), while 35% had a travel pass issued by their school, college or university (see Table 8). With the exception of the railcard, most respondents used their discount/free travel options on board buses (ranging from 73% for the NEC to 95% of those using an education issued card).
| Type of Discount Card | Number | Percent of Cases |
|---|---|---|
| National Entitlement Card | 2,193 | 62% |
| Companions (+1 on NEC) | 340 | 10% |
| Education Travel Pass | 1,231 | 35% |
| Railcard | 809 | 23% |
| Other Discounted/Free Travel | 436 | 12% |
| Total* | 3,546 | 100% |
* Multiple responses were possible at this question.
The secondary data analysis also examined figures on possession of a concessionary fare pass from 2015 to 2019 by age group (Scottish Household Survey 2009-2019). Adults aged 65+ had the highest percentage and average percent (91%) with a concessionary fare pass. Adults aged 16-60 had significantly lower concessionary fare pass percentages (28%), taken from a sample size of 9,780. This data will no doubt evolve as the Young Persons’ Free Bus Travel scheme is introduced.
Spend on Travel
Parents/carers were asked to estimate their total household spend on travel expenses per month, as well as to identify what proportion of that was spent on their child (who was the subject of the questionnaire). In total, 9,313 respondents provided spend details at both questions, with the breakdown of results shown in Table 9. Generally, those with the lowest total household spend on travel also tended to spend a lower proportion of this on their child, however, the proportion allocated to the child’s travel expenses rose as the total household spend increased.
| Percent Spent on Child | Total Household Spend | |||||
|---|---|---|---|---|---|---|
| £0-£10 | £11-£25 | £26-£50 | £51-£75 | £76-£100 | >£100 | |
| <10% | 69% | 37% | 23% | 18% | 19% | 16% |
| 10%-25% | 22% | 37% | 37% | 36% | 34% | 34% |
| 26%-50% | 4% | 12% | 23% | 26% | 26% | 29% |
| 51%-75% | 1% | 5% | 9% | 14% | 15% | 16% |
| 76%-100% | 4% | 9% | 8% | 6% | 6% | 5% |
| Total (n) | 272 (3%) | 532 (6%) | 1312 (14%) | 1479 (16%) | 1771 (19%) | 3947 (42%) |
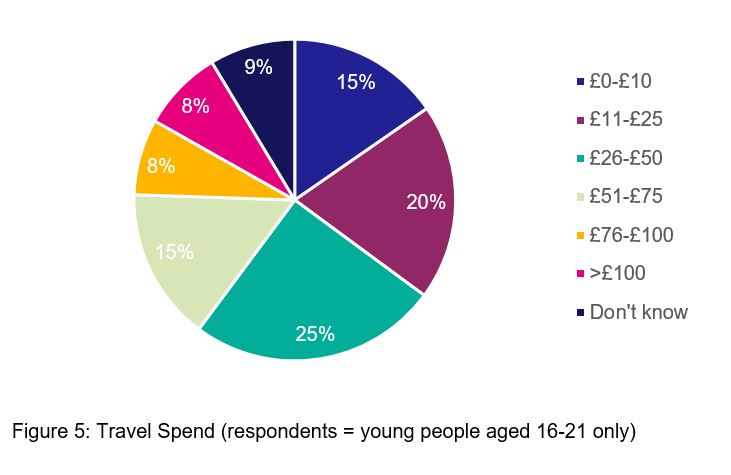
Young people aged 16-21 who responded to the survey themselves were also asked to identify their monthly spend on travel expenses. In total, 1,843 respondents provided a response, with just under half (45%) indicating that they generally spent between £11 and £50 on travel per month (analysis of this question was based on unweighted data as only one age group responded).
Travel Spend - Demographic Analysis
Urban / Rural / Island
- Parents/carers from rural areas and those living on islands were more likely to be spending £100+ each month on household travel compared to those living in urban areas and towns.
- Differences in proportion of spend on the child's travel, however, were not statistically significant.
- Young people (who completed the survey themselves) living on islands were more likely to be spending £0-£10, while those living in mainland rural areas were more likely to be spending £100+ on their travel.
Disability
- Parents/carers of those whose activities were limited by a health issue were less likely to spend £75+ on household travel and transport, and more likely to be spending 51% and over on their child’s travel expenses compared to those whose activities were not limited.
- Young people whose activities were limited (and participated in the survey themselves) were more likely to indicate they spent up to £50, while those who were not limited were more likely to spend over £50 on their travel.
Income
- Parents/carers in lower income households were likely to spend less on household travel and transport, and were significantly less likely to spend £100+ on travel each month compared to higher earning households.
- As income reduced, the proportions that were spent on their child’s travel tended to increase, with those on lower incomes less likely to spend <10% on this, and more likely to spend 51%+ compared to other income groups.
In terms of passenger revenue on local bus services, the secondary data analysis showed an overall decline between 2015 and 2019, of £37 million (Source: DFT Bus Statistics). Scottish Government support (which included the Bus Service Operators Grant, Concessionary Bus Travel and Local Authority gross costs incurred in support of bus services) had increased 8% over the four years to 2019.
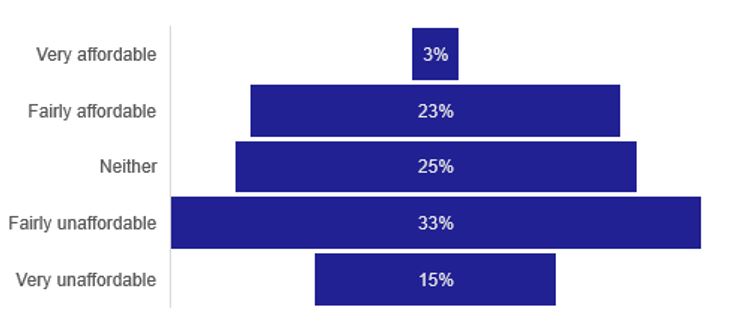
All respondents were asked to rate how affordable or unaffordable they find travel and transport. Of the 16,601 who provided a rating, nearly half (48%) indicated they find this generally unaffordable, compared to around a quarter (26%) who find it generally affordable.
Affordability - Demographic Analysis
Urban / Rural / Island
- Those in cities and living on islands were more likely to find travel and transport affordable and less likely to consider it as unaffordable compared to those living in towns and rural areas.
Disability
- Those who were limited in their activities due to health reasons were less likely to find travel and transport affordable and more likely to consider it as unaffordable.
Income
- Those in lower income groups were less likely to find travel and transport affordable and more likely to consider it as unaffordable.
Difficulty Accessing Activities/Opportunities
All respondents were asked if they felt there were any activities or opportunities that they/their child missed out on due to access or travel restrictions. Of the 17,415 who answered the question, 29% (n=5,066) said there was.
Accessing Activities/Opportunities - Demographic Analysis
Urban / Rural / Island
- Those in rural areas and living on islands were more likely to indicate that they/their child missed out on activities/opportunities.
Gender
- Those who indicated that they/their child identified as trans, non-binary or in another way were only slightly more likely to indicate that they/their child missed out on activities/opportunities.
Disability
- Those whose activities were limited due to a health issue were more likely to indicate that they/their child missed out on activities/opportunities.
Income
- Those with household earnings up to £50,000, were more likely to indicate that they/their child missed out on activities/opportunities.
Respondents who indicated that they/their child was missing out on activities or opportunities due to access or travel restrictions were invited to detail what they felt they missed out on and why. In total, 3,888 respondents provided a response.
Many noted that they/their child missed out on social, leisure and sporting activities, detailing a wide range of specific clubs/classes and venues which they felt they missed out on, as well as not being able to visit/spend time with friends and family. This was noted to impact upon their levels of independence, while a few respondents felt this also impacted their mental health. There was also some evidence that work and educational opportunities, as well as the ability to access/attend support and respite groups, were limited by travel and transport. A few respondents also noted that this had an impact on their ability to attend health appointments (hospital, doctor and dentist appointments):
Cost of public transport limits the location of the jobs I can apply for.”
[Missing out on] Extra-curricular activities. Socialise with friends. Reduced level of independence.”
Bus service from my village is very limited. It is having an impact on social activities which has an impact on positive mental health.”
The cost of travel and transport was noted as being a key reason why some children/young people were missing out on opportunities - this included social/leisure activities as well as educational, work opportunities and support/respite services. This was both an issue in general, and where journeys would require multiple connections to reach a necessary/desired destination. For some this meant only more local activities/opportunities could be accessed, or there was an impact on how frequently they could attend social/leisure/work/educational activities/venues, while for others it meant they could not attend some/all such opportunities, including not applying for jobs in certain areas due to the costs associated with getting there:
Apprentices are on low wages so if my child can't get a lift he walks as public transport eats in at his already low wage. Earning just over £4 an hour means transport is a stretch.”
Jobs and clubs… it's £8 for a day ticket. I can't afford that. And because I can't afford to travel I can't get a job to afford to travel.”
Expensive to afford travel out of local area. Don't travel far due to cost.”
He used to go to clubs and after school things but had to cut back as I couldn't afford the bus fare… I just couldn't afford it so he had to stop going to some things.”
In addition, a lack of reliable public transport services or there being no public transport options available, limited journey times and frequencies were also noted as key reasons why children/young people’s opportunities were seen to be limited - this was again noted to impact upon social/leisure, educational and employment opportunities. It was suggested therefore, that the provision of free bus travel would not support all children/young people equally:
Due to lack of bus services my son is unable to engage in social and leisure activities. He is also unable to gain employment.”
[Missing out on] Education due to poor transport links for college start times.”
Because of where he lives… he needs a car to take him wherever. Few buses pass this route so free travel isn’t a help for him and his sister.”
< Previous | Contents | Next >