Introduction
Background
In 2020, the Scottish Government announced plans to introduce free bus travel to those resident in Scotland aged under 19. Following an extensive public consultation exercise a further commitment to extend this offer to those aged under 22 was announced in 2021. Up to 930,000 young people across Scotland are eligible for the scheme, which is expected to deliver the following objectives:
- embedding positive sustainable travel behaviours;
- opening up social, education, employment and leisure opportunities; and
- reducing household outgoings to aid children, particularly those living in poverty.
The Young Persons’ Free Bus Travel scheme was implemented on 31 January 2022 and applications could be made from 10 January onwards. All young people and children aged 5-21 years old and resident in Scotland can apply for a card to access free bus journeys (or in some cases can download a travel product to an existing card). The scheme provides free travel on any bus in any part of Scotland, with young people able to travel on buses both locally, and outside the area they live - although a few services, such as premium-fare night buses and City Sightseeing buses, are not included within the free travel scheme.
Evaluation of the Young Persons’ Free Bus Travel Scheme
In line with other travel/transport schemes, Transport Scotland are conducting process, impact and outcome evaluations of the Young Persons’ Free Bus Travel scheme. These will assess the short, medium and long term impacts of the scheme by comparing conditions at different stages. The evaluation work will consist of:
a baseline study - this will establish current travel behaviour and seek to understand the attitudes and perceptions of young people towards travel. This will be conducted before the scheme is implemented;
stage 1 evaluation - work will take place up to a year after implementation to consider the short to medium term impacts and outcomes of the scheme, as well as to provide insights into how the policy is working in practice; and
stage 2 evaluation - work will take place up to five years post-implementation. This will focus on longer-term impacts and outcomes.
Wellside Research Ltd. (an independent social research consultancy), supported by Stantec (a transport planning consultancy), were appointed to undertake the baseline exercise. Work was conducted between November 2021 and February 2022, with the primary data collection taking place between 6 December 2021 and 24 January 2022 (prior to the start of the scheme). This report outlines the baseline study findings.
Logic Model
A logic model for the Young Persons’ Free Bus Travel scheme was created by the research team (Wellside and Stantec) to support the development of the baseline data collection. It is based on a logic model used to design the overall evaluation of the scheme.
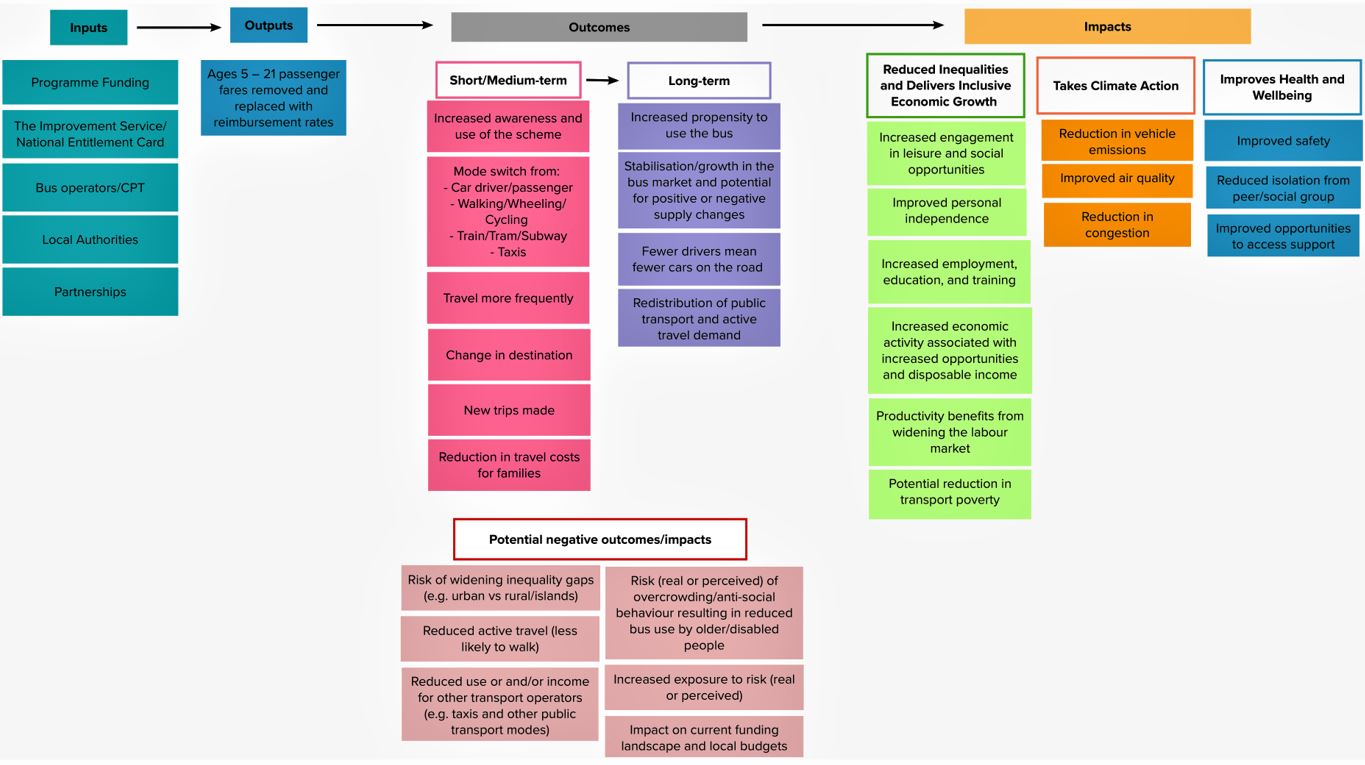
The main components of the logic model are described in more detail below and shown in Figure 1. Each component is related, for example, if the scheme is delivered as intended (output), then the expected changes in travel behaviour (outcomes), should lead to a positive impact on individuals and society (impacts).
Context: the transport problems and opportunities which the Young Persons’ Free Bus Travel scheme is seeking to address. This effectively forms the rationale for proceeding with the intervention i.e. the ‘case for change’ which underpins the business case:
- young people are likely to face financial barriers to accessing bus travel
- lack of accessibility reduces employment, education and social opportunities for young people (exacerbating inequality)
- the use of private vehicles is a significant contributor to climate change. Bus offers a greener, more sustainable travel choice
- low income households face cost barriers to travel and/or can’t afford to travel with children
Input
The investment and processes required to deliver the Young Persons’ Free Bus Travel scheme. This includes: the bus operators, National Entitlement Card, Local Authorities, other partners, and back office technology and activities required to deliver the scheme together with the cost of delivery.
Outputs
Young people aged 5-21 are provided with a valid travel pass allowing them free travel on-board buses across Scotland.
Outcomes
Changes in travel behaviour which result from the Young Persons’ Free Bus Travel scheme:
Short/Medium-term
- Increased awareness and use of the scheme.
- Mode switch from: Car driver/passenger; Walking/Wheeling/Cycling; Train/Tram/Subway; Taxis.
- Travel more frequently, changes in destination, new trips made.
- Reduction in travel costs for families.
Long-term
- Increased propensity to use the bus.
- Stabilisation/growth in the bus market and potential for positive or negative supply changes i.e. new bus routes/connections/improved frequency as a result of increased demand and decrease in connections/frequency due to reduced commercial viability of services.
- Fewer drivers means fewer cars on the road and a redistribution of public transport and active travel demand.
Impacts
Individual and societal changes which occur as a consequence of the Young Persons’ Free Bus Travel scheme, and are expected to contribute to the National Transport Strategy’s Vision (Reduces Inequalities, Deliver Inclusive Economic Growth, Takes Climate Action, Improves Health and Wellbeing) in the following ways:
Reduced Inequalities and Delivers Inclusive Economic Growth
- Improved personal independence.
- Increased engagement in leisure and social opportunities, and increased opportunities in employment, education, and training.
- Increased economic activity associated with increased opportunities and disposable income resulting in productivity benefits from widening the labour market.
- Potential reduction in transport poverty.
Takes Climate Action
- Reduction in vehicle emissions and improved air quality
- Reduction in congestion
Improves Health and Wellbeing
- Improved safety
- Reduced isolation from peer/social group
- Improved opportunities to access support services and social opportunities.
Potential negative outcomes/impacts
There are also a number of unintended consequences that could be a result of introducing the scheme. These outcomes/impacts will be monitored and evidenced as part of the evaluation, and include the following:
- Risk of widening inequality gaps (e.g. urban vs rural/islands)
- Reduced active travel (less likely to walk)
- Reduced use or and/or income for other transport operators (e.g. taxis and other public transport modes)
- Risk (real or perceived) of overcrowding/anti-social behaviour resulting in reduced bus use by older/disabled people
- Increased exposure to risk (real or perceived) of anti-social behaviour or harassment
- Impact on current funding landscape and local budgets
The logic model was used to guide the development of the baseline data collection, identifying the evidence required to address each of the potential outcomes and impacts, as well as which elements could be addressed using secondary data sources and where bespoke survey data would be required to fill data gaps.
Methodology
Baseline data collection was undertaken in order to provide pre-implementation travel pattern data (as outlined below). This will facilitate future evaluations to establish whether the Young Persons’ Free Bus Travel scheme has achieved its objectives and delivered the desired benefits to young people.
Mixed methods were employed, including an online survey, development of counterfactual data, and secondary data analysis - each of which is outlined below.
Online Survey
An online survey was conducted with children, young people and their parents. The survey aimed to capture the current travel habits of children and young people (before the free travel was introduced), and sought feedback on the impact of COVID-19 on travel behaviours, perceptions of bus travel and any barriers faced, as well as awareness, perceptions and expected use of the free bus travel.
Directors of Education were asked to support the promotion of the online survey through schools, with schools requested to circulate an invitation email and survey link to parents. The survey was also promoted to College and University students via the Higher Education Institution (HEI) Trickle page (an internal platform for communicating with colleges and universities across Scotland). Wider promotion was also undertaken with appropriate agencies including Young Scot and Skills Development Scotland advertising the survey to their members. While young people aged 12+ were able to complete the survey themselves, those aged 5-11 needed a parent to complete this on their behalf - parents were also able to respond on behalf of older children as well. As this was a self-completion based survey, all respondents were self-selecting, and no quotas for particular respondent typologies were applied (although weighting was utilised in the analysis to adjust any over/under-representation - this is discussed under ‘Survey Analysis’ below).
The survey ran for seven weeks, from 6 December 2021 to 24 January 2022.
Counterfactual Data
In addition to understanding current travel patterns, the research aimed to establish counterfactual data in order to determine the extent to which any future impacts were driven by the Young Persons’ Free Bus Travel scheme rather than other factors. A range of options were considered and discounted however, including:
- Those age 5-21 not eligible for the provision - as the free travel provides a universal benefit to all those aged 5-21 across the whole of Scotland, such a control group was not available.
- A sample from other age groups - they are distinctly different from those aged 5-21, and they too may be impacted by the scheme (e.g. older bus users who may experience capacity issues). Therefore, any survey would also be measuring impacts of the scheme rather than providing a true control group.
- An equivalent survey of those aged 5-21 in England or Wales - different local and national policy context, the extent and nature of transport provision, and potential existing subsidies would differ from the Scottish context, and it would be impossible to control for any potential issues or incentives which may impact on bus use in the counterfactual area.
It was agreed that the most reliable method to gather counterfactual data was to include questions within the online survey to determine the extent to which travel patterns would change as a result of the Young Persons’ Free Bus Travel scheme. This can be compared with any future post-implementation survey results to determine whether expectations were realised, and the extent to which the free travel was a determining factor in any changes. This approach also has limitations, however. For example, other external factors could be influential in changing travel patterns, and so this will need to be accounted for in any comparisons of pre- and post-implementation data.
Secondary Data
In addition to the primary data collection, a wide range of secondary data sources were also reviewed and analysed. This included data from the following sources:
- Scottish Household Survey;
- Census Data;
- Scottish Transport Statistics;
- Data provided by the Scottish Government on youth card journeys;
- Travel to School Hands Up Survey; and
- Driver and Vehicle Standards Agency (DVSA).
An extensive exercise was undertaken collating and analysing 96 individual data sets. Where data was available, time series analysis was undertaken which tracked trends on each dataset over time. This analysis will be important for future evaluations Transport Scotland undertake of the Young Persons’ Free Bus Travel scheme.
Data can be considered to fit within the following categories:
- Main mode of travel;
- Journey purpose and reasons for transport choice;
- Distance travelled and journey times;
- Car availability, driving tests, holders of driving licenses and driving frequency;
- Bus usage and operating data;
- Public views of transport services; and
- Concessionary fare passes.
Sample Profile
In total, 17,462 responses were received from the online survey. Of these, 76% (n=13,303) were submitted by parents responding on behalf of their child, and 24% (n=4,159) were submitted by young people themselves. Responses represented the views and experiences of:
- 6,187 (36%) age 5-11;
- 7,729 (44%) age 12-15; and
- 3,546 (20%) age 16-21.
Responses were received from all local authority areas, although this ranged from 1,998 (11%) responses from Aberdeen City Council area and less than 10 (>1%) from respondents in Orkney. A full breakdown of responses by local authority is included at Appendix A. A good range of responses were also provided from across urban and more rural areas (see Table 1).
| Location | Number | Percent |
|---|---|---|
| A city | 5,497 | 32% |
| A town | 6,857 | 39% |
| A village/the countryside | 4,705 | 27% |
| Not disclosed | 403 | 2% |
| Total | 17,462 | 100% |
Those age 16+ were asked to identify whether they were in education, training or work (multiple responses were possible to this question). Nearly three quarters (73%, n=2,571) were at school, while around a quarter worked (28%, n=980) or were in college/university (24%, n=852). When school pupils aged 5-15 were included, and those aged 16+ allocated to their main sector (where respondents were in school, college/university, or an apprentice/in training, and worked a part-time job, the educational/training sector was allocated as their main sector), responses largely represented the views and experiences of school pupils (94%, n=16487).
| Education/Training/Work | Number | Percent of Cases |
|---|---|---|
| In school | 2,571 | 73% |
| In College/University | 852 | 24% |
| Apprentice/In Training | 120 | 3% |
| In work (including full-time, part-time and voluntary) | 980 | 28% |
| Not in education/training/work | 68 | 2% |
| Base | 3,546 | 100% |
| Education/Training/Work | Number | Percent |
|---|---|---|
| In school | 16,487 | 94% |
| In College/University | 665 | 4% |
| Apprentice/In Training | 79 | >1% |
| In work (including full-time, part-time and voluntary) | 166 | 1% |
| Not in education/training/work | 65 | >1% |
| Base | 17,462 | 100% |
* Multiple responses were possible at this question.
Respondent Demographics
Half of the achieved sample represented the views and experiences of females (50%, n=8,745), 46% (n=7,990) of males, 1% (n=257) identified as either trans (where a person’s sense of personal identity and gender does not correspond with their birth sex ), non-binary (where a person does not define their gender in terms of traditional binary oppositions, such as male and female), or in another way, and 3% (n=470) did not disclose this information.
Around three quarters of all respondents (76%, n=13,202) identified as being from a white ethnic background, while 9% (n=1,614) were from black and minority ethnic backgrounds. A further 15% (n=2,646) did not disclose their ethnic group.
Only those respondents aged 16+ (or parents responding on their behalf) were asked about sexual orientation. Of the 3,546 respondents in this age cohort, 73% (n=2,590) indicated they were straight/heterosexual, 12% (n=430) indicated they were either gay/lesbian, bisexual or had another sexual orientation, and 15% (n=526) did not disclose this information.
Respondents were also asked whether their/their child's day-to-day activities were limited because of a health problem or disability which had lasted, or was expected to last, at least 12 months. Most (87%, n=15,199) noted they did not have such limitations, while 3% (n=493) said they were limited a lot, and 7% (n=1,193) were limited a little. A further 3% (n=577) did not disclose this information. Results from those who were limited a lot and a little were collated for analysis purposes.
Household income varied and is detailed in Table 3 below.
| Household Income | Number | Percent |
|---|---|---|
| Less than £10,000 | 2,133 | 12% |
| £10,000 - £19,999 | 2,251 | 13% |
| £20,000 - £34,999 | 2,462 | 14% |
| £35,000 - £49,999 | 2,178 | 12% |
| £50,000 - £74,999 | 2,230 | 13% |
| £75,000 - £99,999 | 1,140 | 7% |
| £100,000 or more | 778 | 4% |
| Not disclosed | 4,290 | 25% |
| Total | 17,462 | 100% |
Respondents were also asked how many cars or vans were owned, or were available for use, by members of their household. Over three quarters (79%, n=13,865) indicated they had one or more vehicles available.
| Vehicles Available | Number | Percent |
|---|---|---|
| 0 | 2,718 | 16% |
| 1 | 6,800 | 39% |
| 2 | 5,968 | 34% |
| 3+ | 1,097 | 6% |
| Not disclosed | 879 | 5% |
| Total | 17,462 | 100% |
Survey Analysis
The sample profile above represents the true breakdown of respondents, however, the following quantitative analysis is based on weighted data.
Survey data was weighted by education/training/work (ETW) status to ensure the results were representative of the age 5-21 population in this respect. This assigned and weighted respondents based on whether they were primarily at school, in further/higher education, being an apprentice/in training, being in work (including full-time, part-time and voluntary), and not being in education, training or work.
Crosstabulations by gender were weighted to the gender split for those aged 5-21 in the Scottish population to again ensure results were representative.
While crosstabulations by each of the other demographics outlined above were also explored to identify any differences in experiences/views, these are weighted by ETW only and not the equivalent population data. This was largely due to the difficulties in identifying equivalent population data for this age cohort, but in some cases, population data would also reduce the weight of responses from some key groups which represent minorities in the population but who had responded in good numbers to this research (e.g. those in rural areas and those in low income households).
The only exceptions to using weighted data were where responses were relevant to only one age group. A small number of questions were asked of/about those aged 16+ only, this included all crosstabulations by sexual orientation, plus questions in relation to travel spend and learning to drive. In these cases, the raw data was used to conduct the analysis.
Frequencies and crosstabulations were conducted, and the results outlined below highlight any differences which were identified at the 95% confidence level.
Qualitative data was also read to identify the key themes and issues - these varied by question and were based on the responses provided rather than trying to assign data to pre-determined codes. Quotes have been included where relevant to illustrate the main points raised.
Research Conventions and Caveats
Overall, the total sample size achieved by the survey provides good levels of statistical reliability. It provides tight confidence intervals (+/- 1%) for disaggregation - for example, at the 95% confidence level where 50% of those surveyed gave a particular response, the true figure would be in the region of 49% - 51%.
Despite this statistical reliability, however, it should be noted that not all local authority areas are equally represented, some areas took part in greater numbers while others participated in only very small numbers. As such, some of the challenges and issues faced by young people and their families in these areas may not have been identified by the research.
Similarly, the sample is dominated by the views and experiences of those attending school, with those in apprenticeships/training programmes, at college/university, and those in work taking part in smaller proportions. Indeed, the number of respondents undertaking an apprenticeship/training programme was particularly low compared to all other groups (and may require more dedicated research approaches to boost involvement going forward). While the data has generally been weighted to address this disparity, it should be borne in mind when interpreting the results.
As the survey was only available online there is a risk that it was not accessible to all young people and their families. Due to the prevalence of online learning during the COVID-19 pandemic it was assumed educational establishments would be able to communicate electronically with the majority of their young people and parents to disseminate and advertise the survey. A good response rate was achieved indicating the survey was largely accessible, however, the risk remains that some families might have been unable to access it. Similarly, the current survey only considered the views and experiences of children and young people, it did not invite feedback from other bus users. However, this age group presented a data gap, with little information available regarding their travel behaviour beyond travel to school data, hence the requirement for a bespoke survey. Conversely, current travel patterns for adult populations is generally available from existing data sources while wider views and concerns were gathered via the previous public consultation.
In order to generate urban/rural/island comparisons, the location data outlined at Table 1 was amended to create a distinct ‘Island’ category. All respondents who identified themselves as living on Orkney, Shetland or the Western Isles were included within this groups. It should be noted however, that other respondents from these locations may have chosen not to identify their local authority area and so they would have remained grouped under the city/town/rural response provided at this question. Similarly, respondents from other island locations, for example within Argyll and Bute or Highland local authority areas could not be identified within the data, and so again, they remain grouped within the city/town/rural categories.
Percentages in the tables have generally been rounded to whole numbers and to ensure a total of 100%.