4. Comparison of key Scottish and UK transport emissions statistics
Carbon Account for Transport No. 11: 2019 Edition
4. Comparison of key Scottish and UK transport emissions statistics
In 2017, Scotland's transport emissions accounted for 8.8% of the UK's total transport emissions including IAS, and 10.3% excluding IAS.
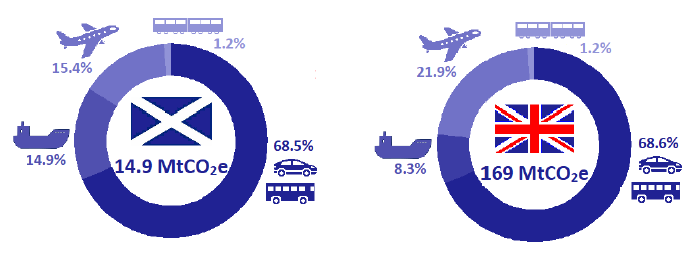
Road and rail accounted for a similar proportion of the UK's total emissions to Scotland; however, a substantially greater proportion of the UK's transport emissions is due to aviation, and a smaller proportion is due to shipping. Figure 13 illustrates the sectoral compositions of total transport emissions for Scotland and the UK in 2017.
Figure 13: Proportions of Scotland and UK transport emissions by transport sector, 2017.

Source: National Atmospheric Emissions Inventory
Domestic aviation and shipping accounted for proportionately more emissions in Scotland compared to the UK as a whole, contributing 32.7% and 32.2% of the UK's total emissions for these transport modes, respectively. Conversely, Scotland contributed proportionately less to international aviation emissions compared to the whole UK, accounting for just 4.4% of the UK's total international aviation emissions.
Between 1990 and 2017, Scotland's transport emissions, including IAS, increased by 0.4%. Over the same period, the UK's transport emissions rose by 14.2%. Excluding IAS, there was a 3.7% fall in Scotland's transport emissions between 1990 and 2017 and a 1.3% rise in the UK's transport emissions. The large rise in total UK emissions over this period is largely attributable to a significant growth in international aviation traffic.