Emissions trends for Scotland
Emissions trends for Scotland
Total emissions for Scotland, measured at source, were 41.6 MtCO2e in 2018. This represents an increase of 1.5% compared to 2017, and a 45.5% reduction in emissions since the 1990 baseline period when emissions were 76.3 MtCO2e. The Committee for Climate Change (CCC) recommended a new method of reporting emissions for the purposes of reporting against targets using the Greenhouse Gas Inventory.
On this adjusted basis, the GHG account reduced by 50% between the baseline period and 2018. The Climate Change (Emissions Reduction Targets) (Scotland) Act 2019 specifies a 54% reduction over the same period. Therefore, the target for 2018 has not been met. The overall reduction demonstrated in the time-series reflects decreases in emissions from major contributors such as energy supply, waste management and business, whilst land-use, land-use change and forestry (LULUCF) became a greater carbon sink, offsetting an additional 5.1 MtCO2e of emissions.
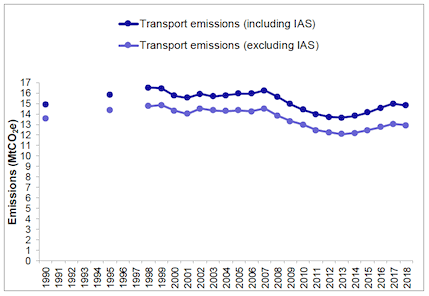
In 2018, Scottish transport emissions, including emissions from international aviation and shipping, were recorded at 14.8 MtCO2e; this is a decrease of 1.1%, or 0.2 MtCO2e, since 2017, and a 0.5% decrease, or 0.1 MtCO2e since the 1990 baseline (Figure 1). In 2018, Scottish transport emissions have declined for the first time since 2013.
Whilst Scottish transport emissions have decreased over the years, transport, including international aviation and shipping, is the largest contributor of greenhouse gases in 2018, accounting for 35.6% of all emissions. Unlike other sectors, which have achieved significant emissions reductions compared to baseline measurements, transport emissions have only seen a small decrease since 1990, slowing the overall reduction in emissions nationwide.
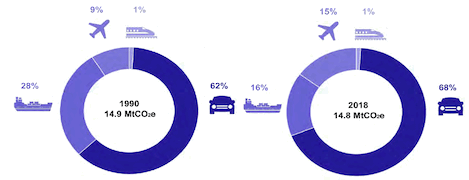
Road transport accounted for 10 MtCO2e (68% of all transport emissions), the largest share of all transport modes. Emissions for shipping and aviation were 2.30 MtCO2e (15.5%) and 2.23 MtCO2e (15.1%) respectively, and rail emissions were 0.16 MtCO2e (1.1%). Since 1990, the share of transport emissions due to shipping has generally fallen, while the shares due to road, rail and aviation have generally increased. Figure 2.1 and 2.2 illustrate the change sectoral contributions to Scotland’s transport emissions for 1990 and 2018, respectively.
Figure 1: Time series of Scotland’s total transport emissions, 1990-2018 (Source: NAEI).

Figure 2: Share of transport emissions by transport sector, 1990 and 2018.

A detailed discussion of emissions for each transport sector is presented in sections 2.1 to 2.4.