Constraints
Financial Outlook
This section will briefly go over the funding available to deliver Transport interventions in Scotland – another key constraint on what can be done.
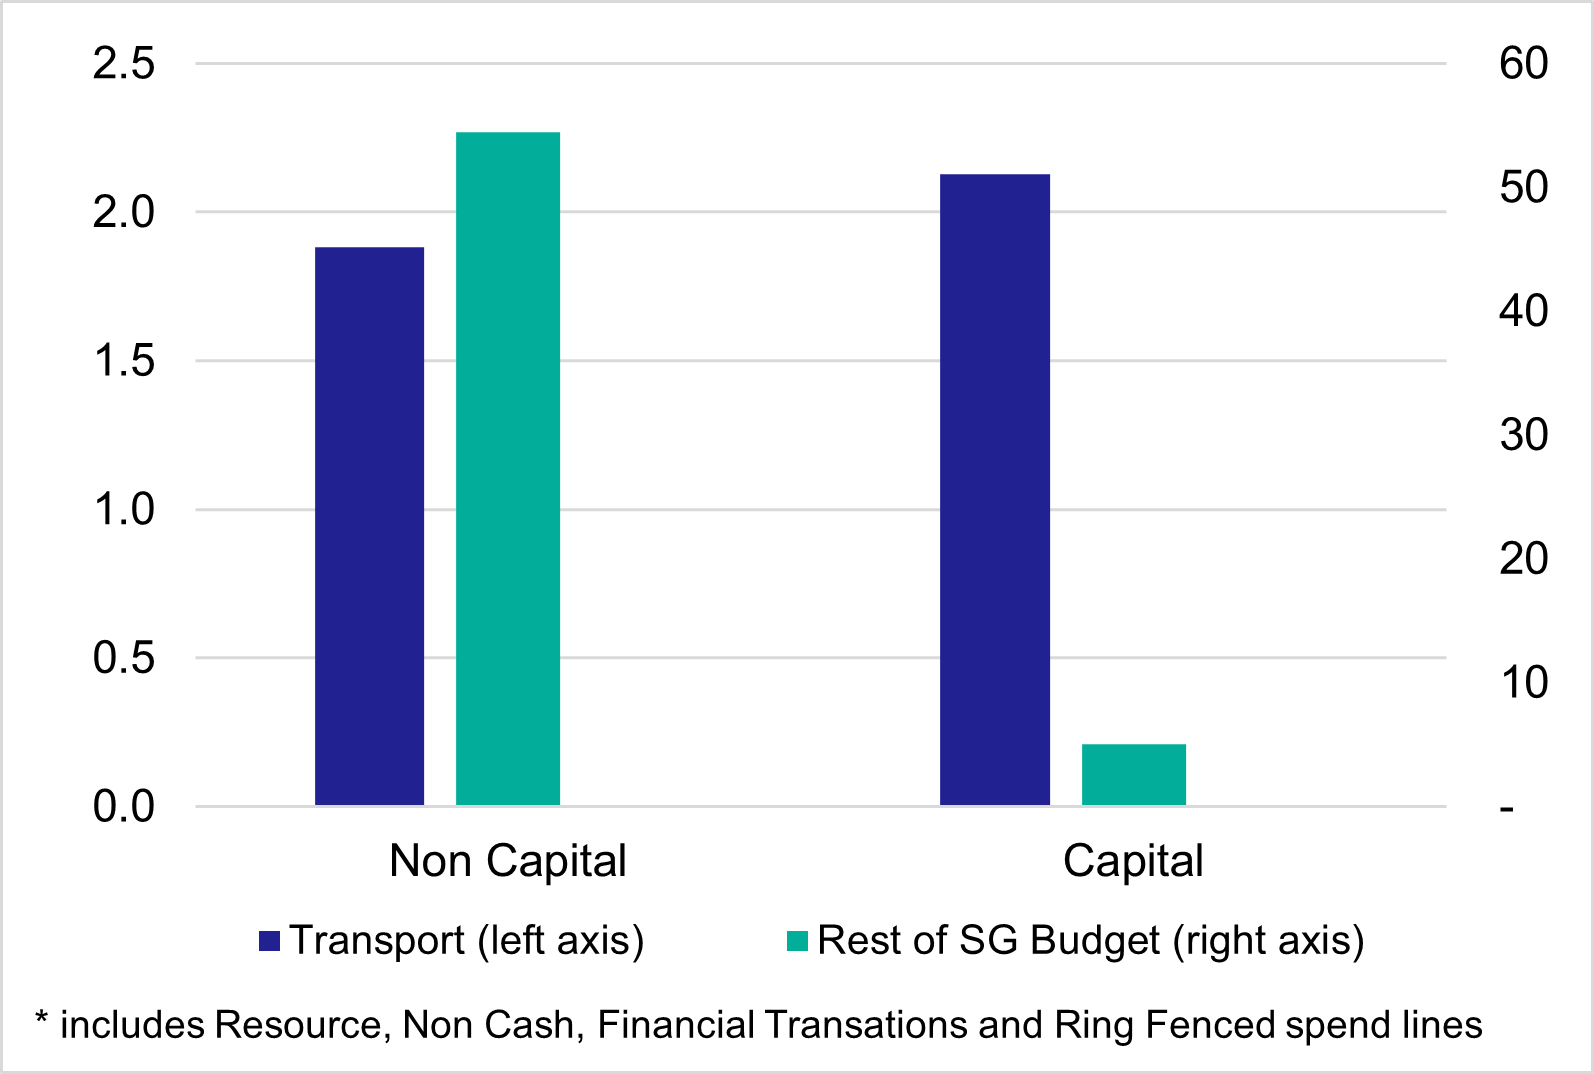
In 2025-26, Scotland’s Transport provisional budget has exceeded £4bn for the first time in history, an increase of over £150m based on the previous year’s budget (see Scottish Budget, 2025-26). The portfolio’s spending plans aim to help Transport Scotland develop and maintain a sustainable, safe, inclusive and accessible transport system, with more detail available in the Budget documents. Of the £4.009bn budget allocation for 2025-26, 53% of the budget (£2.128bn) is Capital funding. This is an unusual breakdown compared to other portfolios – and it means that the transport budget is highly dependent on the size of the overall Scottish Government capital budget from year to year. To illustrate this point, for all other areas of government, just 8% of the total budget allocation was accounted for by capital funding, with a large majority accounted for by fiscal resource funding. Figure 5.1 looks at the difference in budget profiles between Transport and the rest of the Scottish budget.
Moving away from Scottish Government Budget data and to Government Expenditure and Revenue Scotland (GERS, 2024) data, a reliable time series can be established to assess trends over a long time period (and provide a comparison to the rest of the UK). GERS estimates the revenue raised in Scotland, the cost of public services provided for Scotland, and provides comparisons to the UK. It is therefore useful for fiscal analysis such as that contained in this chapter. The charts below show Transport spend (first current spend in Figure 5.2 and then capital spend in Figure 5.3) as a percentage of both total (current and capital) public sector expenditure and as a percentage of GDP for Scotland and for rUK.
In terms of current expenditure, we see that measures of expenditure relative to GDP and total spending were at similar levels in Scotland and the UK in the early years of the time series. Since 2006-07 Scotland has tended to have significantly higher prioritisation of transport spending than the UK. Scotland has a more generous funding arrangement than many parts of the UK, whether expressed as a % of total current spending or as a % of GDP. However, there are numerous other factors that help explain why higher expenditure levels might be expected in Scotland. Primarily these are the issues highlighted in the geography section of this paper: the need to spend significant amounts subsidising ferry travel (which is far less common in other parts of the UK) and lower population densities in Scotland (particularly compared to the South of England) mean there is a greater need to subsidise public transport (e.g. rail and bus operators) in Scotland. To a lesser extent, policy differences (such as greater generosity for free bus travel) may lead to different spending profiles.
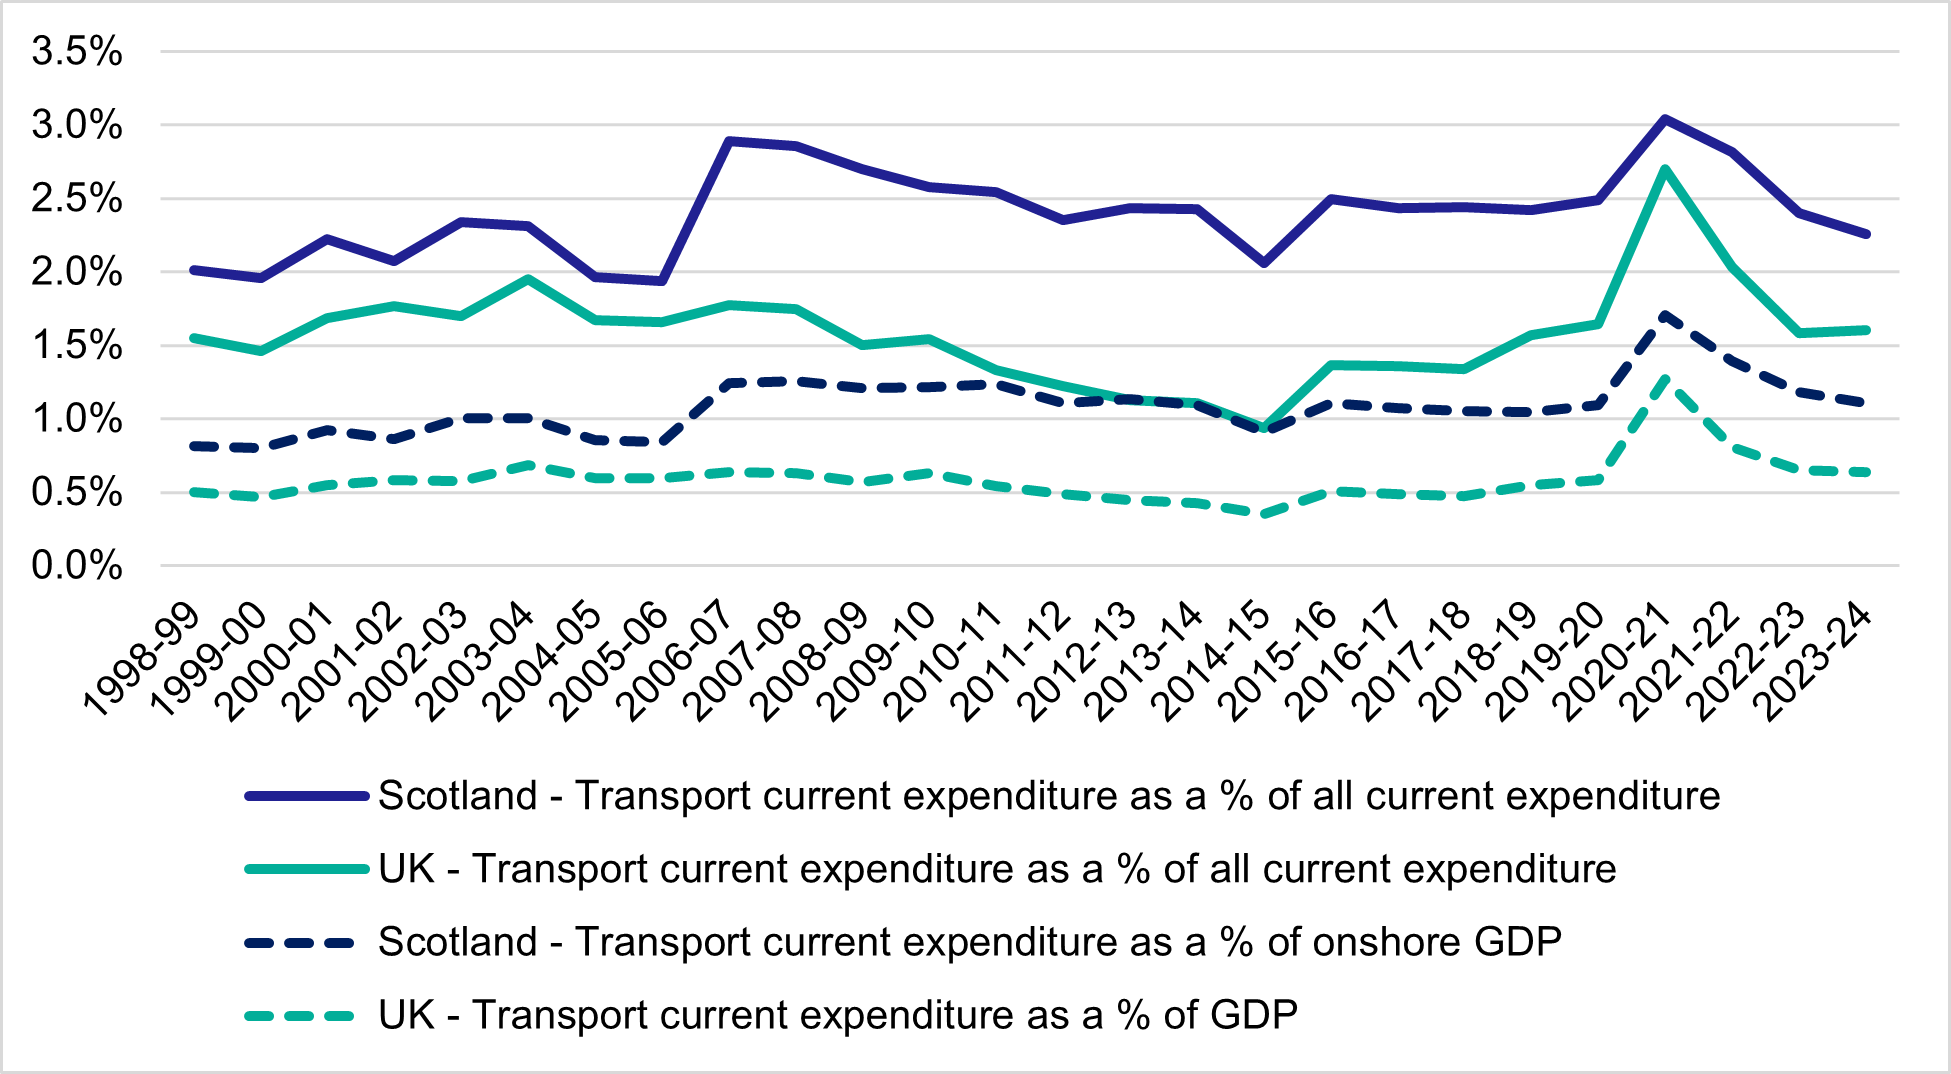
Current expenditure (in both the UK and Scotland) increased sharply over the pandemic, but it is important to note that this does not reflect an easing of financial pressures – but the reverse. Expenditure increases largely reflect the need to make up for revenue losses suffered as a result of changed travel patterns during the pandemic, with statistics showing large declines in passenger numbers and revenue figures for Rail, Bus and Ferries over the pandemic period (Scottish Transport Statistics). This topic is revisited in the discussion of wider constraints below.
In terms of capital expenditure, Scotland and the UK have very similar spending profiles, despite these factors:
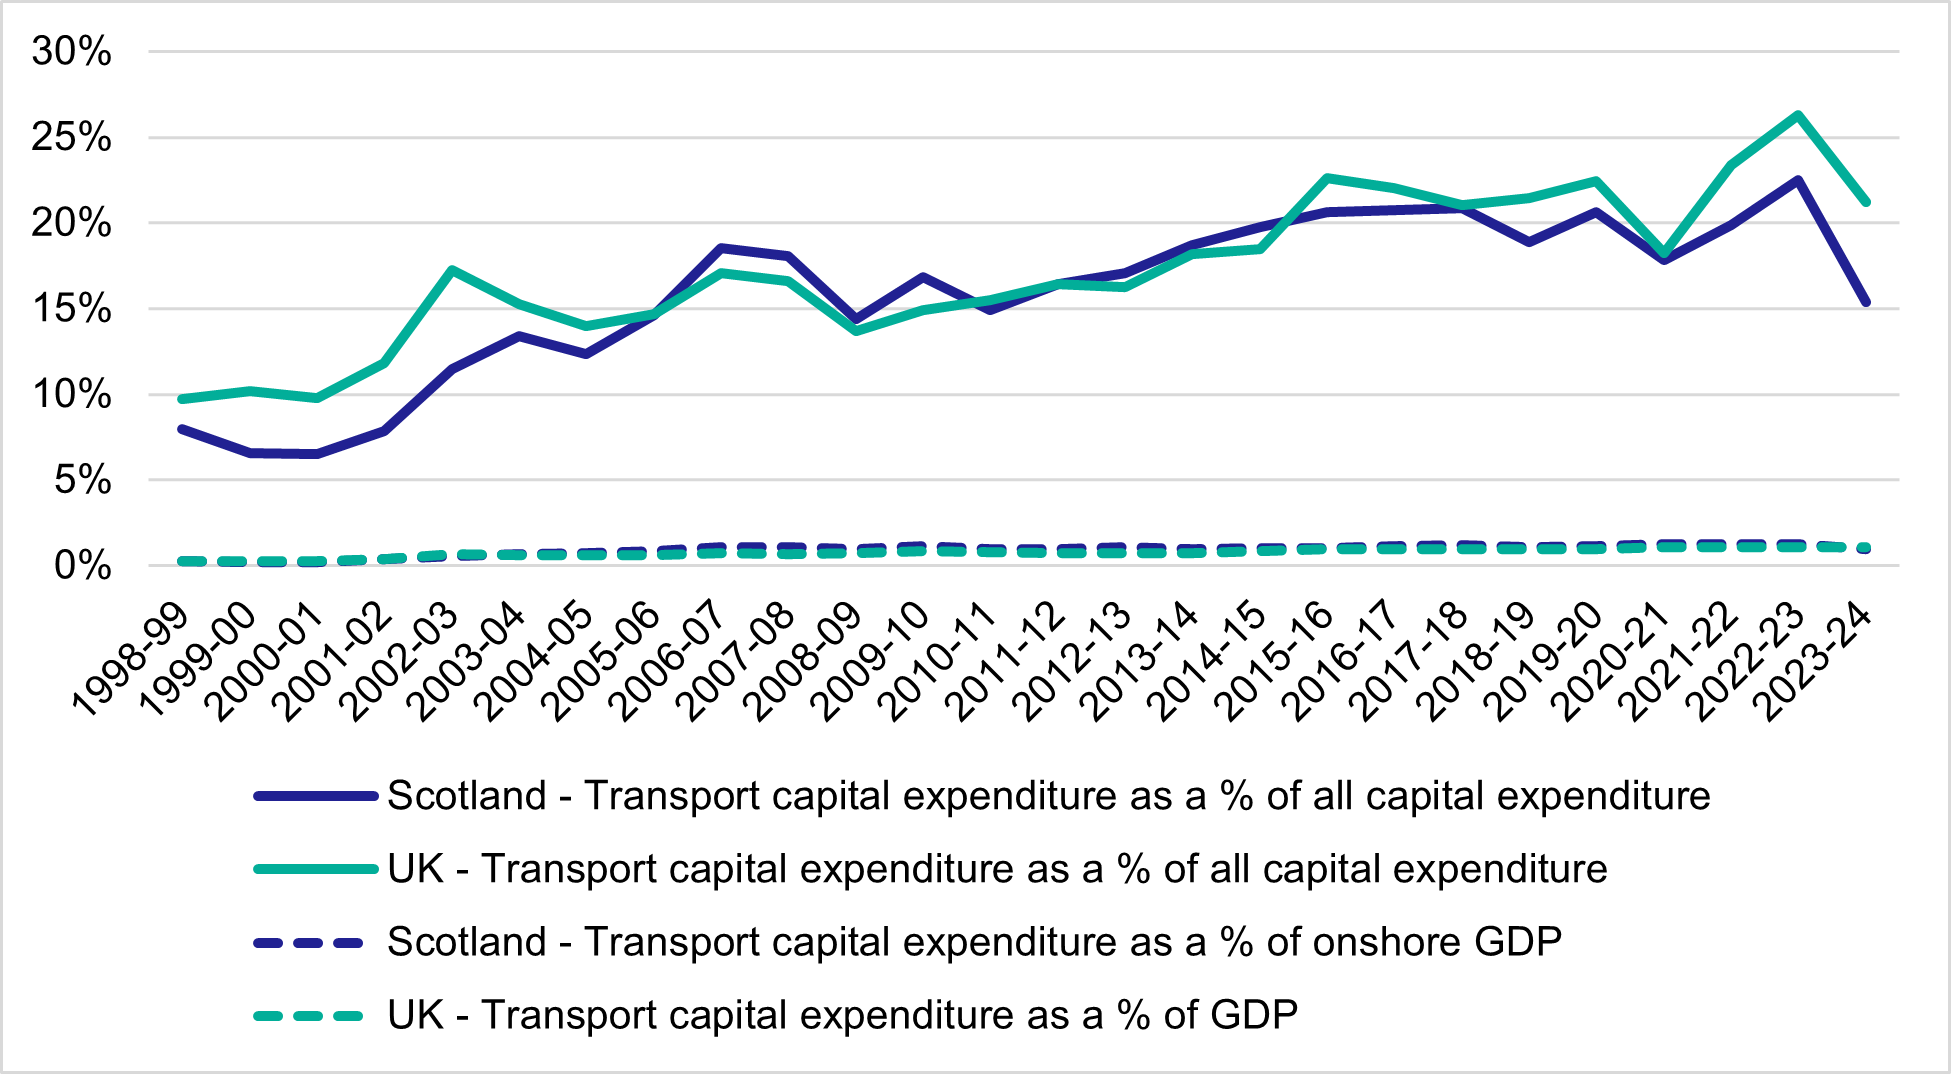
Capital expenditure in both countries has been prioritised more over the later parts of the time series, with transport capital spending accounting for a larger proportion of total capital expenditure in the period after 2005-06. The trends for both Scotland and the UK are similar over this time period, although it could be argued that Transport Capital was relatively low in Scotland in the period up to 2005-06.
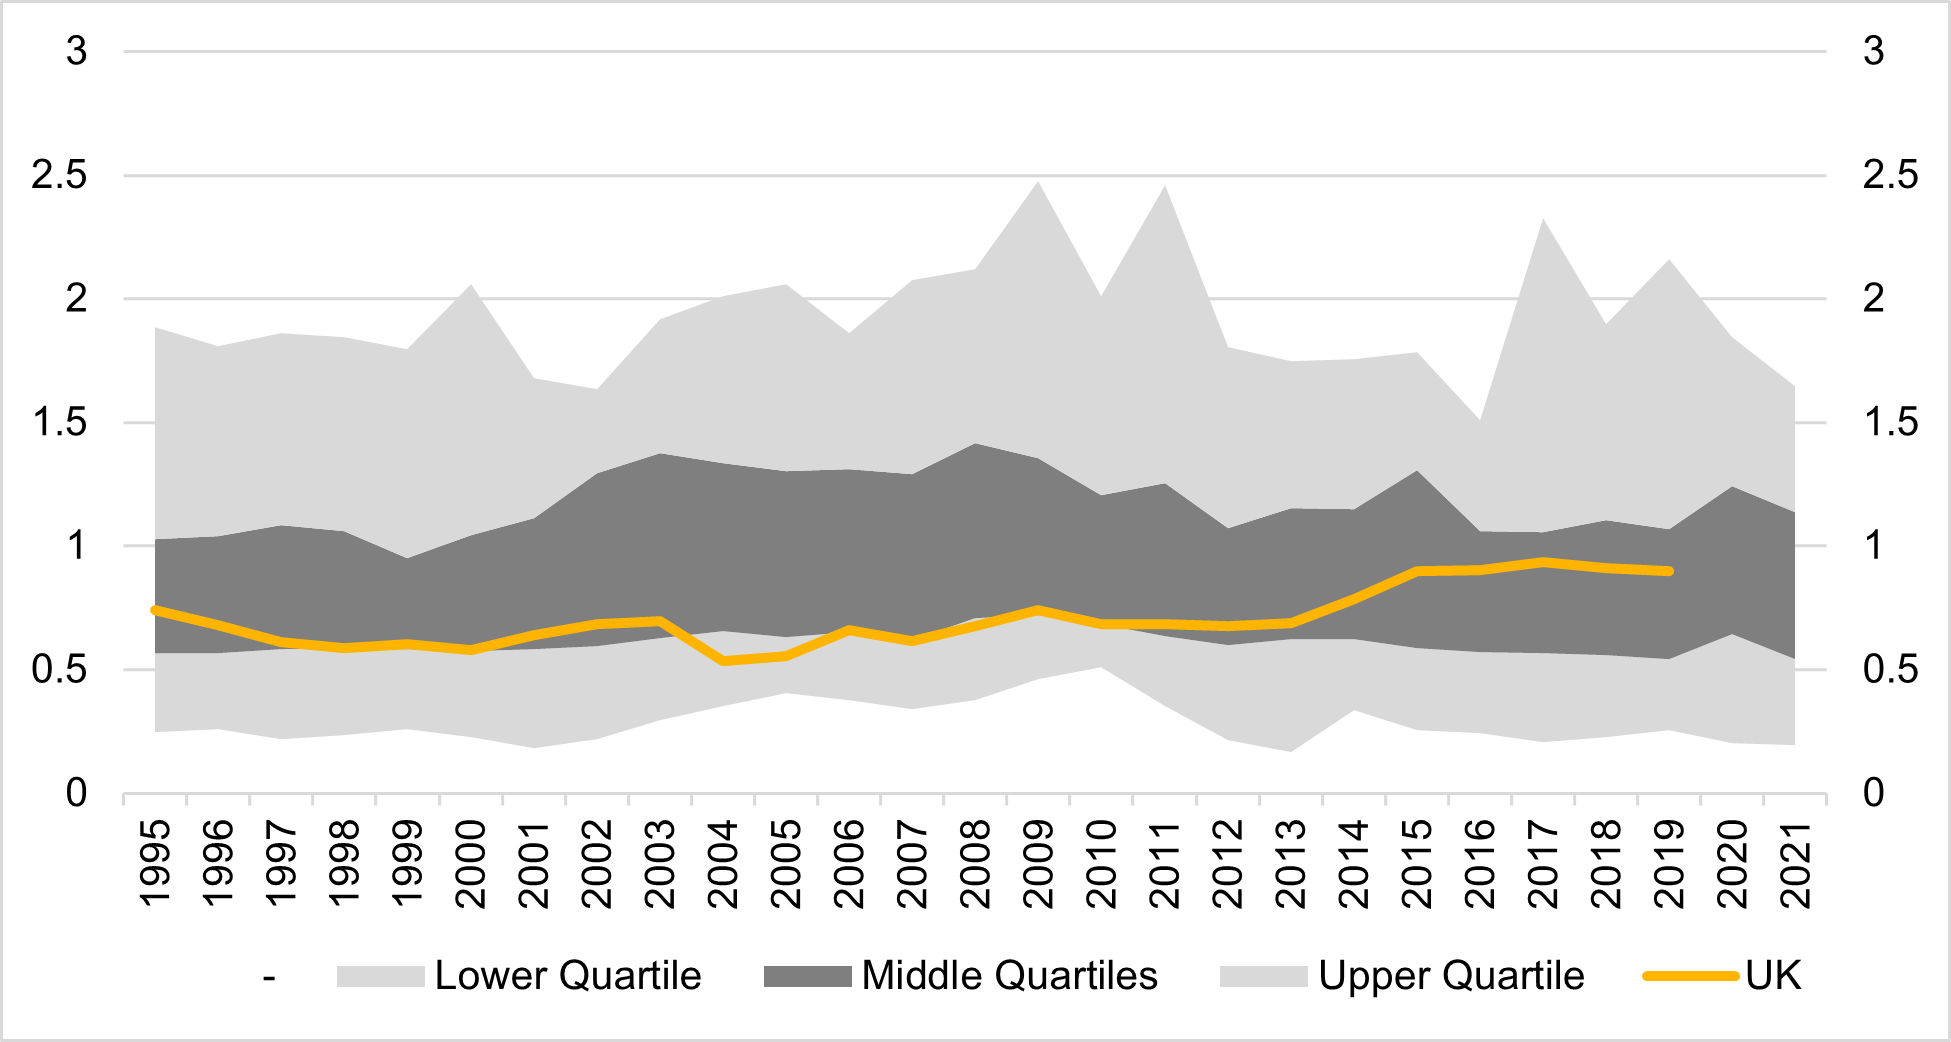
It is somewhat difficult to establish how Scotland compares to other international comparators in terms of transport spending. However, it is possible to infer via looking at the UK. With a specific transport lens, the chart below (Figure 5.4) compares the UK to OECD averages in terms of inland transport infrastructure investment using OECD (accessed 2025) data - The OECD notes that “Infrastructure investment covers spending on new transport construction and the improvement of the existing network. Infrastructure investment is a key determinant of performance in the transport sector. Inland infrastructure includes road, rail, inland waterways, maritime ports and airports and takes account of all sources of financing.” The UK has tended towards the lower quartile of OECD spending on transport infrastructure (expressed as a percentage of GDP) over the past 30 years – only catching up to the OECD average levels over recent years. This is broadly consistent with a message of long-standing under-investment relative to international competitors.
Looking forward, it is not possible to project transport capital budgets. However, it is notable that overall capital budgets are not expected to increase dramatically as a share of GDP. The most recent Office for Budget Responsibility (OBR, 2024) forecast of capital spending that is typically used in fiscal forecasting, shows that capital spending is due to remain at the same level (in terms of % of GDP) in 2029-30 as it stood in 2023-24, albeit growing in real terms for most years of the forecast. Note that this is based on “PSGI in CDEL” forecasts - a measure of capital spending in the UK public sector, where PSGI stands for public sector gross investment and CDEL stands for capital departmental expenditure limit. The Scottish Fiscal Commission are less optimistic, with a forecast of capital funding only increasing by 2 per cent between 2025-26 and 2029-30 – a real terms decline (SFC, 2024). Unless transport is prioritised over other areas, it is unlikely that performance with respect to transport infrastructure investment will improve relative to comparator countries.
While much of this discussion has focussed on ‘investment’, a very small proportion of the total transport expenditure in Scotland relates to provision of genuinely new transport infrastructure. A large majority of transport spending is not spent on new investments and improvements to the network but is spent either ensuring consistent service delivery from one year to the next or replacing the existing infrastructure. In one sense this is more about ensuring that we continue to deliver what is already being delivered, rather than delivering ‘more’. Even where investment does take place, there is often an element of both ‘replacing’ and ‘improving upon’ existing stock, so that the two ideas are difficult to disentangle (e.g. replacing existing rail rolling stock or ferries with newer and more efficient stock). There are clear costs to reducing much of this spend. Most obviously this may be seen in reduced services. Day to day spend on areas with no clear service user also provides significant value however. Taking the example of road maintenance, Abell et al. (2016) conducted a research project into the impact of changes in maintenance spend on roads in Scotland in 2012 over a 20-year period. The analysis found an overall disbenefit to society of reducing road maintenance spending. Not all costs in the analysis can be quantified, but for those that can, it shows that for every £1 reduction in road maintenance, there is a £1.50 cost to the wider economy. This helps explain why maintenance features so prominently in the investment hierarchy presented in figure 1.2 (page 16).
A final point to make on this subject is that transport investment requires a wider societal response beyond public funds. Stimulating private funding will also play a key role in delivering the outcomes that are required, as highlighted in a report from the Advisory Group on Economic Recovery: “the importance of strategic public investment and more effective leverage of private investment into projects to provide public good could not be clearer.” (Scottish Government, 2020). Similarly, engaging all stakeholders in the transport system to support policy by contributing different perspectives and expertise can help improve the outcomes that policy achieves.
Other Challenges facing the sector
Patronage and Revenue Generation
The pandemic, and the response of commuters to the pandemic, has posed significant challenges to public transport providers. The rise in hybrid working has reduced the number of commuting trips taken across different modes. There has been an increase in trips for leisure purposes, and a reduction in journeys in what have traditionally been the peak periods for public transport. Other factors, such as shopping habits, inflation and strikes may have also affected demand (Urban Transport Group, 2023).
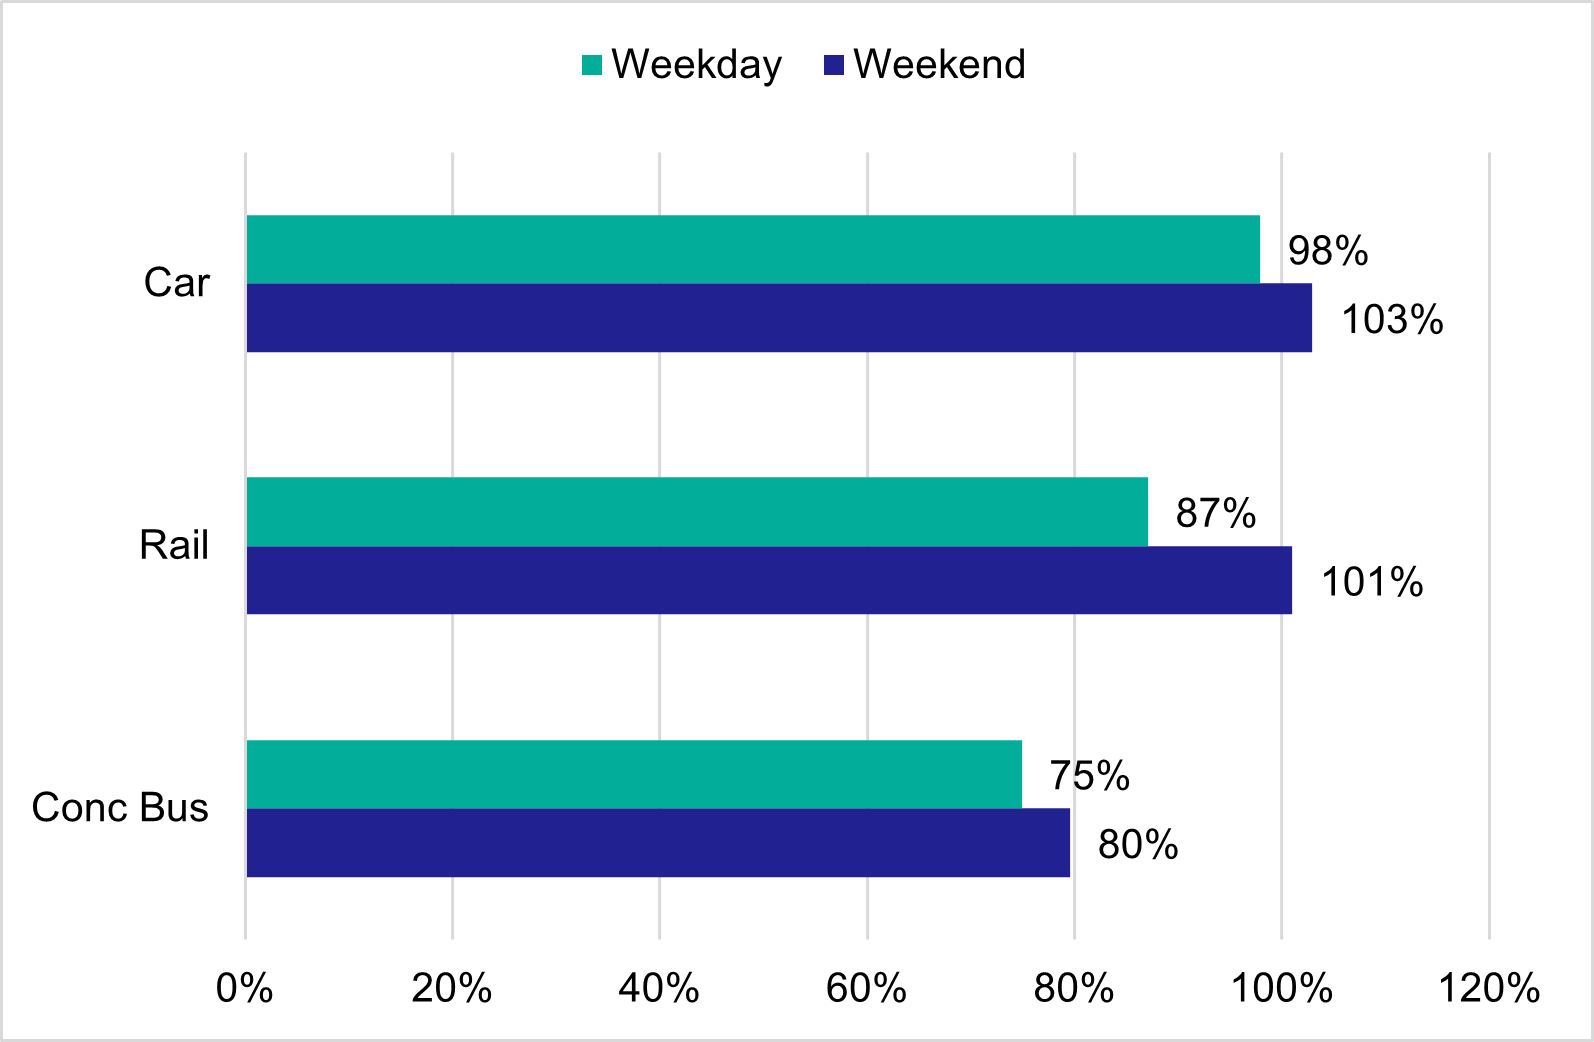
This can be seen in terms of weekly data on transport usage highlighted in Figure 5.5. Compared to its equivalent pre-pandemic point, car, rail and concessionary bus demand has recovered stronger on weekends than on weekdays. There are also distinct differences in the extent of the recovery across modes. While all weekday patronage falls short of their pre-pandemic levels, the recovery is strongest in cars (reaching 98% of pre pandemic levels), followed by rail (87%) and then concessionary bus travel (75%). Weekend travel for both car and rail were slightly above their pre-pandemic average, highlighting the increase in trips for leisure purposes, with concessionary bus travel still significantly below pre pandemic levels of patronage (80%). It should be noted that this chart focussed on data where a comparable time series can be assembled rather than capturing all forms of travel. This explains the focus on concessionary bus travel rather than all bus travel as well as the lack of data on ferry journeys.
Pre-pandemic trends are not expected to re-emerge. Indeed, the Patronage Growth Sub-Group of the Bus Taskforce have suggested that pre-pandemic baselines should no longer be used as a benchmark to understand current trends – reflecting the fact that a ‘new normal’ has likely emerged (Transport Scotland, 2024).
The changing patterns do create new pressures on the network. In the first instance, lower patronage creates significant problems in terms of revenue generation. When patronage drops, so too does ticket revenue, and this means that, in order to run a similar service level, a higher subsidy is required. This was explored specifically with the pandemic in Figure 5.2 (page 76) – showing a large spike in current expenditure at the time of the pandemic. A subtler impact is felt in terms of planning services and managing how supply should respond to a move away from weekday peak-time travel and more toward weekend and leisure travel than was previously the case. There is also considerable uncertainty regarding future trends, and this makes planning very difficult.
Demographic Changes
The population of Scotland was estimated to be 5,436,600 on Census Day 2022, according to data released by National Records of Scotland (NRS). This is the largest population ever recorded by Scotland’s Census. The population of Scotland grew by 141,200 (2.7%) since the previous census in 2011. However, this is a slower rate of growth than between 2001 and 2011 and was lower than growth seen in both England and Wales and Northern Ireland.
A primary challenge in the context of transport is the aging population. Census day data shows a population of over one million people aged 65 and over (1,091,000). There is considerable uncertainty (particularly with respect to likely trends in immigration) over the future age profile of Scotland’s population. However, there is a broad agreement that the proportion of people in Scotland over 65 is due to increase substantially. For example, in a long-term assessment of Scotland’s population and the fiscal impacts of population change, the Scottish Fiscal Commission (SFC) reports that Scotland’s population could fall dramatically – to just 4.1 million in 2072. Furthermore, the ratio of people over 65 years old to those aged 16-64 could almost double from 31:100 in 2022 to 58:100 in 2072 (SFC, 2022). This would place considerable pressure on public finances.
There will also be a varied picture across the country. For example, Public Health Scotland projections highlight that expected population growth and decline varies dramatically with geography. Broadly speaking there is expected to be population growth within the Central Belt area, and depopulation in areas such as the Islands, Ayrshire and Arran and Dumfries and Galloway.
It is likely that dramatic changes will be seen in terms of the types of passengers that the transport system needs to deliver for as well as the types of journeys being made. Creighton and Holley Moore (2015) highlight key implications of an aging population for transport systems. They note that support for older people to driving safely for longer. Viable alternative transport options need to be made available for those who are unable to drive. In both cases, access to health services will need to be increasingly prioritised. Making public transport as well as walking infrastructure (e.g. road crossing) more convenient for older people will be important for maintaining mobility. Encouraging older people to engage in active travel more frequently (with the UK lagging other European countries in this respect) is also flagged as an opportunity – with obvious positive implications for health and reducing pressures on other services. There is also a significant financial aspect to consider. The impacts in terms of revenue generation via fares and requirements for concessionary travel are likely to create further pressures. Demographic changes will also have a broader impact on funding availability via the wider economy – primarily through the relative sizes of populations who are likely to be economically active versus inactive, and who are therefore contributing to public sector revenues via income tax (with the SFC document exploring this in much more detail).