Transport Supporting a Growing, Inclusive Economy
This section will briefly deliver a series of five case studies to look at avenues via which transport affects the economy. Firstly through a productivity lens (recognising the key role of boosting productivity in supporting long term economic growth) and then broadening the definition of growth to look at safety, health and wellbeing. Finally, an equalities lens is applied (recognising the fact that tackling inequality and growth go hand in hand, meaning not only ‘fairer’ but also ‘more’ growth) to look at socioeconomic and geographic factors influencing transport outcomes.
Economic Footprint of the Transport Sector
This case study looks at the economic footprint of the transport sector. It will do so in terms of both a broader discussion of the makeup, characteristics and impacts of the sector and then look quantitively at these impacts, via The Scottish Government’s Input Output tables - which can provide estimates of the direct, indirect and induced impact of the sector.
This represents an attempt to look at the sector itself (i.e. the firms operating in the transport sector), and not the economic activity that transport as a whole supports (i.e. mobility and accessibility that transport provides) – it is impossible to assign a value to the latter given that the ability to move people and goods is essential to most economic activity. Defining the former, the transport sector, is tricky and imprecise, but more achievable.
Direct Economic Footprint
Irrespective of definition, there are a wide range and diversity of firms operating within the transport sector. Businesses in Scotland (2023) statistics show that there were approximately 7,000 businesses in the ‘Transport and Storage’ Sector in Scotland in 2023, employing over 90,000 people. In general, the Transport and Storage sector is disproportionately made up by medium and large sized businesses (defined here as 50-249 and 250+ employees respectively). These account for 5.9% of transport firms, versus just 3.5% of all other businesses. Despite this, the footprint of the transport sector is more geographically diverse than many other sectors. Just 22% of employment within the Transport and Storage sector relates to firms in Edinburgh or Glasgow, compared to 31% for all other firms. Average turnover for these firms is similar to other businesses in Scotland (£1.6m per firm), but employee earnings within the sector are lower than for the economy as a whole, with median hourly pay of £15.08 in 2023 (compared to £16.63 for all industries in Scotland) and mean hourly pay of £17.98 (compared to £20.21). However this masks significant variation. For example, the mean hourly pay of road (£14.16) or mobile machine (£14.29) driver significantly lags behind that of other drivers and transport operatives (£25.45) and Transport Associate Professionals (£32.79). (ASHE Tables 5 and 15).
At any given time the transport sector also directly supports a large volume of construction jobs. Scottish Transport Appraisal Guidance (STAG) notes that “the net impact of construction jobs is not usually considered as a Wider economic impact of transport interventions. It is assumed that the expenditure would otherwise have been directed towards another project and hence supported construction or other jobs elsewhere.” However it should be noted that construction jobs can have a meaningful impact on local areas. Furthermore, the presence of a major transport project can involve an extremely large scale of impact that may challenge some of these assumptions. For example, over 15,000 people were inducted to work on the construction of the Queensferry Crossing, with Scottish firms awarded sub-contracts or supply orders totalling over £350 million (see Transport Scotland (2017)).
Indirect and Induced Impacts
It is commonly understood that the economic footprint of the firms within the transport sector goes far beyond their firm – primarily via ‘supply chain’ effects. A supply chain reflects the interconnected journey that raw materials, components, and goods take before their assembly and sale to customers. In the context of the transport sector in Scotland, it is clear that one firm will have a different supply chain to another. For example, one might reasonably expect a major component of the supply chain of a firm that operates buses to focus on inputs such as fuel and vehicle purchases. In turn a company that assembles buses may have a supply chain that draws far more on raw materials and manufactured components etc.
Some transport firms are large publicly owned bodies – meaning they should have policies in place to manipulate supply chains in order to generate positive outcomes. For example, Transport Scotland has a Corporate Procurement Strategy (2024), which aims to support The Scottish Government’s goals and procurement priorities and publishes an annual procurement report (e.g. the most recent for 2023-24). Transport Scotland accounts for substantial amounts of annual spending – in addition to funding allocated by grants and subsidies, Transport Scotland’s spend on procured contracts during 2023-24 was over £770 million. The Procurement Strategy ensures that this supports a wide range of community benefits being implemented into Transport Scotland contracts and procurements. This has a focus on delivering a wide range of employment and training opportunities, supporting young people, adults and businesses throughout Scotland. For example in 2023-24, community benefits reported by our suppliers during the period include the creation of 613 new entrants’ positions, 36 apprenticeships, 72 graduate positions and 22 work placements. However, this is obviously only a small part of the value generated via transport supply chains. Other key players within the sector also publish details about their supply chain impacts – for example CalMac recently commissioned CEBR to produce and publish a socio-economic value report (2022) which details supply chain impacts and overall economic footprint, and Scotrail are currently looking into updating a 2016 report carried out that looks at the rail industry in Scotland through a similar lens produced by Oxera and a recent KPMG report for CPT has also estimated the wider benefits of bus use as being £1,385m annually.
Overall estimate of the GVA and jobs supported by the sector
In order to look more rigorously at the supply chain and wider effects of the sector as a whole, it’s possible to look at the transport sector via the lens of the input output tables. Broadly speaking, these tables can be used to look at individual parts of the economy (via Standard Industrial Classification or SIC codes) to identify key parts of the sector. These tables provide a complete picture of the flows of goods and services (products) in the Scottish onshore economy for a given year. They detail the relationship between producers and consumers and the interdependencies of industries.
The rest of this section will use the Scottish input output tables to look at the economic footprint of the transport sector in Scotland. For the purposes of this section, the transport sector will be defined as Rail Transport (SIC49.1-2), Other Land Transport (SIC49.3-5), Water Transport (SIC50), Air Transport (SIC51) and support Services for Transport (SIC52). Two further SIC codes are also used to describe ‘Manufacturing related to transport’ - Motor Vehicles SIC29) and Other Transport Equipment (SIC30).
Using the latest Scottish Government Input-Output model of the economy, it is estimated that the Transport Sector, supports just over 150,000 full time equivalent jobs, and just under £10bn GVA. This represents between 6-7% of the total workforce and Scottish GVA. Roughly 60% of this activity is within the Transport and Communication Sector, with most (over 30%) of the remaining activity spread evenly across the Finance and Business, Manufacturing and Distribution and Catering sectors. These estimates include both direct, indirect supply chain and induced re-spending of wages effects.
Increasing Productivity – ‘Agglomeration’
International Context
There is a wide body of evidence that large urban centres are associated with higher productivity than areas with a smaller population. For example, the figures below are taken from an OECD paper (Ahrend et al., 2014) highlighting this issue and show that population size of a town or city is positively correlated with productivity.
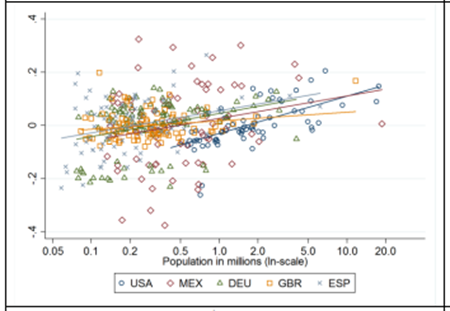
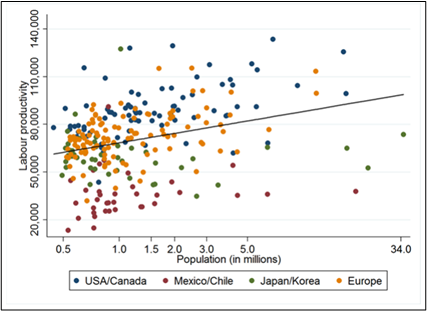
Note that the correlation is weakest for the UK (the yellow line on the lefthand chart). The OECD note that the UK is somewhat of an outlier in terms of the strength of correlation and discuss that this may be due to the role of London (and the proximity of other urban areas to London outweighing population size when considering productivity). UK cities are discussed in greater detail throughout this chapter.
The OECD explains how these increased productivity levels are achieved:
The large theoretical literature on agglomeration economies/externalities (see the reviews of Rosenthal and Strange, 2004; Duranton and Puga, 2004; and Puga, 2010) tends to conclude that agglomeration benefits accrue through learning, through knowledge sharing, through specialization, and through deep labour markets."
There is lots of evidence that various transport interventions can help produce agglomeration benefits by expanding the number of people who can easily, and quickly, commute into an urban centre. This results in businesses having greater access to customers and suppliers, as well as a widening labour force scope (UTG, 2021). There are two types of agglomeration – static agglomeration occurs when transport directly leads to existing businesses increasing productivity, and dynamic agglomeration is when the area itself becomes attractive for business to locate, and people to live. This in turn can change the land use and development, supporting new housing and business growth.
As discussed in the empirical evidence section (above), a recent evidence review of the economic impact of transport interventions found that transport investments are associated with increased levels of firm and labour productivity (DFT 2024). This is perceived as the primary benefit realised via agglomeration - although the paper did note the need to consider displacement when thinking about effects on the economy as a whole in case ‘sorting effects’ (less productive firms leaving an area after a transport intervention) are present. The paper suggests that future research could look to address this and confirm whether or not agglomeration has a net positive impact at a national, rather than more local, level.
Transport is not the only means of achieving agglomeration benefits. Factors such as housing density are important, as well as urban planning, perceived quality of life etc. However, transport does have a key role to play. Transport improvements can contribute in two main ways. The first is that by improving links between firms, the effective density of the city cluster rises. The second is that by relaxing constraints on access to the centre of the city, overall number of potential employees that can work in the area is increased.
Scottish Context
Within a UK and Scottish context, there is evidence that poor transport infrastructure is acting as a constraint on securing agglomeration benefits and therefore productivity growth.
For example, in a wide-ranging paper on inequality in the UK, Stansbury et al. (2023) note that:
Overall, the evidence collected above suggests that the UK’s large non-London cities are constrained by their limited transport infrastructure. The UK’s cities are less well-served by roads than US or Western European cities, and less well-connected by public transport than Western European cities. The limited scope of the UK’s road and public transport networks makes the UK’s cities outside London systematically smaller in terms of their “effective size” than peer cities with similar total populations. In several non-London cities, high congestion on roads, and a combination of high crowding and poor reliability on trains, suggest a high economic value of commuter travel, and therefore that improving road and rail infrastructure in congested cities would likely bring significant economic returns. These facts in particular make the case for intra-city transport improvements to enable greater commuting flows and increase effective city sizes."
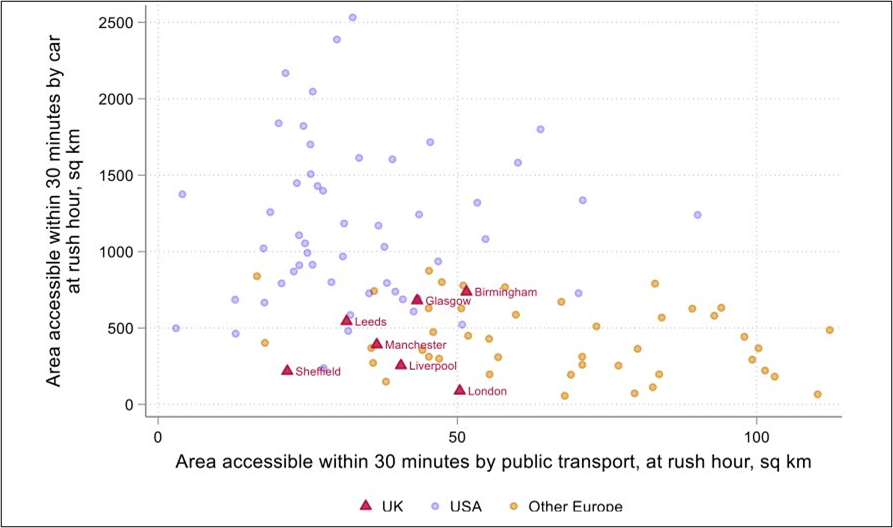
Figure 3.2 (below) from Conwell et al. (2022) looks at how well major UK cities compare in terms of area accessible by road (Y axis) and public transport (X axis). Note that UK cities generally perform poorly in terms of accessibility – with amongst the worst performance across both axes. By contrast, cities in the USA tend to perform better in terms of areas accessible by car, and other European cities tend to perform better in terms of areas accessible by public transport.
- Dr Liz Cameron CBE, Director and Chief Executive of the Scottish Chambers of Commerce noted that “Instead of getting Scotland moving again, businesses and their employees continue to face frequent travel disruption and rising prices, finding it difficult or costly to get to and from their place of work, choosing not to travel because of cancellations, often resorting to the car which is also becoming increasingly expensive to run as fuel prices continue to rise.” Before concluding, “Scotland’s economic recovery and future success hinges on our collective ability to deliver an integrated, world class transport system that connects Scotland’s businesses and people domestically and has unrivalled international links” in an article in the Herald (2022).
- The Centre for Cities reported that 300,000 people were currently underserved by Glasgow’s urban transport network in a 2023 report, with Andrew Carter, the Chief Executive of Centre for Cities noting that: “Glasgow’s economic underperformance is equivalent to the size of the entire nation’s oil and gas sector, or 4.6 per cent of Scotland’s GDP…. The relatively small size of the public transport network compared to similar cities in Europe is one of the key factors behind this lag…For people living in and around Glasgow, this means longer commute times with many residents struggling to access the city centre and all of the jobs and opportunities on offer there.” (Centre for Cities Press Release, 2023).
These perspectives chime with wider research. For example, a recent OECD (2020) report noted that, at a UK level, there is scope to significantly increase economic performance by increasing agglomeration benefits. In a study of 11 ‘core’ cities (defined as “second tier” cities and excluding London), the paper notes that the UK enjoys less benefits in terms of productivity within its cities (relative to their size) than comparable European countries do. The OECD note that one particular feature of UK cities is lack of public transport that can allow residents quick access to the city centre. For example, the paper states that “only 9 cities in the UK operate metro or light rail systems and several large Core Cities in densely populated regions do not have a metro or light rail system. By comparison, more than 60 cities in Germany do have a metro or light rail system”. Wider research on metro or light rail systems has highlighted the manner in which they can deliver economic benefits. For example Pogonyi et al. (2019), find that the 1999 Jubilee Line Extension has had a significant positive impact on firm productivity surrounding JLE stations. Firms within walking distance (750 metres) have the largest benefit, with an estimated 15% increase in total value added (although this gradually decreases with distance, becoming statistically insignificant further out – suggesting a clustering of firms around transport hubs). The OECD (2020) paper also points to declining rates of bus ridership and a dependency on cars as holding UK cities back from realising the benefits of agglomeration. It concludes that the magnitude of underutilised potential is substantial and provides a scenario whereby achieving agglomeration benefits within these cities could permanently boost GDP by 1% (and noting that further benefits could come from higher productivity in mid-sized cities if agglomeration benefits were achieved in these cities too).
There are significant hurdles to overcome in terms of unlocking some of the benefits of agglomeration and boosting productivity – but the payoffs to doing so are potentially very large.
The benefits of making Scotland’s’ urban centres accessible is particularly important in the context of disabled people. Scottish Household Survey (2024) data shows that over 20% of people identify as disabled in Scotland. Amongst employed adults not working from home, disabled people are less likely to use driving as their main mode of travel to work than non disabled people (51% compared to 65%), and are more likely to use public transport or active travel (41% compared to 29%). Transport systems that limit the inclusion of a fifth of the population from urban areas would have serious negative economic consequences. The Accessible Travel Framework (Transport Scotland, 2023) notes that an accessible transport network provides benefits for all of Scotland – and A Fairer Scotland for Disabled People: employment action plan (Scottish Government, 2018) notes that a key part of increasing employment rates can be achieved by addressing barriers caused by the lack of accessible public transport. This is particularly relevant for intercity transportation – with some people with disabilities choosing to not use public transport due to uncertainty regarding the consistency with which stops have been made accessible. Aarhaug and Elvebakk (2015) conclude that measures to improve accessibility should be analysed as part of the wider transport system, enabling reliable door-to-door accessibility rather than stop-to-stop.
One final point to note is that, while it may be intuitive to think that post pandemic trends of increased remote working may reduce agglomeration impacts, it is yet to be seen how much of an impact home working will have on agglomeration. In one sense, it is unlikely that agglomeration benefits will disappear. Home working (as opposed to hybrid) has increased from just under 6% before the pandemic, but remains relatively rare (11% as of June 2024), with hybrid working far more common (Felstead and Reuschke, 2020). Around 70% of UK workers commuted to a workplace each week in 2024 (Opinions and Lifestyle Survey). More detailed (but less timely – 2022) data from the same survey shows that hybrid working is far more common amongst high income individuals than those with lower incomes, and is highly dependent on employment type (with ‘Managers, Directors and Senior Officials’, ‘Professional Occupations’, ‘Associate Professional Occupations’ and Administrative and Secretarial Occupations’ showing far higher levels of home working than other groups). Interestingly, the one area in the UK with the highest level of hybrid and home working is London, which is likely most associated with agglomeration impacts – this suggests that agglomeration may be resilient to increased home working, however this is an emerging area and further research will be needed to answer some of these questions. For example, DFT (2022) are yet to conclude whether and how agglomeration parameters should be changed to reflect post pandemic trends, but have highlighted the need for more research. It is likely that any impact will be felt in terms of changes in the magnitude of expected agglomeration effects, as opposed to questioning their relevance. For example, a recent OECD (2021, chapter 4) review notes “a decline of cities is unlikely. Benefits from agglomeration economies will likely be a predominant factor to retain workers and firms in cities. A big exodus from cities would not be desirable for economic, social and environmental aspects. A decline in large urban centres would lead to a loss of economies of scale affecting national growth, efficiency in provision of public services and meeting environmental goals.”
This high level discussion of agglomeration should hopefully illustrate one avenue through which transport spend contributes directly to helping boost productivity and the opportunities this represents.
There are two important points to note in a Scottish context alongside these conclusions. Firstly, that this is a focus of transport projects in Scotland. For example, within the central belt, major investment in the M8 and the electrification of the three Glasgow to Edinburgh railway lines clearly contribute towards improving accessibility and widening the benefits of agglomeration. Secondly, this is not a problem or concept specific to the central belt. National Records of Scotland’s mid population estimates (NRS, 2020) showed that 91% of Scotland’s population lived in settlements or localities of 500 individuals or more – accounting for just 2.3% of Scotland’s total land area. There were 514 settlements (comprising 662 localities) in Scotland in mid-2020. The population of Scotland living in settlements was 4,974,670. The population living outside settlements was 491,330. 84 of these localities are located in Highlands and Islands. Agglomeration is an urban phenomenon, but there is scope to achieve agglomeration benefits beyond just the Central Belt.
Safety, Health and Wellbeing
In this paper, the centrality of health and wellbeing has been discussed numerous times. For example, one of the four priorities of NTS2 is that our transport system “improves our health and wellbeing”. Under this priority, it is understood that transport will be safe and secure for all, that it will enable us to make healthy travel choices and that it will help to make our communities great places to live. Health impacts were also at the centre of the economic framework presented in Figure 2.2 in Section 2 in this paper.
This brief section will discuss how transport investments are actively supporting these outcomes, taking a look at safety, health and wellbeing in turn.
Safety
Discussions of safety within transport typically focus on road safety in the first instance. Worldwide, there is an increasing acknowledgement of the importance of road safety in travel interventions. For example, in the context of low and middle income countries, the World Bank (2017) estimate that traffic injuries have a substantial drag on economic growth, and that “Reducing road traffic injuries in half could translate into an additional 15% to 22% of GDP per capita income growth over 24 years”. Additional growth is uncertain over the long term, but highest in countries such as China where Road traffic incidents account for 7.8% of all deaths in the 15-64 age group ranges. Indeed, the World Bank has increasingly shifted funding towards road safety financing in recent years – with levels in financial years 2019-20 and 2020-21 around 6% of the total World Bank Road and Urban Transport Financing budget, risking to over 14% in 2022-23 and 2023-24. For an example of effectiveness, the World Bank estimates that a Road Safety Support Project in Nepal may save as many as 3,400 lives over the lifetime of the investment. This reflects evidence that road safety investments can have a transformative impact in terms of preventing injuries and casualties (World Bank, 2024).
While the potential to improve road safety in low and middle income countries is often greatest, there is also strong evidence that road safety is a good economic investment in advanced economies – especially in terms of reducing pressures on the health system. For example, a European level systematic review of 29 road safety measures found that up to 25 of the measures are cost effective in Benefit Cost Ratio terms (Daniels et. al., 2019). Similarly an FIA Foundation Research Series Paper looked at the benefit cost ratio of two large packages of road safety measures in Australia – both expensive programmes delivering multiple infrastructure improvements such as roadside or median barriers, hazard removal and intersection treatments. The packages cost approximately $30m AUS and $150m AUS respectively. Both projects delivered a positive benefit cost ratio (1.6 and 2.7) and the majority of lifetime benefits were felt in terms of reduced pressure on the health system (The FIA Foundation, 2016).
Within Scotland, Transport Scotland’s Road Safety Framework to 2030 has a vision for Scotland to have the best road safety performance globally by 2030, with a long-term goal of no one seriously injured or killed on Scottish roads by 2050. This is underpinned by 5 outcomes: safe road use, safe vehicles, safe speeds, safe roads and roadsides, and post-crash response. As illustrated in figure 3.3, over the last 20 years road casualties in Scotland have been on a significant downward trend:
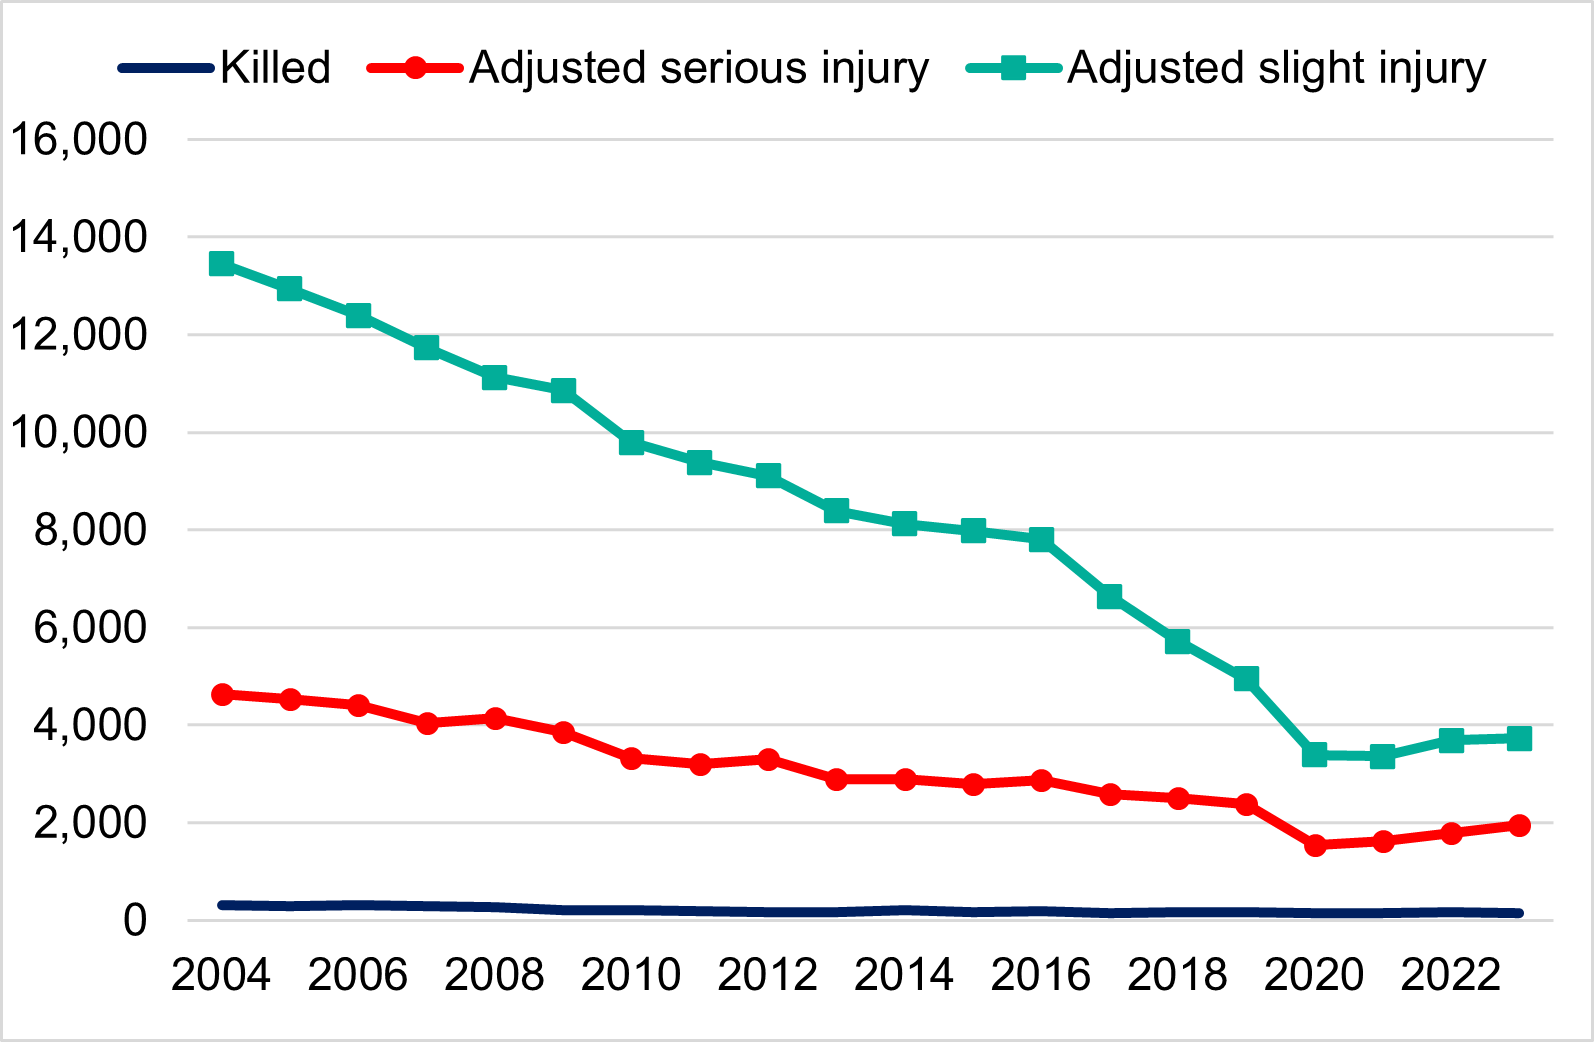
Over the 20 year period to 2023, fatal casualties fell significantly from 308 to 155, a drop of 49.7%. Similarly, those with serious injuries fell 58% from 4,634 to 1,944, a drop of 58%. Despite this long term decline, there have been rises in casualties over recent years – likely reflecting the impact of the pandemic on traffic volumes.
Some of the improvements in road safety can be attributed to better constructed roads and safety improvements in cars themselves, with declines in casualties highest amongst car occupants (Fay, 2017). Wider factors also influence these statistics such as driver and road user behaviour, and advances in medical technology (Noland, 2004). Within a transport context however, investments in road safety measures or changes in road safety policies can make a substantial difference to outcomes achieved. For example:
- Reducing Speed and/or Traffic: As a recent OECD (2018) paper affirms, there is a well established link between speed and crash risks, estimating that inappropriate speed is responsible for 20% to 30% of all fatal road crashes. Effective measures to limit speeds can therefore increase road safety. Within a Scottish context, a recent consultation on the National Speed Management Review (Transport Scotland, 2024) is currently being analysed, noting that “Evidence indicates that these changes could significantly reduce injury collisions, while maintaining journey times and improving journey time reliability”. Similarly there is evidence that measures to reduce traffic levels, such as low traffic neighbourhoods have led to a reduction in road traffic accidents (Laverty et al., 2021).
- Avoiding queues and unsafe conditions: Intelligent travel systems (ITS) can help to reduce road injuries and also ease traffic and other adverse factors such as noise or air pollution. There is significant evidence on how ITS can impact on both personal safety and overall network resilience (Janusova and Cicmancova, 2016).
- Safety Infrastructure: The discussion above highlighted how infrastructure investments have a direct link to road safety via providing a direct safety function – such as barriers for larger roads, or improvements at intersections.
Road safety is not limited to areas where it is the primary purpose of a policy, it can and should also be considered as part of all road policy and decision making. The evidence is mixed on whether or not new roads – even those that are well designed and constructed – will reduce road casualties (Elias and Shiftan, 2011). However in the right circumstances, new infrastructure can route traffic away from hazardous areas and avoid queues. Within a Scottish context, a good example of this is the Maybole Bypass (Transport Scotland, 2022). Road safety played a significant part in the rationale for the recently completed (2022) Maybole Bypass for A77 traffic. Approximately 10% of vehicles using the A77 are heavy goods vehicles (HGVs) which often arrive in convoy from vessels. In order to accommodate this, the restricted footpath width along Maybole High Street has presented a significant risk to both pedestrians and vehicle users' safety. The bypass separates local and strategic traffic, relieving congestion in the town and improving safety, as well as safety and journey time reliability on the A77.
A final point to make is that reducing the dangers of roads can also have wider societal benefits. Any discussion of why road casualty statistics have dropped also needs to acknowledge behaviour change by non-car users of roads. For example, children or old people may start to avoid roads altogether as cars become bigger and move faster, rather than the roads themselves becoming safer (example – Hillman, Adams and Whitelegg, 1990). Evidence suggests that other countries (even those with limited hours of sunlight) achieve considerably better outcomes in terms of child independence than the UK typically does – and that this is associated with safer roads (Shaw et. al., 2015). Another example is possible impacts on crime, with emerging evidence showing that low traffic neighbourhoods may be associated with lower levels of street crime (Aldred and Goodman, 2021). Reflecting these points, it’s possible that by extending the focus of the discussion of road safety beyond casualty statistics, by also on focussing on how safe roads are perceived to be and the role they play in our community, can unlock wider benefits in addition to reducing the harm caused by accidents.
Looking beyond road safety, there are growing priorities to address personal safety concerns of those using or working in public transport. Existing data points to the fact that women use public transport more than men and that their use is conditioned and shaped by intersecting factors, such as income, parental status and membership of ethnic minority and gender diversity (European Parliament, 2021). Women consistently report unease or unwillingness to travel alone at night via public transport due to a fear of crime – nevertheless they may be ‘transit captive’ in that they do not have alternatives. There is evidence that women, whether they are transport workers or passengers, continue to experience public transport as less safe than their male counterparts (Gekoski et. al., 2015).
Despite using public transport more than men, there has been a persistent gap in the production and availability of consistent and reliable data measuring women’s experiences (CIVITAS WIKI (2021) and OECD (2018)). However, more recently, questions around gendered experiences of safety for women and girls (including when using the transport systems) have received increased attention. The UN Women UK is the UK National Committee for the United Nations entity dedicated to gender equality and women’s empowerment, and has a campaign called ‘Safe Spaces Now’. This aims to make UK public spaces safer and more inclusive, which includes on public transport. Looking specifically at sexual harassment, they discuss a YouGov survey in 2020 of adults living in London that found 64% of women experienced harassment on the tube, 38% on the bus and 31% on trains. Furthermore, they note the significant underreporting of these issues, with only 2% of cases raised to transport staff or British Transport police.
Transport Scotland (2023) produced a report based upon a large qualitative research study to capture detailed personal testimony on the experiences of women and girls using public transport. In line with international studies reviewed, the report indicates that wider systemic change is required to maximise safety for women and girls on public transport, with women and girls currently bearing significant responsibilities to adapt their behaviour to feel safe and secure.
The report made 10 recommendations aimed at improving experiences of personal safety for women travelling and working on Scotland’s Public Transport System. These ranged from introducing systems to monitor, upgrade and repair communication systems and lighting across all services, and a comprehensive review of staff training. The report brought Scottish-specific evidence to an existing evidence gap, and was well received by stakeholders:
British Transport Police Superintendent Arlene Wilson:
Women’s safety on the rail network is a key priority for BTP. The findings from this research will support our aim of ensuring every woman and girl can travel on the rail network without fear of harassment or intimidation. We will use these findings to work with our partners to ensure that sexual harassment will not be tolerated on the network and we will always take reports of this behaviour seriously.”
Kate Wallace, CEO of Victim Support Scotland:
Victim Support Scotland welcomes this focus on increasing women and girls’ safety on public transport. While incidents are still too high, we welcome steps being taken to improve reporting and for complaints to be taken seriously.”
This work was part of a wider a programme of research and activities the outputs of which can be accessed via a webpage on the Transport Scotland website.
Health – Benefits of Encouraging Healthy Travel Choices
In the discussion of safety above, the benefits of reducing harm were the primary focus. However, the rest of this section will focus more on the benefits that transport can have in a health and wellbeing context. In terms of our health, making healthy travel choices help us achieve better health outcomes and also reduce pressures on health budgets in the process.
This point was made more formally and robustly in a World Health Organization (2022) paper on Walking and cycling which noted that “Numerous studies show that active travel translates into higher overall levels of physical activity. Thus, walking and cycling do not merely substitute for other forms of exercise, but rather, at least in part, replace passive forms of transport”. By increasing physical activity levels, active travel can help reduce a wide range of bad outcomes that are associated with physical inactivity and improve our quality of life.
A literature review for Transport Scotland (2023) found substantial evidence of economic, health and environmental benefits. The review noted that health benefits comprise the majority of the benefits accrued from engagement in active travel. Within health benefits, evidence was found to be strongest for the heightened risk of several chronic health conditions, including cardiovascular disease (CVD), stroke, obesity, colon and breast cancer, type II diabetes, osteoporosis, depression and anxiety. The review also identified ways in which individuals engaging in active travel can benefit the wider economy if numbers of active travellers increased substantially. For example, reduced pressures on the NHS and reduced numbers of sick days that employees take, thereby boosting productivity.
Similarly, according to the Sustrans Walking and Cycling Index (2023), every year walking, wheeling and cycling in Scotland’s eight cities results in 4,251 serious long-term health conditions prevented, £1.1 billion in economic benefit for individuals and index cities and over £50 million savings a year for the NHS.
On an individual project level, there are also substantial benefits that can be unlocked by investing in active travel. For example, in a paper looking at a three year evaluation of investments in active travel infrastructure in Outer London, Aldred, Woodcock and Goodman (2021) found a health specific economic benefit of £724m resulting from interventions that cost just £80m. A key point is that often to increase active travel, it is necessary to reduce car travel with active travel being used as a substitute for, rather than complement to pre-existing car use. This mimics the behavioural discussion in the safety section above that a reduction in car use can create the conditions for achieving broader positive outcomes.
Much of this discussion focusses on the health benefits of active travel to those engaging in walking, wheeling or cycling. However, there may also be considerable environmental and broader benefits by a significant modal shift from car to active travel. An improvement in overall air quality for example would benefit all of those who reside or spend time in a particular locality - not just those actively engaging in active travel. In this regard, the WHO (2022) note that “Most studies have shown small impacts on general population health, although more ambitious mode shift scenarios indicate that gains in population level health through air quality improvements could be substantial”. Similarly, a modal shift away from cars and toward active travel could be expected to increase traffic safety – with the WHO noting that “comparing crash rates to levels of active travel also clearly demonstrates the strong relation between safety and higher levels of walking and cycling”. This could also help improve some of the ‘behavioural’ aspects of road safety discussed above.
Wellbeing
Introduction
Much of this paper focuses on evidence about how transport (in general, or in terms of a specific project) helps support the economy and improve our lives. However, the focus of this chapter is a bit different – looking at the role of transport (alongside other policies) in impacting on our wellbeing. Measures of wellbeing typically extend beyond headline economic measures such as GDP or labour market statistics.
Wellbeing is a positive state experienced by individuals and societies. Wellbeing encompasses quality of life and the ability of people and societies to contribute to the world with a sense of meaning and purpose. Focusing on wellbeing supports the tracking of the equitable distribution of resources, overall thriving and sustainability. A society’s wellbeing can be determined by the extent to which it is resilient, builds capacity for action, and is prepared to transcend challenges. Wellbeing is not a binary concept; it's a spectrum or continuum, not just the absence of illness or disorder (WHO, accessed 2025). Therefore, a useful framework in considering wellbeing is Maslow’s Hierarchy of Needs and how unmet needs can hinder it. Maslow’s hierarchy can also be translated into the role that transport plays in people’s lives – as illustrated in figure 3.4.

Physiological needs refer to essentials like food, shelter, and water; without mobility these cannot be met. Safety needs include protecting our society from harm and are directly correlated to providing a safe transport system. Love and belonging needs are enabled by transport facilities by providing social connection. Developing comprehensive public transport systems that connect different communities can facilitate social interaction and build a sense of belonging. Esteem needs are focussed on the desire for respect, recognition, achievement and confidence in oneself. Having access to reliable transport can increase one's social standing and confidence, positively impacting esteem. The term “Self-Actualisation” is used within the Hierarchy of Needs to represent the desire to achieve one's full potential, pursue personal growth, and experience fulfilment. Access to transport enables individuals to pursue their passions, hobbies, and personal growth opportunities, contributing to personal fulfilment and well-being.
How our built environment influences wellbeing – and the role of transport
The built environment comprises a number of components of which transport systems are one alongside housing, urban design and other infrastructure. Each of these components of our surrounding environments impact on our wellbeing and can do this positively or negatively depending on how well they are designed (OECD, 2023). Clearly, the transport network itself influences our transport behaviours, which have knock on impacts on areas like our health and personal finances. However, the way that transport interacts with the rest of the world around us, including the built environment, the location of our services and of job opportunities, is often considered just as important (and arguable more so). This shapes the places that we live and the communities that we are members of.
Well planned places are integral to the wellbeing of our people and our society. Transport is not just the access it provides – it must encapsulate and consider the places we live, work and play. The opportunities for betterment in our communities are seen as an integral part of transport planning, as it is widely recognised that transport is an enabler as well as a disabler.
These concepts are recognised as abstract. Thus, to illustrate how transport can synergise with other key strands of policy making and impact wellbeing, examples are presented below:
International Example: The Netherlands is renowned for having extremely high levels of cycling – yet this was not always the case. In the 1970s, transport networks were dominated by cars, however, there was significant public sentiment against the impact of cars on people’s safety and the environment (see for example, Thomas (2023) and Bruno et al. (2021)). Policy in the Netherlands has since taken a conscious decision to promote and protect cycling. In particular, the Dutch Ministry of Transport developed a national strategy for the promotion of cycling, the Dutch Bicycle Master Plan, in 1990 (ECMT ,2004). This was made up of over 112 projects – but also stimulating local government to develop similar strategies and establish cycling schemes as an integral part of their planning. Today, over a quarter of journeys in the Netherlands are made by bicycle (KiM NITPA, 2024) - and the Netherlands has achieved many of the benefits set out in the Health section above. More recent commentary has focussed on the link between transport choices and child wellbeing. Child wellbeing in the Netherlands is amongst the highest in the world (UNICEF Innocenti, 2020). This is likely driven, in part, by these changes in transport outcomes. There is a well-established link between traffic levels and reduced children’s independence, for example a 2015 Policy Studies Institute report on children’s independent mobility notes that “traffic seeming to be the strongest factor affecting the granting of independent mobility” (Shaw et al., 2015) and notes the positive effects of policies designed at increasing child independence in Rotterdam. In this example, a specific programme was delivered to ensure desired outcomes developed into tangible results, by transforming parts of the built environment to make the city more child friendly (City of Rotterdam, 2022). Similarly, at a national level, many active travel advocates argue that cycling plays a key role in improving child wellbeing (Bruntlett, 2021). Indeed, cycling is one of the main factors UNICEF identify as being associated with higher levels of child wellbeing, and the Netherlands performs exceptionally well in terms of the proportion of children cycling to school when compared with other European countries (see Mobycon, 2019).
In a Scottish context, there is evidence of demand for similar benefits being secured. For example Sustrans (2025) recently published the first Children’s Walking and Cycling Index. The report notes that children between the ages of 6 and 15 years old supported more traffic-free paths, quiet routes for walking and cycling, and the creation of more segregated cycle paths along roads.
There is also a significant amount of evidence of how transport impacts wellbeing in Scotland. Transport Scotland has recently published a series of evidence papers looking at the impact on wellbeing of key aspects of our public transport system in particular. For example, several survey respondents also suggested that the Young Persons’ Free Bus Travel Scheme was beneficial for young people’s mental health, and was seen as particularly supportive in this respect after Covid-19 and the related isolation (Transport Scotland, 2023):
More activities to meet new people and socialise, really positive for mental wellbeing.” (Follow-up survey)
I can go out and socialise with my friends more which has helped after Covid where we were stuck in.” (Follow-up survey)
As a teen my child chooses to travel to meet her friends. I'm very grateful for the free bus travel. It gave kids more freedom after Covid and now a huge help during cost-of-living crisis.” (Follow-up survey)
Parents/carers (particularly of teenagers) who participated in the focus groups also spoke of their children/young people feeling less under scrutiny as a result of the Young Persons’ Free Bus Travel Scheme, i.e. there were fewer concerns about parents dropping off or picking up and “spying” on young people, as they could travel to/from places with more privacy:
I would say it’s definitely given them more independence… realising that she can be dropped off at the cinema instead of relying on her dad, which is embarrassing if your friends are waiting… and I think it’s encouraged her to be a bit braver too, and to be more resilient.” (Parent/Carer of Scheme User)
As a result, there had been some unexpected benefits to the quality of relationships between parents and their children:
I think our relationship has actually got better because she feels that we trust her and that she and her friends have their own time that is more relaxed and independent, that allows her to feel like a young adult.” (Parent/Carer of Scheme User)
And this mirrors more specific work undertaken by Public Health Scotland on Transport and Health. Of course, public transport can also have negative impacts on wellbeing, as noted by Transport Scotland (2023) particularly in the context of women and girls’ safety:
Alongside private vehicles, women and girls used mainly bus and train to travel, and public transport was seen as an essential and affordable way for many to achieve independent social mobility."
The main social impacts of women’s and girls’ personal safety concerns was extending or reducing their journeys, being selective in the type of public transport chosen based on the time of day/situation, using private instead of public transport to complete all or part of their journeys or restricting their travel to only familiar routes or travel at certain times of the day."
It is hoped that this discussion helps reflect how transport forms a key component of the places we live in – and how the built environment we live in and the transport options available to us influence our wellbeing – both as individuals and as a society. This also has implications regarding the role that transport plays in decision making. Where transport is not a priority, or a consideration in wider infrastructure decision making and placemaking, opportunities to change our built environment will be limited. On the other hand, although it plays a key part of how we shape our built environment, far more can be achieved than just changing transport behaviours.
Inequalities: Ensuring Accessibility for Those Without Access to a Car
Scottish Household Survey data tells us a significant amount about our travel habits. For adults, travelling by car is arguably the key and most common type of day-to-day travel in Scotland. Cars represent the main mode of travel to work in Scotland for 68% of individuals (this compares to just 24% of main mode of travel to school, which is dominated by walking – 53% - with buses also playing a significant role – 18%).
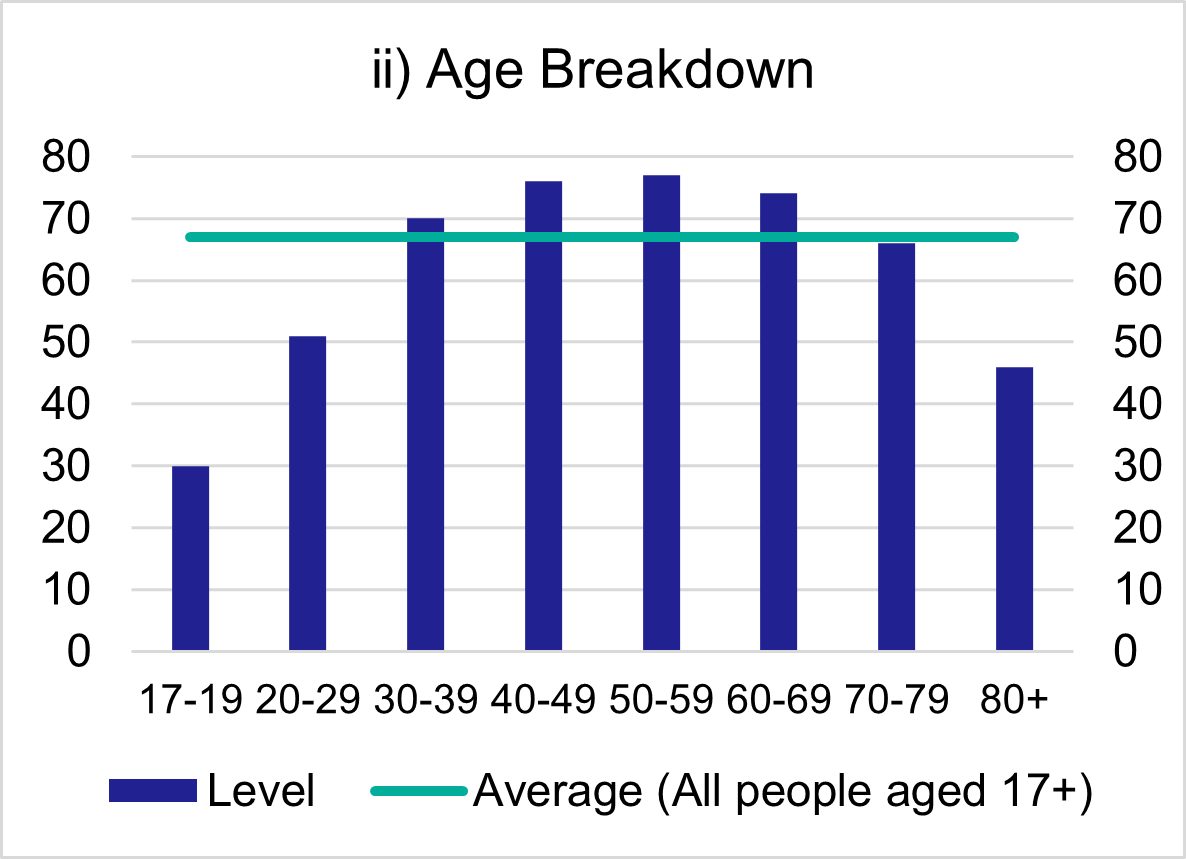
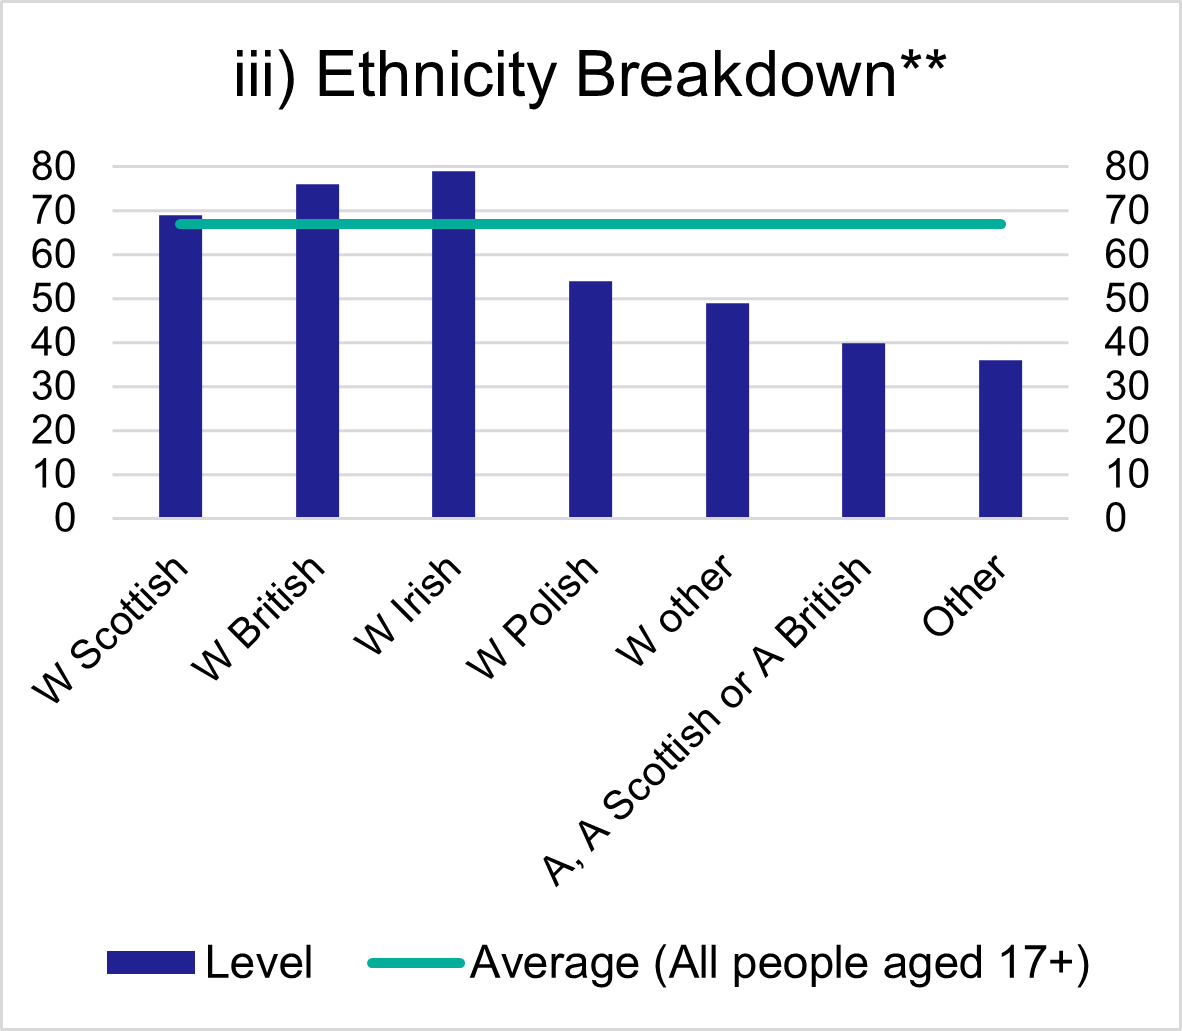
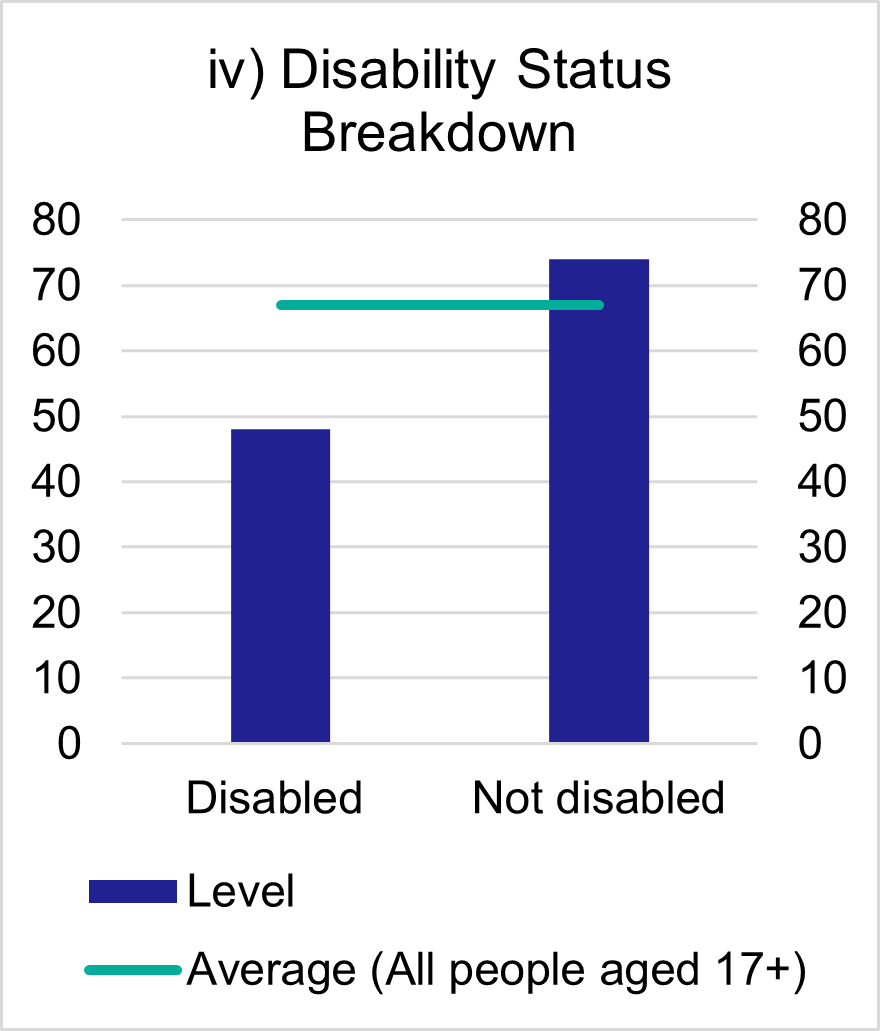
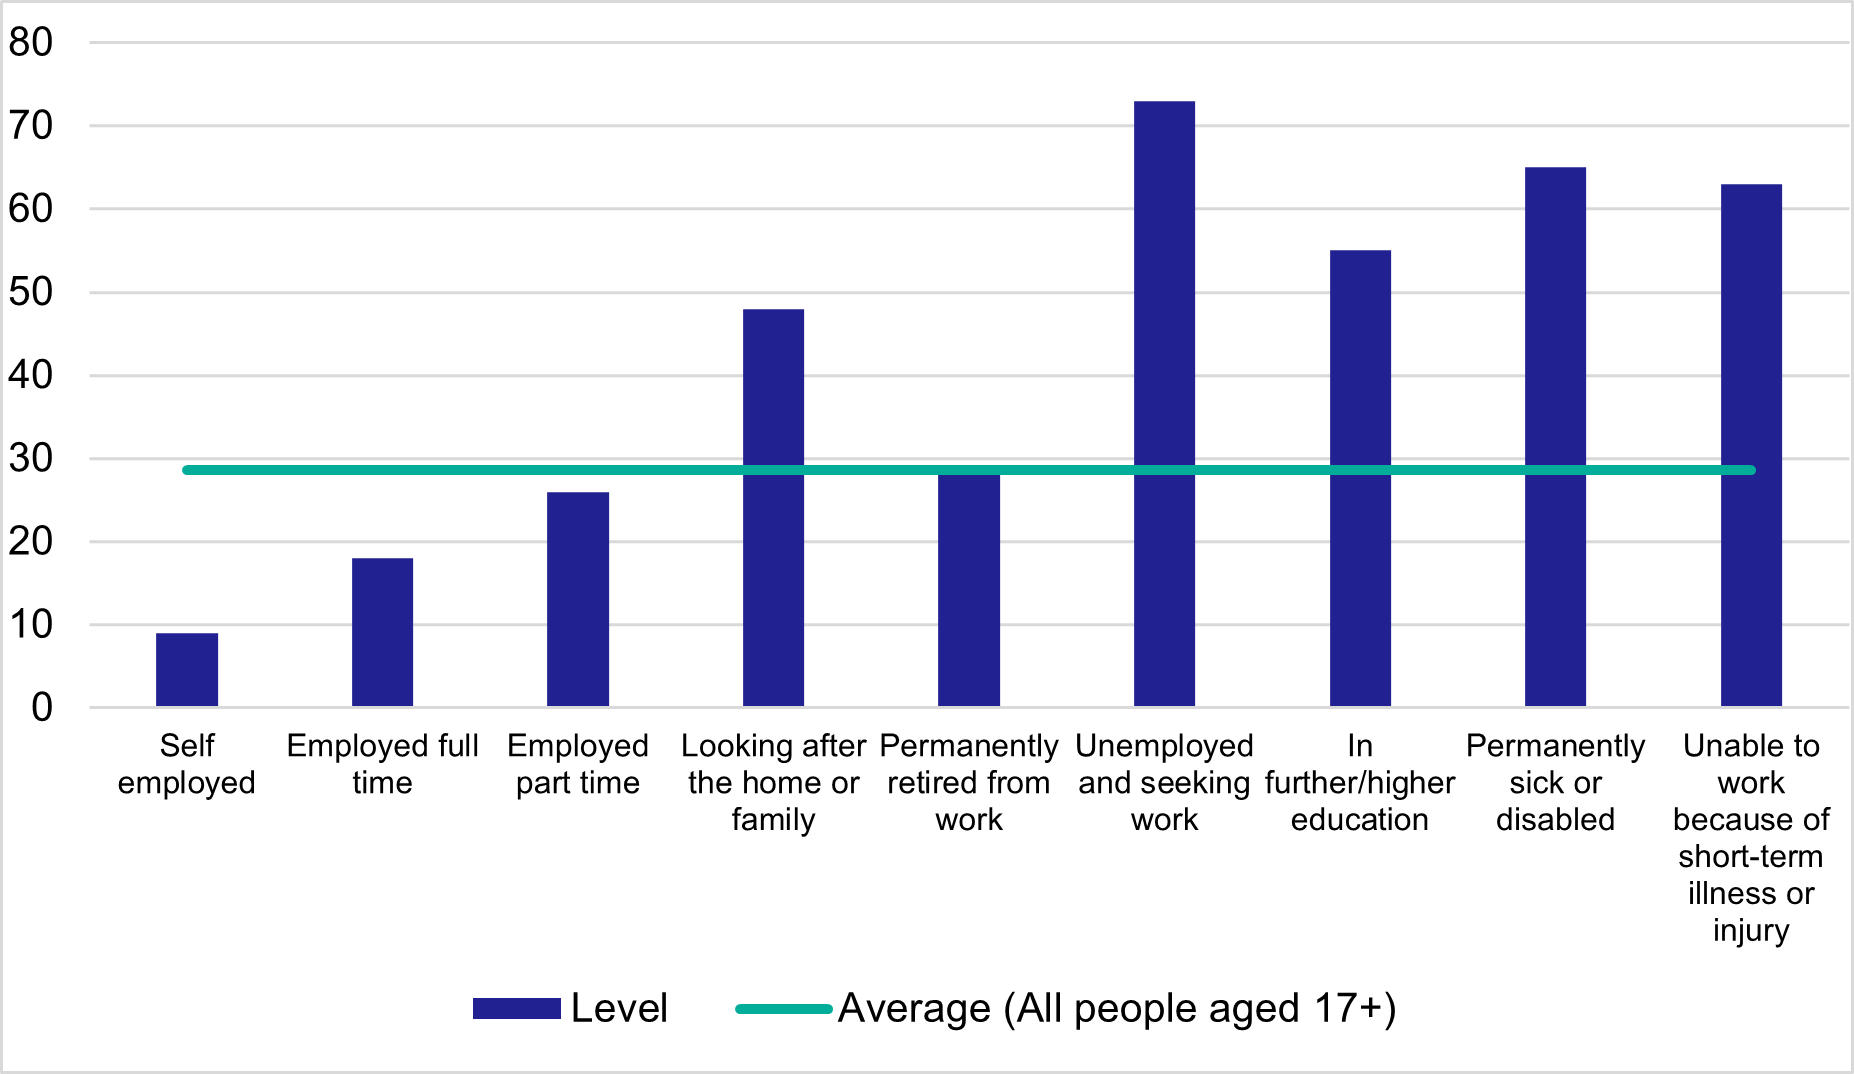
On an individual level, travel to work is clearly essential. Taking advantage of employment opportunities and greater levels of accessibility and mobility can enable individuals to pursue employment that offers them a better standard of living. Despite being the main mode of travel to work, car travel is not available or affordable to all. Looking further at factors associated with car access will both help us understand this better and therefore understand the vital importance of providing alternatives (i.e. public and active travel) for those without access to car travel. Figure 3.5 (i-iv), below, looks at Scottish Household Survey data on how many people regularly drive a car across different protected characteristic groups.

*_For gender, there are three response categories: Male, Female, Prefer not to say. In the data, prefer not to say is too small a sample size to be statistically significant.
** Key for results – W: White; A: Asian; Other: all other ethnic groups.
Looking at the results, it is clear that driving is strongly associated with being male, white Scottish/British/Irish and being nondisabled. Females, individuals who identify as disabled and those whose ethnicity is either Asian or Other (as distinct from various categories covering White and Asian ethnicities) drive less frequently. Driving is also more common in middle age ranges (30-69) and far less common for younger (17-19) and older (80+) age groups.
For those in employment, the means by which they travel to work tends to be via a car, albeit for different income groups there are significantly different trends (see Figure 3.6):
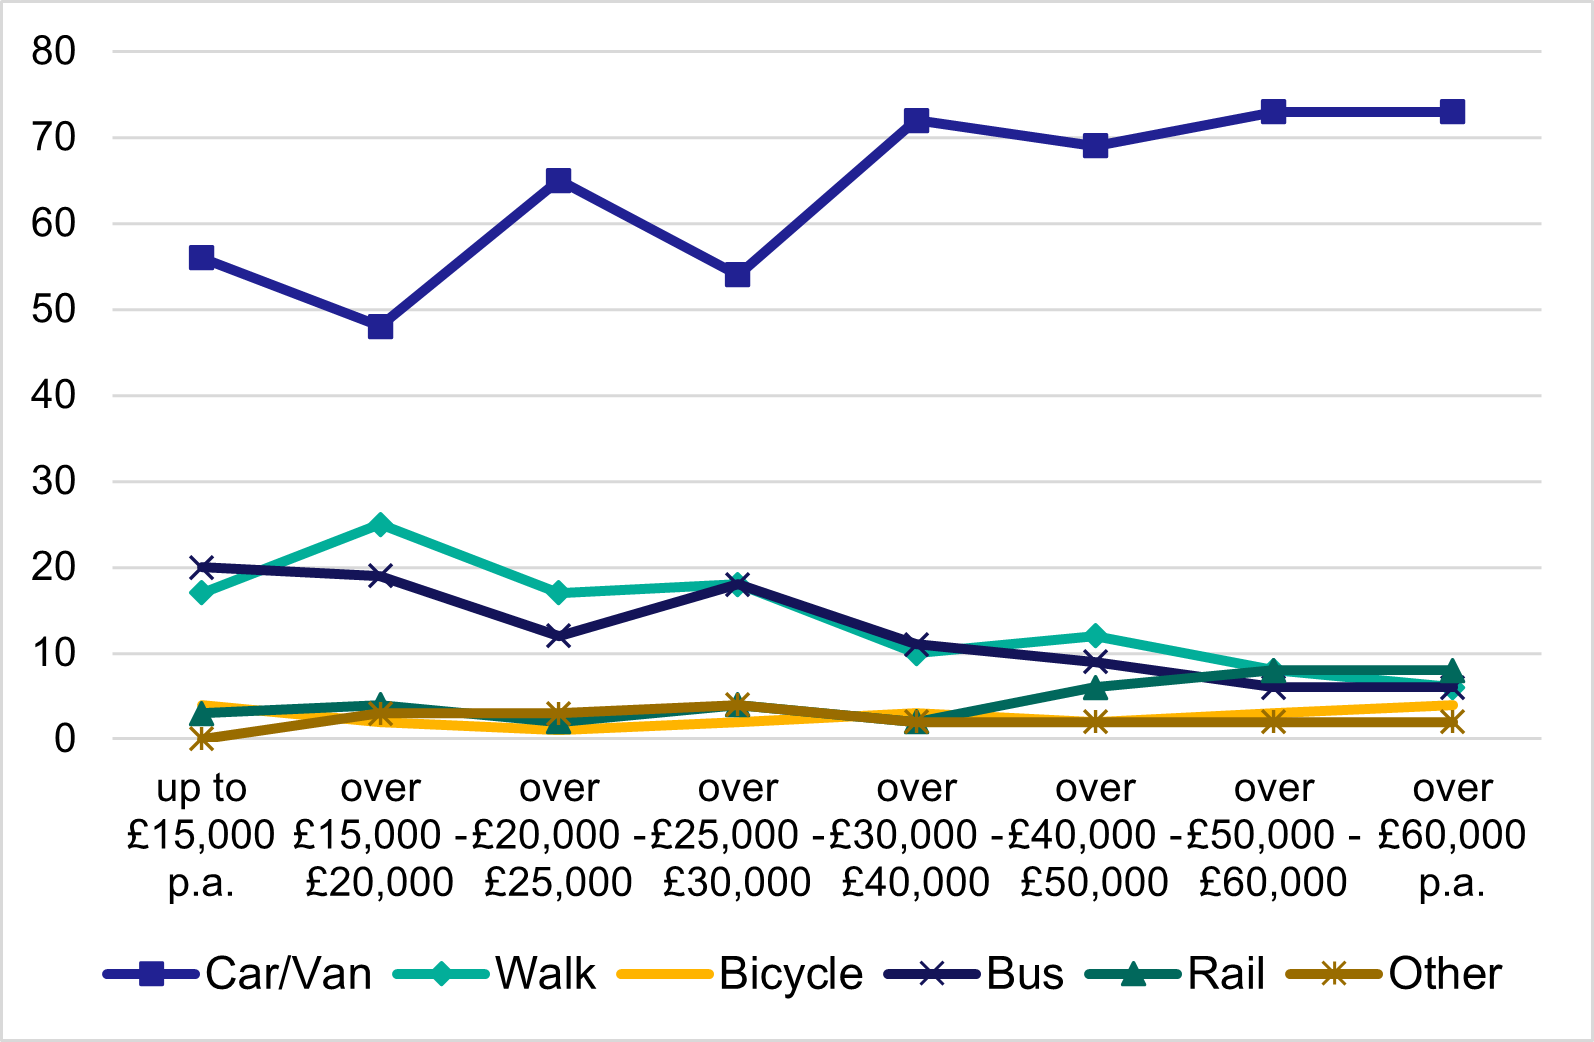
Walking and taking a bus are the most common alternative (i.e. non car) forms of travel to work but are disproportionately common among lower income groups. Conversely rail is a relatively unpopular method of travel to work, outside of higher income groups.
There is also a stark difference in the levels of access to car travel depending on employment status, as seen in Figure 3.5. The group most likely to not hold a driver’s license are those unemployed and seeking work (73% of individuals in this group did not hold a driving licence, compared to an overall average of 28.6% amongst all people aged 17+). Those permanently sick or disabled (65%) and those unable to work because of short-term illness or injury (63%) are also more likely to not hold a driver’s license. By contrast less than 10% of self-employed individuals and less than 20% of those in full time employment do not hold a driver’s license.
Combining these pieces of information tells us a clear equalities narrative and has implications if we want to address inequalities and increase mobility for all groups of society. It is important to invest in alternatives to car travel if we want to reach all of these groups and essential for ensuring those not in work retain access to a larger pool of jobs as a means to help them join, or return to, the workforce. While this paper has focussed on inequalities at an individual level, it has key implications in terms of place and addressing clusters of geographic inequality as well. For example an paper from the OECD (2020) notes that “While better connectivity will increase overall productivity levels (Duranton and Puga, 2004), the possibility to access jobs outside of one’s own neighbourhood is vital in poorer neighbourhoods where employment options within the neighbourhood are limited (Mayer and Trevien, 2017). At the same time, residents in these neighbourhoods are especially likely to lack access to their own car and are therefore reliant on good public transport. More generally, public transport investments are essential elements of inclusive growth strategies, as they generate economic growth while benefitting especially low-income households."
A lack of access to car travel has implications beyond travelling to work and accessing economic opportunities. The Urban Transport Group argues that transport must meet the four ‘A’s to ensure social inclusion (UTG, 2022). Those are available, accessible, affordable, and appropriate – when transport falls short of these criteria, groups are vulnerable to social exclusion. Therefore, effective transport is critical in facilitating social interactions and fostering connectedness.
Addressing inequalities is one of the four NTS2 priorities that were introduced in the context section of this paper. In line with this, a substantial amount of the activity that Transport Scotland does is aimed at addressing inequalities, most notably via trying to ensure that access to car travel is not an essential element of pursuing economic opportunities. This includes better targeting of public funds towards supporting access to public transport for those who need it most and the delivery of concessionary travel alongside a wide range of other support. It also includes promoting active travel which can support delivery of a more equitable transport network, ensuring people can walk, wheel or cycle to access the public transport network, meaning children and their families are not denied access to services or amenities through want of car ownership. For a more detailed discussion of the wider policy landscape aimed at addressing transport inequalities, please see Transport Scotland (2024).
Implications of Scotland’s Geography
Introduction
It is important to acknowledge the role of geography and the spatial distribution of Scotland’s population when considering how Scotland’s transport network has developed, and how it may change in the future.
Scotland is a relatively sparsely populated country. Looking at Scotland’s Census (2022), Scotland had 70 residents per square kilometre (NRS, 2023), which is lower than EU averages (around 109 residents per square kilometre), and significantly lower than the rest of the UK as a whole (270), as well as much of mainland Europe (see Eurostat data). Scotland also has a diverse environment, with almost 100 inhabited islands, significant natural resources (including those found offshore) and a dramatic landscape in many parts of the country. These are tremendous assets, and shape both opportunities and challenges for our transport network. This section will first discuss Scotland’s geography and population distribution and then move on to discuss some implications for transport in the context of rurality, inequality and car dependency, transport to, from and between the islands, the importance of the trunk road network and the impacts of changes in the distribution of Scotland’s population. A key implication of this is that Scotland’s geography makes it more challenging to deliver transport interventions, but also that those interventions deliver incredible value to our communities. In this respect, transport provision is arguably more important in Scotland than it is for many other countries – and confirms the important role transport provision plays in the context of the powers available to The Scottish Government (which was discussed in the context section of this document).
Scotland’s Geography and Population distribution
Understanding how Scotland’s population is distributed is essential to understanding the context in which our transport system must operate. Indeed, the overall population density levels discussed above mask significant regional variation, which in turn create unique local circumstances. Within our relatively lower population, some council areas have a much higher population density than the rest of Scotland, notably our major cities. The highest population density is found in the Glasgow Local Authority area (3,555 residents per square kilometre), followed by Dundee (2,477), Edinburgh (1,947) and Aberdeen (1,207). Despite these areas of high population density, a large majority of Scotland’s land is classified as rural (98%), with only 17% of the population living there as residents (Scottish Government, 2021). This means that large parts of our country are sparsely populated. This is in stark contrast to other parts of the UK, as set out in figure 3.8 below.
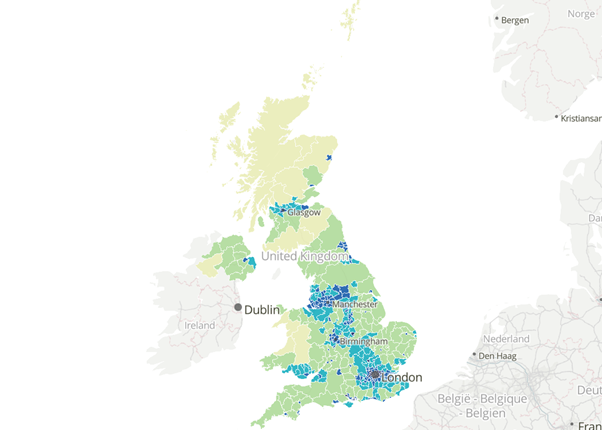
Figure 3.8 shows that a large number of Scottish Local Authorities (accounting for a large proportion of Scotland’s land) have a population density below 47 residents per square kilometre. As a result, Scotland’s transport network must cater for a large concentration of relatively densely populated areas – in particular around the central belt, but it must also serve a much larger geography of relatively sparsely populated areas. The challenge is considerable, and not at all equivalent to the one in England for example, where no single local authority has a population density of under 47 people per square kilometre. By contrast, a large majority of Scotland’s geography falls within this category – including much of Southern Scotland, all of Scotland’s Islands, the Highlands and large areas that are further from the central belt. In a further contrast to England, where a majority of the land is medium density (47-299 residents per square kilometre), Scotland has relatively few medium density regions such as Fife and Angus.
Population shifts within Scotland, similar to those in other advanced economies, have historically been driven by economic opportunities. This is a pattern likely to continue in the future. These dynamics can be dated back to the industrial revolution when areas with thriving industries like shipbuilding and textiles resulted in significant population growth in specific geographies. More recently, there has been a notable population shift from the West to the East of Scotland. Looking at National Records of Scotland (NRS) data from 1981 to 2023, there has been a 40% rise in Aberdeenshire’s population, contrasted with a 22.6% decline in Inverclyde, which can, in part, be attributed to changing economic opportunities. Oil and gas exploration and exploitation has been a major activity in Scottish offshore waters since the late 1960s. The Draft Energy Strategy and Just Transition Plan (Scottish Government, 2023) notes that “Of the 25,000 jobs directly dependent on offshore oil and gas production (2019 figures), 98% are located in Aberdeen and Aberdeenshire.” The resulting prosperity has benefited the area immensely, and Aberdeen is frequently referred to as Europe’s ‘oil capital’. Meanwhile, McIntyre et al. (2022) show that in Scottish regions that experienced high levels of industrial decline, it is common to find weaker labour market outcomes and higher levels of deprivation. Inverclyde, famous for its maritime infrastructure and shipbuilding history, faces significant challenges in this area (FAI, 2022). In a report by the independent Expert Advisory Group on Migration and Population (Scottish Government, 2020), it is also highlighted that underlying drivers of migration may be larger than statistics suggest, with an increasing population of workers commuting further rather than moving their residence. This results in increasing “travel to work areas” for Scotland’s large cities (with obvious implications for the transport system).
Scotland’s geography creates opportunities. The densely populated central belt is ideal for generating benefits that were discussed in the agglomeration chapter, for example, with high levels of connectivity between our two largest cities as well as the surrounding areas. The landscape of the Highlands and Islands is essential to Scotland’s appeal as a tourist destination. They also give Scotland a rich competitive advantage in other sectors, such as oil and gas extraction, and the expanding renewables sector. The Highlands generates more onshore wind electricity than any other UK local authority according to Department for Energy Security and Net Zero (2024) statistics and the Highlands and Islands boast enviable renewables energy assets, especially in terms of offshore wind – with Scotland showing the largest generation from renewables per £ of Gross Value Added. The South of Scotland, full of natural beauty, is an important centre of production and trade, and a connector with our largest export markets in the rest of the UK. Its geography allows for specialisation in forestry and farming including cereals, sheep, beef, and large-scale dairy production as well as a wide diversity of other sectors.
However, Scotland’s geography and the dispersion of our population can also create challenges, particularly for the transport sector. An obvious example is the challenge of connecting island communities, and the need to utilise relatively expensive travel modes such as ferries and low-capacity aircraft to ensure mobility to, from and between these areas. Another challenge is the dependency upon car travel that relatively sparse population distribution creates - and the sheer distance that must be travelled to access employment or services, maintain connections and transport goods across many of Scotland’s communities. The rest of this section focuses on how Scotland’s transport system helps address these challenges, and the value that it provides for Scotland as a result.
Rurality, Inequality and Car Dependency
Scotland’s geography results in particular areas experiencing extreme geographical inequalities – even if those areas do not necessarily underperform in terms of other key outcomes such as income and employment.
The Highlands and Islands as a region is recognised by the UK Government and European Commission as suffering from permanent disadvantage by virtue of its geographical remoteness and sparse population. The geographical difficulties that the Highlands and Islands face can be illustrated via Scottish Index of Multiple Deprivation (SIMD) data. Approximately 7% of Highlands and Islands residents live in a data zone that is in the 20% most deprived in Scotland when looking at ‘overall’ deprivation. However 55% of Highlands and Islands residents live in a data zone that is in the 20% most deprived when looking at the access domain, which looks at public transport and drive times required to access services (all 30 data zones are within the highlands).
This can be explored further via the Rural Scotland Data Dashboard. Due to longer distances between residents and services, many are left reliant on private transport. Adults in accessible rural (82%) and remote rural (75%) areas are significantly more likely to drive to education or work than adults in the rest of Scotland (60%). There is also a stark differentiation between people living within a 15-minute drive to a secondary school – only 63% in remote rural areas, far lower than accessible rural (91%) and the rest of Scotland (100%). The dashboard reports similar patterns in travel times to places of employment and GPs.
Another aspect covered by SIMD data are transport costs. In rural areas, transport costs are relatively high, particularly for working-age households and pensioners. Looking at travel costs in 2021, it is estimated single pensioners spent £54.10 per week in remote rural areas, compared to £15.42 in urban areas. Similarly, working age couples are estimated to have spent £144.78 per week, much higher than in urban areas (£86.65).
A further contributing factor to high private vehicle dependency is public transport availability in these areas. Demand for public transport in low population areas is relatively low compared to central belt operators, making it difficult for services to be commercially viable. This leads to a higher tendency to drive, in turn lowering demand and leading to higher fares and subsidies – a cycle that makes delivering viable services commercially an even bigger challenge for public transport operators. These conditions can act as barriers for young people accessing education, training, or potential employment, which can result in long-term out-migration to urban areas, exacerbating the situation. The Rural Scotland Data Dashboard indicates that residents in remote rural (44%) and accessible rural (53%) areas are the least satisfied with the quality of public transport in Scotland, compared with 78% satisfaction levels in large urban areas.
This is one illustration of the challenges that Scotland’s geography creates in terms of ensuring mobility for all the population.
Transport modes such as light rail and active travel can deliver huge benefits and reduce car dependency in urban areas, but the scope to reduce car dependency via these routes in more rural areas is likely much less significant. While much of this section has discussed the concept of car dependency, it is also important to consider, especially in the context of our more rural communities, the vital role that the road network plays in overcoming our challenging geographies. The importance of car travel in these areas also reflects the immense value provided by our road network and in particular our trunk road network, which is discussed further below.
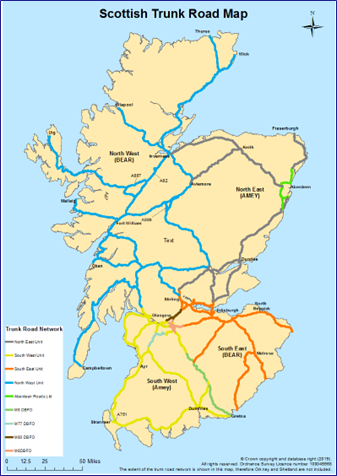
Scotland’s Trunk Road Network
The trunk road network is one of Scotland’s greatest assets. It connects all of Scotland’s cities, towns, airports, and ports to enable movement of people, goods and services - ranging from as far North as Thurso, and as far south as Gretna. The trunk road and motorway network is 2,327 miles long, and has a net asset value of beyond £27.4 billion (See Transport Scotland 2023/24 Annual Audit Report). Approximately 40% of vehicle miles travelled on Scotland’s’ roads occur on the trunk road network.
The trunk road network provides tremendous value in terms of facilitating economic activity. This goes far beyond the discussion of travel to work and services above. In the material discussing the role of transport in supporting the economy, the role of freight was highlighted in terms of supporting the movement of goods and facilitating Scotland’s international trade. The discussion there was primarily focused on Scotland’s international trade. However, this does not come capture the full extent of the impact that the Trunk Road Network has in terms of the movement of goods and the economic activity facilitated as a result. Of the 134 million tonnes of freight lifted that originated in Scotland, over 117 tonnes (almost 90%) had a destination within Scotland (Scottish Transport Statistics, 2025). Much of this supports physical retail, but an increasing amount of freight will support the transition to an ever more ‘on demand’ economy. Consumer Scotland (2023) note that the UK is estimated the be the most advanced e-commerce market in Europe, with online retail accounting for 26.5% of total retail trade in 2022. It is estimated that UK consumers receive on average 75 parcels per person per year, with 162 parcels being delivered per second across the UK. Scotland also carries out a large amount of trade with the rest of the UK. Scotland’s exports to the rest of the UK valued an estimated £48.6 billion in 2021 and accounted for over half (61%) of all Scotland’s exports. The trunk road network is responsible for transporting a large majority of these goods to the rest of the UK (Scottish Export Statistics, 2023), with a large majority destined for England and Wales.
The trunk road network plays an essential role in supporting our day to day lives and keeping large parts of our economy moving. This is especially evident when we see the network disrupted for extended periods of time – such as the recent events of Storm Éowyn, which featured a period when a red weather warning and advice against travel was issued (see Transport Scotland press release) for large parts of Scotland. The immediate impact included many individuals not being able to travel to work, impacting our economy in terms of lost inputs. The knock-on economic implications were also large. Losses will have been incurred where perishable goods could not be stored or delivered in time. Wider impacts were felt across Scotland in terms of deliveries not being made (whether for physical or online retail), causing significant disruption. This was only a brief pause in the operation of the network. Imagining how Scotland’s economy would sustain itself through an extended disruption to the network would be difficult. Maintaining a functioning trunk road network is made all the more important by the nature of our geography and the number of communities dependent on the trunk road network for access to community, jobs and services as well as the delivery of goods.
A more detailed exploration of the benefits provided by the trunk road network is given in report by Abell et al. (2017) for Transport Scotland, which estimated that the Trunk Road Network generated employment for 31,000 people in Scotland, £358m in tax receipts and contributed 1.38bn in GVA to the economy (in 2016 prices). Benefits such as reduced road traffic accidents and emissions (versus a scenario where only local roads are used) are also modelled.
Islands – Ferries & Air
The islands themselves face further unique challenges both within the islands and in terms of accessing the mainland. There are 93 inhabited islands (out of 790), with communities reporting higher costs, a reliance on ferries, and lengthy distances from services. This, paired with depopulation, creates issues surrounding service provision and sustainability on the islands themselves. In turn, this builds a need for greater accessibility to mainland Scotland (Scottish Government, 2023).
The islands are strong economic contributors to Scotland’s economy. They support various sectors on the mainland, as well as having obvious competitive advantages in areas such as fishing, whisky and renewables. In terms of Scotland’s fishing sector, Shetland saw the second highest number of landings in 2023, bringing in over 64,000 tonnage (valued at £98.3 million) into Scotland (Scottish Sea Fisheries Statistics, 2024). Stornoway and Orkney were also significant contributors, with £13.9 million and £8.6 million landed respectively. Another significant sector being supported is Whisky – there are 22 distilleries on Scottish Islands, with 10 in Islay alone. The importance of the whisky sector is well established, with Scotch Whisky production estimated to have generated £6.3 billion GVA in 2022, as well as providing local jobs and tourist attractions (Scottish Whisky Association, 2024). The area also has clear advantages and potential in terms of renewables. For example, the Scottish Energy Strategy notes that “Orkney hosts not only the world's first grid-connected wave and tidal test centre (the European Marine Energy Centre) but also the world's largest tidal turbine (ScotRenewables), whilst the Pentland Firth is home to the world's largest planned tidal stream array (MeyGen)” (Scottish Government, 2017).
Transport is crucial in maintaining the two-way-relationship that exists between supporting the islands and the islands supporting the mainland.
In 2023, Scottish ferries had 8.0 million passengers on routes within Scotland – and over 2.8 million vehicles (Scottish Transport Statistics, 2025). This was across a mix of routes subsidised by Scottish Government, local authority services and privately run services. The largest subsidised operator was Caledonian MacBrayne ferries which carried 5.1 million of these passengers, 1.45 million cars, and over 80,000 commercial vehicles and buses. Serco Northlink Ferries carried 440,000 passengers and over 90,000 cars.
Providing these essential transport links is extremely expensive. Transport Scotland Analysis for the Fair Fairs Review suggests that in terms of public expenditure per passenger km, ferry travel is 100 times more expensive that roads, ten times more expensive than bus, and over three times more expensive than rail (Transport Scotland, 2024). In 2025-26, Scotland’s Ferry Services budget is set to exceed £500m for the first time, with ferries accounting for around £1 in every £8 of spend within the transport budget (see Scottish Government Budget 2025 to 2026).
Despite the levels of funding achieved, significant challenges remain, particularly in terms of islander’s transport spend. A research report, ‘The Cost of Remoteness’ (Scottish Government, 2021) identified transport as the most fundamental difference between island and mainland household budgets. Island groups agreed all households need a vehicle for intra-island transport, increasing to one vehicle per adult in working age households with public transport reliance difficult given a lack of services reflecting low population density. This creates a dependency for private vehicles for day-to-day activities.
For travel to and from the mainland, a Scottish Government (2023) data overview highlights that only 19% of island residents think flights to and from the mainland are good value for money, and that they are dissatisfied with the cost and reliability of inter-island air services. This feeds into greater dependency on ferries services to uphold accessibility. This not only reflects islanders travel preferences, but also commercial airport infrastructure, with some islands (such as Mull) left with no other options than ferry travel to access the mainland, and those with commercial flights are limited.
Ferries can help address but cannot overcome the challenges faced by island communities in terms of transport. Highland and Islands Enterprise (HIE) ‘My Life in the Highlands and Islands’ research (HIE, 2022) found that 45% of islander respondents were dissatisfied with ferry reliability. This rose to 50% amongst Outer Hebrides respondents and 64% amongst respondents in Argyll and the Islands. In response to the Consultation on the Islands Connectivity Plan (Transport Scotland, 2024), respondents reported having difficulties in attending medical appointments, social and family events, further/higher education and business appointments. Improving reliability was seen as key to building greater confidence among tourists and businesses, leading to increased economic activity and investment.
Similar to the value provided by the trunk road network (which is also extremely important for linking ports to destinations), the immense challenges and benefits of connecting Scotland’s Islands are another major implication of Scotland’s geography for our transport network.
Transport and the changing nature of Scotland’s population and economy
This chapter has discussed the role of transport in addressing the challenges created by Scotland’s Geography as well as by the spatial distribution of Scotland’s population. However, it’s also important to note that Scotland’s’ population distribution is not fixed, and that transport has a role to play both in terms of influencing and responding to population change.
Following on from the discussion of island communities and ferries above, one obvious point is the role of transport (in particular ferry, air and bus travel) in addressing population decline and ensuring a healthy, balanced population profile for Scotland’s islands – the first Strategic Objective of Scotland’s National Islands Plan (Scottish Government, 2019). During the consultation for this plan (which involved face to face engagement with over 1,000 people), transport was the issue that was brought up the most. This helps show the importance of transport itself in influencing population change.
An important determinant of the demands that the transport system will face over the coming decades will be the structural changes we are likely to see within the economy and its implications for Scotland’s population. The West to East population movement discussed in the opening of this chapter has, of course, raised significant issues from a transport perspective. The concentration of economic activity within Scotland’s central belt has led to much of the focus of transport investment enabling this activity – boosting the connectiveness of Scotland’s major cities and ensuring improvements in mobility across and to the central belt, as discussed in the agglomeration section of this paper.
There will continue to be a geographic element to future changes in economic activity. An example of this is likely continued movement from South to North, with Inverness in particular (but the Highlands and Islands more generally) set to be important area for key emerging industries. Inverness is already recognised as one of the fastest-growing economic areas in the UK. The population of Inverness increased by more than Highland and Scottish averages between 2010 and 2020, and significant population growth is expected out to 2041 (area profile, accessed June 2025). Success has been driven by factors such as the creation and expansion of the University of the Highlands and Islands and growth in the life science industry. Further economic opportunity and population increase is expected as a result of the energy transition and expansion of renewables and the role they play within the economy.
It is essential that the transport network can properly facilitate a growing renewables sector, with transport acting as a key enabler for almost all renewable technologies. Suitable transport provision is particularly important in terms of minimising upfront costs and the construction phase for many projects. It plays a key role in terms of getting people to remote work sites and the resulting shifts of population around the country will also have important transport implications. As such, investment in transport can help ensure that Scotland takes full advantages of economic opportunities offered by renewable energy, energy transition, carbon capture utilisation and storage.
In some cases, the emergent nature of renewables technology means that the implication for transport is still being understood, however it’s clear that there will be large interdependencies between transport and renewables. Wind power, which is well established, is a good example to use to illustrate some of these issues. In a Baringa (2014) report for the Department for Energy Security and Net Zero (DESNZ), vessels and ports are identified as a “High” supply chain risk for offshore wind and transport as a “medium” risk for onshore wind.
The size of components required for offshore wind mean that specialised transport solutions are required. Vessels must be capable of installing extremely large foundations (which can exceed 3,000 tonnes). Globally there is expected to be a shortage of such vessels in the coming one to three years, with relatively few vessels on the market capable of carrying out this work. Furthermore, shortages are also expected for cable installation vessels, and there are other installation related supply chain risks. There are limited numbers of shipyards capable of producing these vessels, and lead times are long. The DESNZ report also notes that the UK has a shortage of deep-water port capacity, which puts offshore wind asset deployments at risk, and that port capacity will also be required for other priorities such as decommissioning. Facilities such as the King George V Dock (2024), which reports it will have likely handled over a thousand offshore wind components (with a total weight of over 60,000 tonnes), are essential to enabling and facilitating offshore wind expansion.
Transport is also a key enabler for onshore wind. While onshore wind components are typically not as large as offshore ones, they will often need to be transported by road, which creates a different set of challenges. Large turbine components class as abnormal / large loads and must be transported at off-peak hours with a police escort for safety reasons. With wind turbines becoming increasingly larger, this complicates matters significantly and it is reported that transport costs can represent 7-10% of total project costs (Iberdrola, 2022). A particular issue is the extent to which Scotland’s road network (both in terms of strategic and local roads) can withstand the weight of the loads being moved – with particular issues coming up where the roads are not designed to support such large weights (creating a need for increased maintenance or even upgrades). Structures, like bridges, cause particular problems. This is not only difficult in terms of constraints and costs for those moving these components but it also has a knock-on impact for other road users. Ensuring efficient and reliable transport for these projects can therefore greatly assist the sector.
More broadly than simply moving components themselves, it is also important that the transport network can ably support the industry, particularly if it requires a large number of people to be working on remote sites for extended periods, which could put extra strain on parts of the network that are not necessarily built with this capacity in mind (for example, increasing demands on particular ferry routes).
The economic shift towards the renewables sector (including but also beyond wind power) will also have implications for the distribution of Scotland’s population, and the transport demands that places on the Transport system. Transport is a key enabler of these economic changes and also interacts with other key enablers (such as housing) in ways that both create the conditions for growth and change, and impacting centrally on the lives of people as they pursue new economic opportunities. Just as it was and is essential for transport to respond to West to East movements, it will be essential to respond to South to North movements. Indeed, a recent HIE (2025) report on regional transformation opportunities (RTOs) in the Highlands and Islands emphasises the role of transport: “Transport is a critical enabler for all RTO sectors, and this extends across all major transportation modes including inter-island ferries. The scale of development means that across the road, rail, air and sea transport network there will be increasing demand for capacity to transport people, equipment, and materials.” Within this report, specific ongoing projects are discussed across all transport modes. In particular, major investments in improving road infrastructure (arterial routes such like the A9 and the A96, as well as roads offering clustered benefits such as the A82, A83 and Rest and Be Thankful), renewing and upgrading the fleet of ferries operating in the region and investments in rail infrastructure to further electrify lines and replace rolling stock will be important for supporting the anticipated economic changes and population shifts.
The implications of population changes for transport go beyond strategic transport links.
The role of transport in contributing to well-planned places is particularly important where a population is expected to rapidly expand or decline. Within local decision making, transport decisions can shape and improve the places we live in. One example may be instances where there is a housing shortage – such as we currently see with increasing pressures around Inverness. Without transport contributing to well-planned neighbourhoods, we are likely to see an increase in car dependency and will not realise the benefits discussed in the health and wellbeing sections of the paper. Having transport as a key part of local decision making, aligned to other policy areas such as housing and economic development, is therefore hugely important.
The chapter started by suggesting that transport is more important in a Scottish context than it is for many other countries – and at times of significant change, this is likely to become increasingly true.