Demographic characteristics of disabled people in the Scottish Household Survey
Overview
As well as the particular issues relating to how their disability affects travel, disabled people’s travel will be affected by factors such as age, employment status, and income. When examining Scottish Household Survey data, there are substantial differences between the disabled and non-disabled population for these three particular factors.
Our analysis for this publication generally does not control for these differences. This is a potential area for future analysis.
Whether someone lives in an urban or rural location will also affect travel, although the same proportion of disabled and non-disabled people live in urban areas.
Age
The Transport and Travel in Scotland statistics publication, which summarises transport findings from the Scottish Household Survey, shows that beyond the age of 60, people start to travel less frequently and become less likely to drive.
Disabled people are, on average, noticeably older than those who are not disabled (median age 59 compared to 45). [shown in Figure 1 below] Fewer disabled people will be of working age, which will affect travel patterns.
There is much less difference in age between those whose condition reduces their ability to carry out day-to-day tasks a lot and those whose condition affects activities a little (60 to 58). [shown in Figure 1 below]
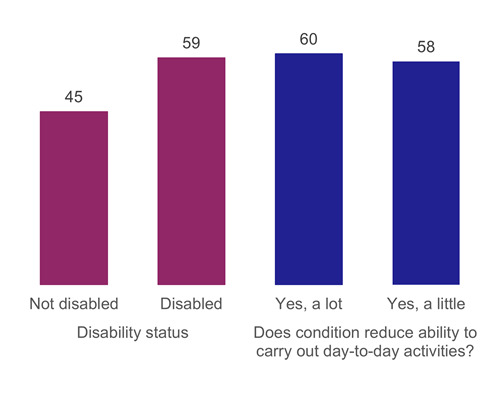
Figure 1: Median age, by whether adult is disabled and whether their condition limits their ability to carry out day-to-day tasks, 2017-2021 (combined)
For most conditions, average age is greater than for the non-disabled population, although those with learning or behavioural problems (28) and dyslexia (41) are younger. The oldest median ages are for people with hearing difficulties (72), difficulty seeing (69), heart, blood pressure or circulation problems (69) and arthritis (68).
Employment status
People in full-time employment are more likely to make regular commuting journeys (certainly prior to the COVID-19 pandemic), and are more likely to be able to afford a car.
Disabled people are a lot less likely to have a job as a full-time employee than those who are not disabled (17% compared to 46%). [shown in Figure 2 below]
Those whose condition affects day-to-day activities a lot are far less likely to be a full-time employee than those whose activities are affected a little (10% compared to 24%). [shown in Figure 2 below]
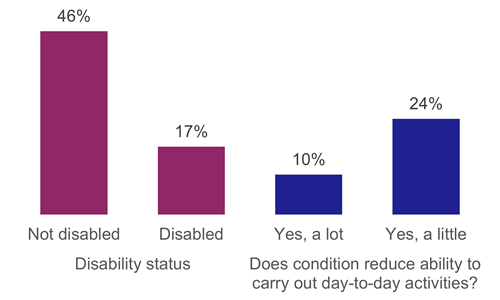
Figure 2: Percentage of people who are full-time employees, by whether they are disabled and how much their condition limits their ability to carry out day-to-day tasks, 2017-2021 (combined)
Full-time employment is lowest for people with a speech impairment (1%), difficulty seeing (4%), difficulty hearing (6%).
Disabled people are also more than twice as likely to be retired (42% compared to 20%).
Household income
The Transport and Travel in Scotland publication shows that people from higher income households are more likely to have a driving licence and to drive.
Average household incomes for disabled people tend to be lower than for those who are not (median £20,000 compared to £32,100, adjusted for 2021 prices). [shown in Figure 3 below]
Those whose condition affects their ability to carry out activities a lot have lower household incomes than those whose condition affects everyday activities a little (£18,700 compared to £22,200). [shown in Figure 3 below]
For all conditions, household incomes of disabled people are noticeably lower than for those who are not disabled. Average household incomes are lowest for people with epilepsy (£16,900).
The income data presented here is adjusted to 2021 prices using the Retail Price Index.
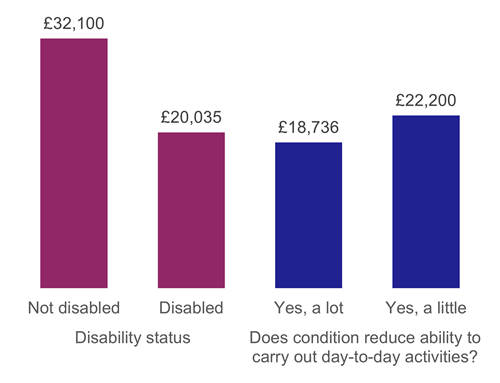
Figure 3: Median income, by whether adult has a disability and whether their condition limits the ability to carry out day-to-day tasks, 2017-2021 (combined)
Urban or rural location
Whether someone lives in an urban or rural location will affect factors such as availability of public transport. However, the proportion of disabled and non-disabled people living in urban areas was similar (83% and 82% respectively), so this is unlikely to be a significant factor in differences between people who are disabled or not.