Traffic and Economic Assessment
Introduction
The A75 Trunk Road between Drummore and Allanton roundabouts experiences Annual Average Daily Traffic (AADT) flows of approximately 9,000 vehicles a day based on the most recent full year of data available. Traffic volumes are highest east of the assessment corridor, with 10,700 vehicles recorded between Garroch and Drummore roundabouts in 2024. A gradual decrease is observed heading west with 9,300 vehicles a day (for 2023 as more recent data at this site was not available) in Crocketford and 9,000 vehicles a day south of Springholm. Further west outwith the assessment corridor, traffic volumes reduce further, with approximately 6,200 vehicles a day recorded in 2024 south of Allanton Roundabout.
The A75 Trunk Road is an important freight route within Scotland and both overall traffic levels and HGV traffic can increase significantly in relation to the ferry arrivals and departures to and from the ports at Cairnryan. Freight movement along the A75 is crucial to the local, regional and national economies and the transfer of goods between Northern Ireland, Scotland, and England. HGV traffic accounts for approximately 13% to 16% of the total traffic levels within the assessment corridor.
Safety on the A75 Trunk Road within the assessment corridor has been identified as an ongoing concern. Although the overall accident rate is slightly higher than the national average for equivalent non built-up roads, the proportion of serious accidents is lower than the national average. However, the rate of fatal accidents is slightly higher than the national average. There has been a relatively consistent level of personal injury accidents on the A75 over the last few years.
Due to the mix of vehicles using the route including HGVs, caravans, and agricultural vehicles, there is a relatively wide range of vehicle speeds. There are various locations along the A75 Trunk Road where slower-moving vehicles can cause delays, particularly on rural single carriageway sections where the national speed limit applies and limits HGVs to 40mph.
When incidents or planned maintenance occur on the A75, the recommended diversion routes are often via minor roads that pass through small villages and can result in significantly longer journey distances and increased travel times. The recommended diversion route for the assessment corridor, between Garroch Loaning (U225) and Haugh of Urr Road End (B794), adds approximately 9km of additional distance travelled compared to using the A75. Between 2018 and 2024, this section experienced 11 incidents resulting in either a lane or full road closure.
Baseline Traffic Conditions
Traffic Data
As previously explained in the Traffic and Safety Characteristics section of the Existing Conditions chapter of this report , AADT flows along the A75 have been determined using Automatic Traffic Counter (ATC) data obtained from Transport Scotland’s National Traffic Data System (NTDS), with the assessment corridor between Drummore and Allanton Roundabouts containing two permanent ATC sites. Three further ATC sites are situated outside the assessment corridor; one east of Drummore Roundabout, another east of Garroch Roundabout and the third south of Allanton Roundabout. These five sites each provide data with varying degrees of reliability.
The ATC located in Crocketford (JTC00375) recorded 64% data coverage for 2024, missing data for most of January and from September through to the end of December. As the months missing data include the typically lowest traffic volumes, it was determined that the AADT flow recorded for 2024 would not be representative of typical conditions. Consequently, 2023 data has been utilised as the next best year with sufficient coverage to provide a representative AADT. The 2023 AADT at the site in Crocketford was 9,300 vehicles. The most reliable data is reported from a counter situated approximately 2km south of Springholm (ATC115321), which achieved 100% coverage for 2024 and recorded an AADT of 9,000 vehicles.
The three additional ATCs are located outside the assessment corridor and beyond more major junctions that impact on traffic flows. The counter east of Drummore Roundabout (ATCSW022) reports an AADT of 10,700 vehicles for 2024. However, this counter has a low level of data reliability, with only 40% coverage for 2024, with complete data only available for September, October, and December. Due to the absence of alternative years with greater coverage, the average of September and October has been utilised, as both months are typically representative of the full year. Data has also been collated from a traffic counter east of Garroch Roundabout (ATC09036). This site reported an AADT of 16,000 vehicles for 2024. The other is located south of Allanton Roundabout on the Castle Douglas Bypass (ATC09015) and reported an AADT of 6,200 vehicles for 2024.
While these locations lie outside the assessment corridor, they provide context for understanding traffic flow variations along the wider A75 Trunk Road. Garroch Roundabout serves as a key access point for significant attractor sites, including Dumfries and Galloway Royal Infirmary, with increased traffic flows between this junction and Dumfries. Similarly, the Allanton Roundabout functions as an access point for the A745, one of the main routes into Castle Douglas to the east.
Figure 6‑1 illustrates the varying traffic levels along the length of the route, including the three traffic counters highlighted above that lie outwith the assessment corridor. The AADT traffic flows at various locations are also shown in Appendix A, Figure A6-1. The analysis presented in Figure 6‑1 considers both the 2024 counts, where available, as well as the previous seven years (2018-2024). Each column on the graph represents where counts are available for that specific year and location. Columns have been included for counters with incomplete records, such as the A75 Crocketford site, utilising all available data for that year. While these figures may not fully represent annual trends in AADT, they have been incorporated to provide additional context. Where no data is available for a year, no column is present in Figure 6‑1.
The general trend along the route indicates that traffic increased slightly between 2018 and 2024 in three of the four locations which recorded sufficient data in both years. The section east of the Garroch Roundabout consistently recorded the highest levels of traffic, with volumes generally decreasing heading west towards the Allanton Roundabout. A notable decrease in traffic was observed across all locations in 2020, likely due to the COVID-19 travel restrictions, followed by some evidence of traffic volumes recovering back to similar pre-COVID levels in the subsequent years. The section east of the Garroch Roundabout experienced a significant increase of almost 50% from 2020 to 2024, though overall traffic decreased from approximately 17,000 vehicles in 2018 to approximately 16,000 vehicles in 2024. Within the assessment corridor, flows at Crocketford increased from approximately 8,800 vehicles in 2018 to approximately 9,300 vehicles in 2023, an increase of 5.7%, with the traffic flow of 9,800 vehicles in 2024 an 11.4% rise over the 2018 flow, though the 2024 data is not based on a full year. Flows at the traffic counter south of Springholm decreased by 6.3% from approximately 9,600 vehicles in 2018 to approximately 9,000 vehicles in 2024.
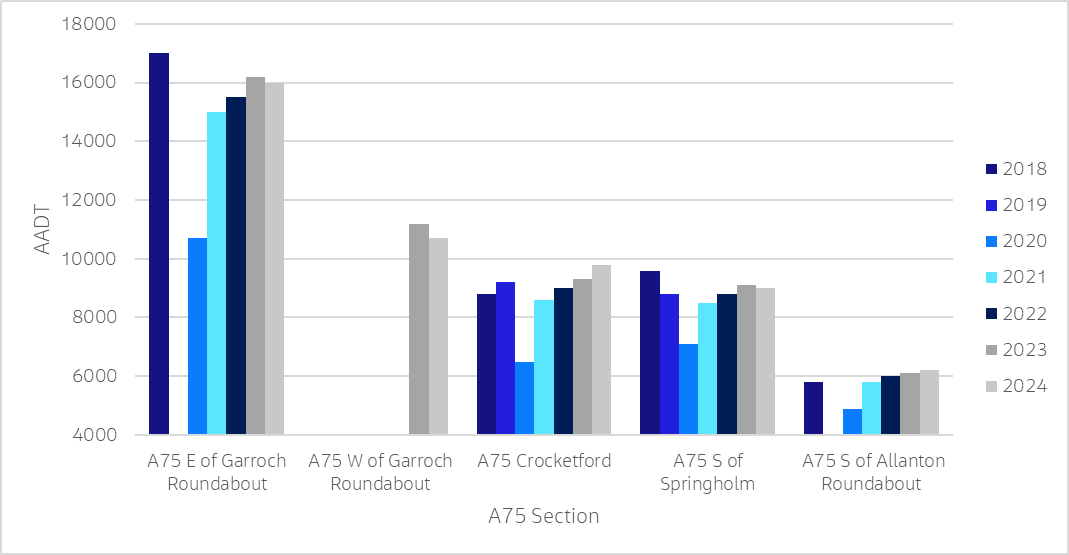
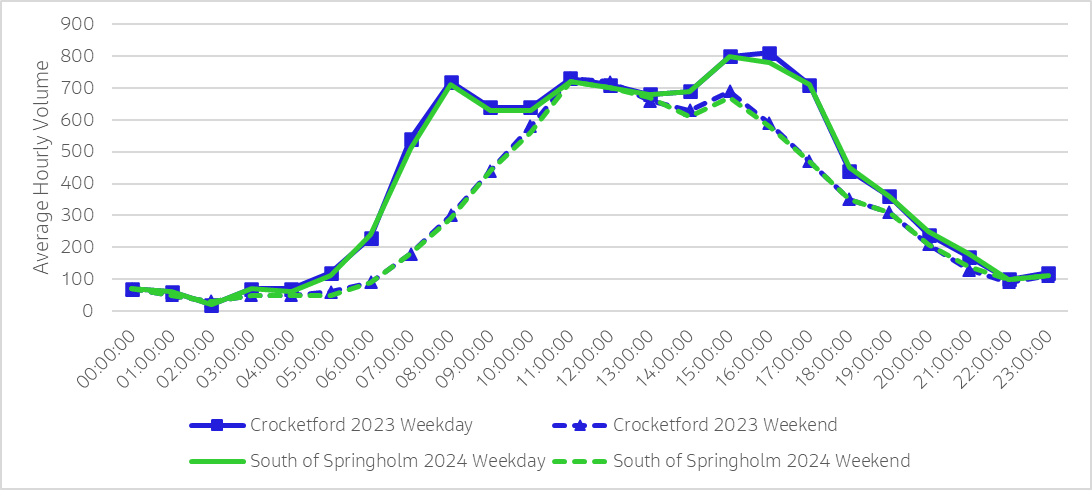
Figure 6‑2: Daily traffic variations
Traffic Composition and Characteristics
| Location | Eastbound | Westbound |
|---|---|---|
|
Daily Percentage HGV south of Springholm (2024) |
14% |
13% |
|
Daily Percentage HGV Crocketford (2019) |
16% |
16% |
|
Mean Speed (mph) south of Springholm (2024) |
53 |
52 |
|
Mean Speed (mph) Crocketford (2019) |
25 |
28 |
Seasonal Variation
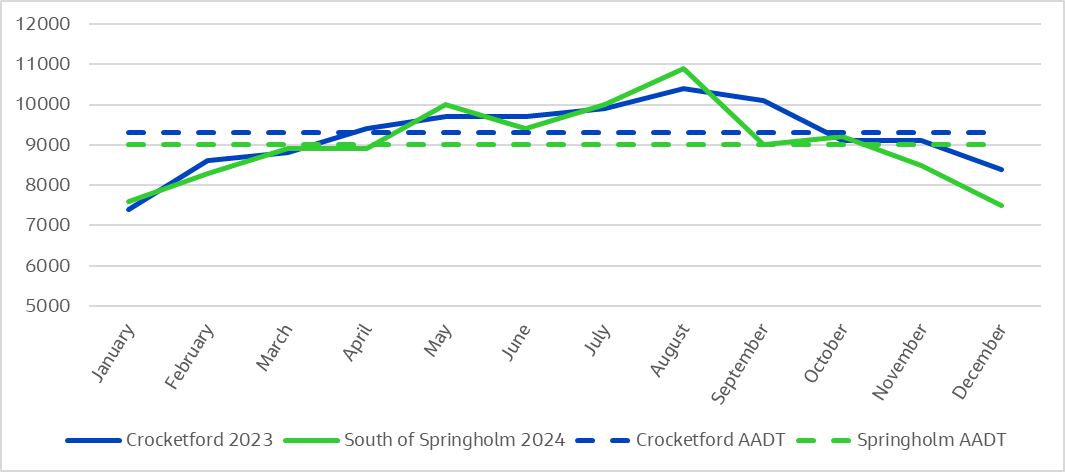
Figure 6‑3 illustrates the average daily traffic volume for each month recorded at the Crocketford and south of Springholm traffic counters, using the most recent year with complete data. The monthly traffic volumes show some seasonal variation in traffic patterns on the existing A75, with noticeably higher volumes evident during the summer months, peaking in August. Springholm experiences a peak of 10,900 vehicles in August, while Crocketford reaches 10,400 vehicles, representing increases of 21% and 12% over the AADT of 9,000 vehicles and 9,300 vehicles, respectively. These summer peaks likely reflect increased tourism and holiday travel in the region, including travel to and from Northern Ireland. Conversely, winter months, particularly December and January, show the lowest traffic volumes, with Springholm's January count of 7,600 vehicles and Crocketford's 7,400 vehicles significantly below the AADT.
Journey Times
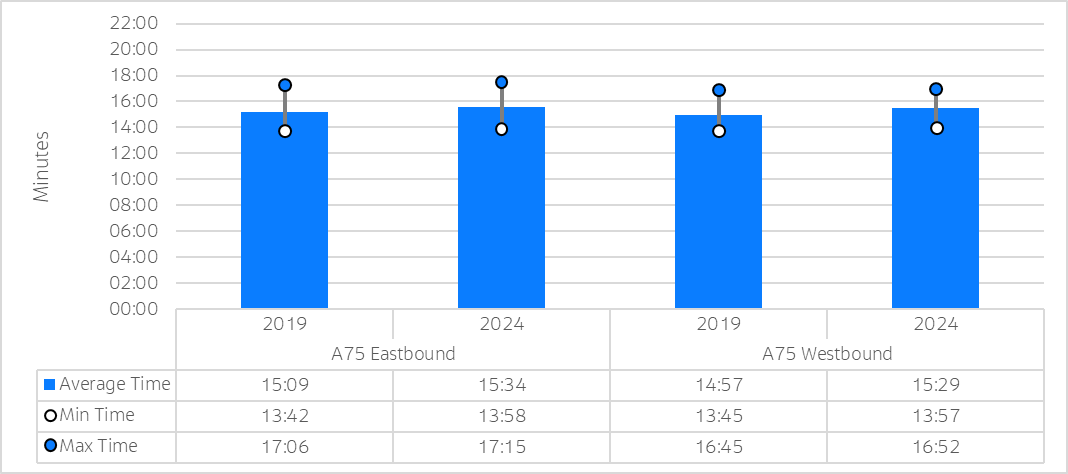
Journey times on the A75 Trunk Road have been evaluated for the assessment corridor between the Drummore and Allanton Roundabouts using data obtained through INRIX for 2019 and 2024. Figure 6‑4 shows the comparison of the daily average (weekday & weekend) eastbound and westbound journey times for 2019 and 2024, as well as the daily average minimum and maximum journey times.
Analysis of this data reveals marginal differences in journey times between 2019 and 2024 for both directions. Changes in average journey times are less than one minute, with a similar degree of variation in maximum and minimum journey times. These small differences suggest that journey times along this section of the A75 have remained relatively stable over the five-year period. The average journey time across the entire day is approximately 15 minutes and 30 seconds in the eastbound direction and 15 minutes in the westbound direction.
Given this similarity, the subsequent analysis focuses solely on the 2024 daily traffic profile, providing a representative view of current conditions. Figure 6‑5 shows the average journey time by time of day for both the eastbound and westbound directions, and presented for weekday and weekend periods.
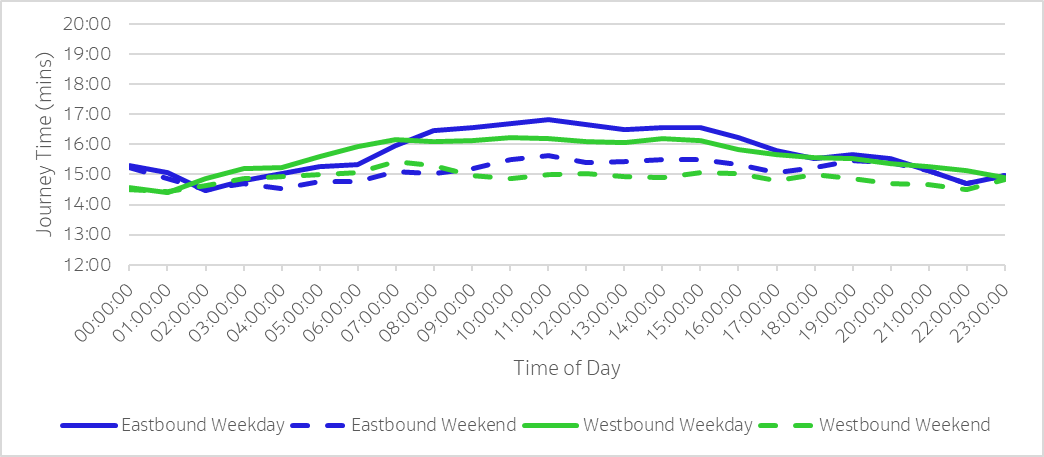
Journey times eastbound typically increase around 07:00 in the morning, correlating with the observed rise in AADT on the assessment corridor. The journey time increases until reaching a maximum peak around 11:00 before gradually decreasing as the day progress. Westbound weekday journey times exhibit a comparable pattern, albeit with an earlier onset of increased travel times, beginning at approximately 05:00, and then maintaining a relatively steady journey time throughout the day. In contrast, weekend journey times display a generally flatter profile in both directions with lower maximum journey times in both directions than the equivalent average weekday.
The average journey time across the weekday is approximately 15 minutes and 45 seconds eastbound and 15 minutes and 35 seconds westbound. This average decreases by between 50 seconds eastbound and 25 seconds westbound during weekends.
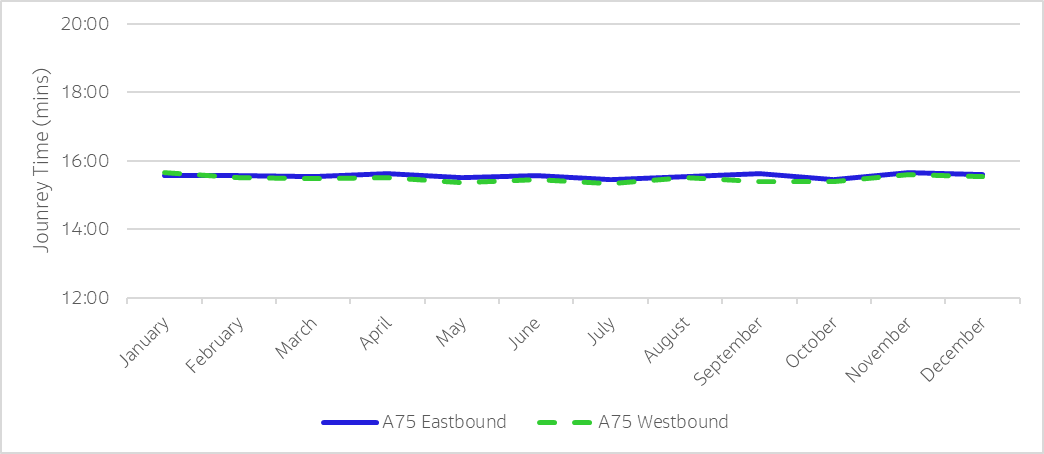
Further analysis of average daily journey times for 2024 on a monthly basis has been undertaken. Despite the observed increase in AADT during summer months, which typically suggests seasonal traffic fluctuations, there appears to be no significant adverse impact on journey times. As illustrated in Figure 6‑6, journey times remain relatively consistent at approximately 15 minutes and 30 seconds in both the eastbound and westbound direction throughout the year.
Accident Data
Transport Scotland has provided recorded personal injury accident data for the full A75 Trunk Road from Gretna to Stranraer covering the period from 2012 to 2024. Although accident data for a minimum five year period is typically used in accident analysis, the data was requested over this longer period to allow for analysis of the pre- and post-COVID pandemic accident trends. This approach was adopted due to the likely atypical travel behaviours experienced during periods in 2020 and 2021 when travel restrictions were in place in response to the pandemic, and data from 2020 and 2021 has been excluded as part of the analysis.
Table 6‑2 summarises the accident data for the A75 Trunk Road and presents the number of recorded accidents by severity for the period from 2014 to 2023. It includes the proportion of accidents by severity for the A75 Trunk Road and compares this to the national average severity proportions for all non built-up Trunk A roads in Scotland, derived from the most recent national statistics published in the Reported Road Casualties Scotland 2023 . Note that Reported Road Casualties Scotland 2023 only includes accident severities per road class for the period between 2014 and 2023. For reference, 'non built-up' roads have posted speed limits over 40mph.
The table also presents the accident numbers by severity for the entire period from 2014 to 2023 excluding 2020 and 2021, and the five year period from 2017 to 2023 excluding 2020 and 2021.
| Period | Fatal | Serious | Slight | Total | Fatal (%) | Serious (%) | Slight (%) |
|---|---|---|---|---|---|---|---|
|
A75 2014-2023 |
18 |
87 |
243 |
348 |
5% |
25% |
70% |
|
A75 2014-2023 (Excluding 2020-2021) |
15 |
69 |
216 |
300 |
5% |
23% |
72% |
|
A75 2017-2023 (Excluding 2020-2021) |
8 |
51 |
130 |
189 |
4% |
27% |
69% |
|
National (Non-Built Up Trunk A Roads) 2014-2023 |
380 |
2430 |
3667 |
6477 |
6% |
38% |
57% |
|
National (Non-Built Up Trunk A Roads) 2014-2023 (Excluding 2020-2021) |
327 |
2093 |
3236 |
5656 |
6% |
37% |
57% |
|
National (Non-Built Up Trunk A Roads) 2017-2023 (Excluding 2020-2021) |
190 |
1217 |
1623 |
3030 |
6% |
40% |
54% |
*Note that serious accidents include accidents that were classified as very serious, moderately serious and less serious from 2019 onwards.
Analysis of accident data for the A75 Trunk Road from 2014 to 2023 reveals that approximately 5%, 25%, and 70% of accidents were classified as fatal, serious, and slight, respectively. Excluding COVID-impacted years (2020 and 2021) for the same period, the data shows a small decrease in serious accidents and a corresponding increase in slight accidents, while the proportion of fatal accidents remains consistent.
Compared to the national severity rates for the same period, the A75 data indicates a similar proportion of fatal accidents. However, there is a lower proportion of serious accidents on the A75 compared to the national level for equivalent roads, with 13% fewer serious accidents for the A75 from 2014 to 2023 compared to the national non built-up Trunk A Road average for 2014 to 2023.
For the 2017 to 2023 period (excluding COVID impacted years of 2020 and 2021), the A75 shows a slightly higher proportion of serious accidents (27%) compared to the longer-term period from 2012 to 2024 (23%), although this is lower than the national level for the same period (40%).
Accident rates have also been calculated for the full A75 route between Gretna (to/from the A74(M) Slip Road) and Stranraer (to/from the A75/A77 Innermessan junction) subject to speed limits over 40mph, as well as separately for the two sections of A75 through Crocketford and Springholm which are subject to a 30mph posted speed limit. Both calculations have utilised the longer time period of 2012-2024 to allow for a more comprehensive examination of longer-term accident trends. These rates have been compared to the equivalent national rates for built-up and non built-up Trunk A Roads, where built-up roads have a speed limit of up to 40mph and non built-up roads have a speed limit of over 40mph. The national level built-up Trunk A Road rates have been compared to the sections of the A75 that are subject to a 30mph limit through Crocketford and Springholm, and non built-up Trunk A Road rates used for the full A75 route excluding the two villages.
Table 6‑3 and Table 6‑4 provides the accident rates for the full A75 route (excluding the two villages) and the 30mph sections through Crocketford and Springholm respectively, compared to the national average for equivalent trunk A roads. The accident rates are expressed as Personal Injury Accidents per Million Vehicle Kilometres (PIA/MvKM). This metric allows for a standardised comparison of accident rates across the A75 Trunk Road sections with the equivalent national averages, and takes account of the number of PIAs and the volume of traffic on each road segment, with rates also calculated for the pre- and post-COVID periods. The ratio of the local rate to the national rate is included in each table to identify where the local rate is higher than the national rate i.e. has a ratio greater than 1.0. Note that the national accident rate is only currently available to the end of 2023; however, this does not materially impact the comparison ratio shown.
|
Period |
A75 Accident Rate (PIA/MvKM) |
National Non Built-Up Trunk A Road Accident Rate (PIA/MvKM) |
Local/National Accident Rate Ratio |
|
2012-2024 |
0.085 |
0.080 |
1.1 |
|
2012-2024 (Excluding 2020-2021) |
0.088 |
0.085 |
1.0 |
|
2012-2019 (Pre-COVID) |
0.091 |
0.093 |
1.0 |
|
2018-2024 (Excluding 2020-2021) |
0.079 |
0.064 |
1.2 |
|
2022-2024 (Post-COVID) |
0.082 |
0.055 |
1.5 |
The ratio for the A75 route for the 2012 to 2024 period is 1.1 indicating that the accident rate calculated for the A75 is higher than the national rate for equivalent roads. In the pre-COVID period (2012-2019), the ratio was 1.0, indicating parity with the national rate. However, the period of 2022 to 2024, after the travel restrictions imposed during COVID-19 pandemic were lifted (post COVID-19) shows a marked increase, with the ratio rising to 1.5 albeit this is over a shorter three year time period. The most recent five year period (2018-2024, excluding 2020-2021) has a calculated a ratio of 1.2, again indicating that the local accident rate calculated for the A75 is higher than the equivalent national rate.
|
Period |
Crocketford Accident Rate (PIA/MvKM) |
Springholm Accident Rate (PIA/MvKM) |
National Built-Up Trunk A Road Accident Rate (PIA/MvKM) |
Crocketford/ National Accident Rate Ratio |
Springholm/ National Accident Rate Ratio |
|
2012-2024 |
0.096 |
0.086 |
0.134 |
0.7 |
0.6 |
|
2012-2024 (Excluding 2020-2021) |
0.111 |
0.099 |
0.147 |
0.8 |
0.7 |
|
2012-2019 (Pre-COVID) |
0.077 |
0.082 |
0.167 |
0.5 |
0.5 |
|
2018-2024 (Excluding 2020-2021) |
0.119 |
0.087 |
0.077 |
1.5 |
1.1 |
|
2022-2024 (Post-COVID) |
0.194 |
0.146 |
0.065 |
3.0 |
2.2 |
The long-term trend (2012-2024) shows that the local accident rate for the 30mph sections of the A75 in both villages has a ratio of less than 1.0 and thus the local accident rates are lower than the national average. The trend is similar when excluding the COVID-affected years where again with ratios less than 1.0 the local accident rates are lower than the equivalent national accident rates.
However, when considering the recent year time periods, the pattern changes and suggests the accident rate on the A75 in the villages is greater than the national rate for equivalent built-up trunk A roads. For the five year period from 2018 to 2024 (excluding 2020 and 2021), the calculated ratios for the 30mph sections of the A75 within both villages are higher than 1.0 indicating that the local accident rates on these sections of the A75 are higher than the national average accident rates. The shorter three year post-COVID period (2022-2024) shows the highest ratios indicating local rates on these sections of the A75 that are up to three times higher than the equivalent national rates.
The locations of the recorded accidents on the A75 within and in the immediate vicinity of the assessment corridor for the five year period from 2018 to 2024 (excluding 2020-2021) are shown in Appendix A, Figure A6-2.
Public Transportation and Ferry Provision
Bus Services
There are several bus services in operation in the settlements along the A75. The A75 between Stranraer and Dumfries is covered by the Stagecoach West Scotland 500 bus service, stopping at most of the towns and villages along the route including Springholm and Crocketford. To traverse the entire A75, passengers must connect to the service 79 bus at Dumfries to continue their journey to Gretna. In addition, Stagecoach operates services 75 and 416 providing connections between Newton Stewart and Stranraer, and services 79 and 179 connecting Dumfries to Gretna and Carlisle. It should be noted that in June 2025, Stagecoach announced that it would be ending most of its services in the Dumfries and Galloway region by the end of August 2025 including the 500 service which operates along the A75. At the time of writing, it is not known whether another operator will take over the routes.
Public transport services in the assessment corridor and surrounding regional area are provided by multiple operators. McCalls Coaches and Dumfries and Galloway Council offer services that serve both Springholm and Crocketford. Houston Coaches also operates in the region; however, their routes do not include stops in either Springholm or Crocketford. The 502 and 503 services operated by McCalls stops in both Springholm and Crocketford and provides connections between Dumfries and Castle Douglas. Dumfries and Galloway Council operate service number 555 which stops in both Springholm and Crocketford, running between Dumfries and Castle Douglas / Kirkcudbright. Bus services that operate on the A75 at some point within the assessment corridor and their frequencies are shown in Table 6‑5, based on information collated for bus operation in May 2025.
|
Service No. |
Route |
Operator |
Approx. Frequency |
|
500 |
Dumfries - Stranraer |
Stagecoach West Scotland |
6 per day (Mon-Fri) |
|
502 |
Dumfries - Castle Douglas |
McCalls Coaches |
5 per day (Mon-Sat) |
|
502 A |
Kirkcudbright - Castle Douglas |
McCalls Coaches |
12 per day (Mon-Sat) |
|
503 |
Dumfries - Springholm - Castle Douglas |
McCalls Coaches |
8 per day (Mon-Sat) |
|
555 |
Dumfries - Castle Douglas / Dumfries - Kirkcudbright |
Dumfries and Galloway Council Buses |
2 per day (Mon-Fri) |
These service routes are shown in Appendix A, Figure A6-3.
Cairnryan Port Ferry Services
Ferry services operate from the ports at Cairnryan, including Loch Ryan Port approximately 1.5 miles north of Cairnryan. Two commercial operators, P&O Ferries and Stena Line, provide services to Northern Ireland with distinct schedules as follows:
- P&O Ferries offers a route between Cairnryan Port and Larne, located about 20 miles north of Belfast. The crossing time is approximately two hours. During the week, there are six departures from Cairnryan, with a reduced schedule of five departures on Saturdays and four on Sundays. P&O Ferries initiates its service at 04:00 with the last ferry embarking at 23:59. Their schedule includes six departures from Cairnryan from Tuesday to Friday, five on Saturdays and Mondays, and four on Sundays.
- Stena Line operates between Loch Ryan Port and Belfast, with a crossing time of around 2 hours and 15 minutes. The Stena Line ferry service commences its daily operations with the first departure at 03:30, continuing throughout the day until the final crossing at 23:30. Their schedule includes six departures from Loch Ryan from Tuesday to Friday, five on Saturdays and Mondays, and four on Sundays.
On a typical weekday, there are a total of 12 arrivals and 12 departures each day to and from the ports at Cairnryan, providing a number of options for connections to Northern Ireland. Table 6‑6 demonstrates the departure and arrival times of ferry services to and from the ports at Cairnryan.
| Ferry Departure Time | Ferry Operator | Ferry Arrival Time | Ferry Operator |
|---|---|---|---|
|
03:30 |
Stena Line |
05:52 |
Stena Line |
|
04:00 |
P&O Ferries |
06:00 |
P&O Ferries |
|
07:30 |
Stena Line |
09:52 |
Stena Line |
|
08:00 |
P&O Ferries |
10:00 |
P&O Ferries |
|
11:30 |
Stena Line |
13:52 |
Stena Line |
|
12:00 |
P&O Ferries |
14:00 |
P&O Ferries |
|
15:30 |
Stena Line |
17:52 |
Stena Line |
|
16:00 |
P&O Ferries |
18:00 |
P&O Ferries |
|
19:30 |
Stena Line |
21:52 |
Stena Line |
|
20:00 |
P&O Ferries |
22:00 |
P&O Ferries |
|
23:30 |
Stena Line |
01:52 |
Stena Line |
|
23:59 |
P&O Ferries |
02:00 |
P&O Ferries |
Future Conditions
The analysis of data presented in the Baseline Traffic Conditions section of this chapter indicates a general trend of increasing traffic levels between the period from 2018 to 2024, particularly since 2021 following the atypical decrease in travel demand and traffic levels that occurred in 2020 due to the impact of COVID-19. At this stage it is anticipated that forecasts of future travel demand will be derived from the national-level Transport Model for Scotland (TMfS) and will reflect the current ‘With Policy’ and ‘Without Policy’ scenarios that have been developed to inform the TMfS future year demand forecasts. The ’With Policy’ scenario captures policy ambitions leading to lower levels of motorised traffic demand, and currently this still reflects the previous target to reduce car vehicle-kilometres travelled by 20% (of 2019 levels) by 2030, whereas the ’Without Policy’ scenario has no policy ambitions and reflects higher levels of motorised traffic demand.
The opening year has been assumed to be 2035 for the purpose of the DMRB Stage 1 Assessment, and the design year is therefore assumed to be 2050 (opening year plus 15 years). TMfS includes forecast models through to a 2045 forecast year and thus a process of extrapolation will need to be developed to determine demand forecasts that represent the 2050 forecast year.
For the purpose of this DMRB Stage 1 Assessment, an estimate of the likely changes in forecast traffic levels within the assessment corridor has been obtained from the TMfS for the ‘With Policy’ and ‘Without Policy’ scenarios on the A75 at selected locations east and west of Crocketford for the selected future years of 2030, 2035 and 2045. In the ‘With Policy’ scenario, traffic levels are anticipated to reduce in the future, with an approximate traffic reduction of up to 21% in 2045 compared to the 2018 base year for the AM peak period, and an approximate reduction of 17% for the PM peak period. Traffic reductions in the Interpeak period between the AM and PM peak periods shows a lesser reduction of approximately 10% in 2045 compared to the 2018 base year.
The forecast demand in the ‘Without Policy’ scenario appears to indicate a slight reduction in traffic flow in the AM and PM peak periods in 2030 compared to the 2018 base year, but growth in traffic by 2045. The increase in traffic from TMfS in 2045 is approximately 6% in the AM peak period and 9% in the PM peak period compared to the 2018 base year. The Interpeak period is estimated to have higher growth than the two peak periods, with traffic levels in 2045 approximately 13% higher than the 2018 base year.
At the next stage of scheme assessment consideration will be given to additional sensitivity testing to reflect any potential new car vehicle kilometre reduction targets that may be set at a national level. This will inform the DMRB Stage 2 scheme assessment and the potential impacts on the route options that will be developed.
New and planned development in and around the area is also likely to have an impact on movements on the A75 Trunk Road. The Dumfries and Galloway Local Development Plan 2 (LDP2) , as the latest available published plan, and the land-use developments it contains were collated to inform the national models including the TMfS, with the demand changes reflected through the ‘With Policy’ and ‘Without Policy’ scenarios noted above.
The LDP2 positions Dumfries as the Regional Capital, outlining strategic investments to reinforce this status. The plan sets an ambitious housing supply target for Dumfries of 2,798 units by 2029, comprising 2,134 market housing units and 664 affordable housing units. Concurrently, Stranraer is allocated a housing supply target of 509 units within the same timeframe. As a region, the LDP2 anticipates a total housing supply of 5,282 to be provided by 2029.
Effect of Improvement Strategies
This section outlines the anticipated impacts in broad terms of the six improvement strategies. At this stage in the scheme assessment process, the assessment of likely effects of the improvement strategies has been undertaken on a qualitative basis. A more detailed assessment process will be undertaken during the DMRB Stage 2 Scheme Assessment with quantitative outputs being provided by the traffic models to evaluate the operational and economic performance of the proposed route options.
Effects on Safety
It is anticipated that all six improvement strategies will have a positive contribution in terms of overall safety. All route options within the improvement strategies taken forward to DMRB Stage 2 will be designed in accordance with latest standards and therefore are anticipated to provide a safer route.
At this stage, all offline improvement strategies (Improvement Strategies 1, 2, 4, 5 and 6) are expected to have the potential to reduce local accident rates, including for Killed or Seriously Injured accidents. This aligns well with the scheme objective of reducing local accident rates and severity through reducing KSIs by 65% in line with Road Safety Framework targets, and contributing to improving safety on the A75 trunk road.
Improvement Strategy 3, which would be an online improvement, is not considered likely to significantly reduce the number or severity of accidents and would therefore have a more limited contribution to improving safety than the other improvement strategies.
While some of the improvement strategies may result in slightly longer travel distances than using the existing A75 Trunk Road, they are likely offer substantial benefits in terms of traffic reductions within Springholm and Crocketford. The removal of strategic through traffic from the existing A75 within and between the villages Springholm and Crocketford is anticipated to reduce potential conflicts between local and strategic traffic, as well as reducing conflicts with active travel users including walking, wheeling, cycling and horse riding.
Changes in Traffic Patterns
All offline improvement strategies are anticipated to result in a traffic reduction in the two villages. Improvement Strategy 3 is online and is anticipated to result in no significant change in traffic volumes passing through the villages.
In considering the offline improvement strategies, whilst Improvement Strategies 1 and 2 would result in a traffic reduction in the two villages they are anticipated to have the lowest levels of reduction of the offline strategies due to their increased length over the existing A75. Improvement Strategies 1 and 2 are also likely to require a higher number of intermediate junctions to connect to the existing local road network compared to the other offline improvement strategies, and as they are less direct may not necessarily provide an attractive alternative to the existing A75.
Improvement Strategies 4 and 5 are likely to have higher levels of traffic reductions in the two villages compared to Improvement Strategies 1 and 2. Both these improvement strategies are likely to be shorter in length than the existing A75 route and are likely to have a lower number of junctions connecting to the local road network, although junction connections in Improvement Strategy 5 may be more complex than those for Improvement Strategy 4.
Improvement Strategy 6 is anticipated to have the highest level of traffic reduction in Springholm and Crocketford as it would be shorter in length than the existing A75 and is a more direct alternative for longer distance traffic. It would likely have a lower number of connecting junctions than Improvement Strategies 1 and 2, and although it would also require connections with the existing Allanton and Drummore roundabouts it would provide a more consistent 60mph speed limit over a longer distance than any of the other improvement strategies.
Changes to Journey Time Variability
All six improvement strategies are expected to reduce journey time variability to some degree. Although it is recognised that the extent of these benefits may vary depending on additional factors such as the cross section, the length of the improvement strategy, the potential number of at-grade junctions and design speed that will be considered in more detail for the route options to be developed as part of the DMRB Stage 2 Scheme Assessment.
Improvement Strategies 1 and 2 would have potential journey time variability benefits. However, the potential benefits are likely to be partially offset by the increased length of these two improvement strategies compared to the existing A75 and the need for a higher number of junctions, potentially at-grade, to connect to the local road network.
Improvement Strategy 3, as the online strategy, is expected to provide the least journey time variability benefits as it is likely to be subject to the same speed limits as the existing A75 including the 30mph sections passing through the two villages.
Improvement Strategies 4, 5, and 6 all have the potential to provide greater journey time variability benefits than Improvement Strategies 1 and 2. Of these Improvement Strategy 6 is considered likely to perform best at this stage due to the longer length of the improvement strategy allowing for more consistent speeds, as well as it providing a shorter distance travelled between the potential tie-in locations compared to the existing A75. Although the number of potential intermediate junctions for Improvement Strategy 6 would likely be higher than Improvement Strategies 4 and 5, at this stage the impacts associated with the increased junction interactions are not anticipated to be as significant as those from Improvement Strategies 1 or 2.
Changes to Resilience
The offline improvement strategies, specifically 1, 2, 4, 5 and 6 are anticipated to increase the overall resilience of the road network in response to incidents occurring on either the existing A75 or the proposed scheme. These would provide alternative diversion routes in response to incidents, thereby improving traffic management responses during both planned events and unforeseen incidents. The offline improvement strategies would also be expected to provide additional benefits in terms of incident response and recovery times over any online improvement strategies.
In contrast, Improvement Strategy 3, which is online, is anticipated to offer limited additional resilience in response to incidents on either the existing A75 or the potential improvement strategy route. The proximity of any new route to the existing A75 limits its effectiveness as an alternative route during incidents, potentially constraining the road network's capacity and the efficient management of disruptions.
Economics
The majority of the improvement strategies would be anticipated to result in various economic benefits including journey time benefits and reductions in journey time variability. The exception would be Improvement Strategy 3, which is likely to maintain the current speed limits including the 30mph limits within Springholm and Crocketford.
The improvement strategies are likely to offer enhanced resilience benefits that have the potential to enhance operational efficiency, minimise disruption, and improve overall infrastructure management, leading to a more streamlined and cost-effective maintenance process. This increased resilience is likely to contribute to a more reliable and efficient road network, leading to benefits for both local traffic and longer distance traffic including traffic travelling to and from the ports at Cairnryan.
A key benefit of the offline improvement strategies is the reduction in traffic within the villages of Springholm and Crocketford through the removal of longer distance traffic travelling on the A75 Trunk Road. The significant reduction in traffic volumes is expected have placemaking and accessibility benefits in the villages, potentially encouraging increased use of active travel modes such as walking, wheeling and cycling, and promoting local land use opportunities.
More detailed quantitative analyses and assessments will be undertaken as part of the DMRB Stage 2 Scheme Assessment including the use of traffic models and the evaluation of economic benefits. This will assist in identifying the preferred route option and will inform the Outline Business Case to be prepared for the preferred route option.
The economic appraisal of route options at the DMRB Stage 2 scheme assessment stage will be conducted using the Department for Transport's (DfT) TUBA program. This assessment will be integrated into the DMRB Stage 2 process and Outline Business Case preparation, aiming to generate a comprehensive economic analysis. The appraisal will report on the standard Transport Economic Efficiency results including the Present Value of Benefits (PVB) and Present Value of Costs (PVC), which will be used to calculate the overall Benefit to Cost Ratios (BCR) for the route options at DMRB Stage 2. In addition, consideration will be given to establishing Wider Economic Impacts (WEIs) as the scheme progresses.