Casualty matrix
For each type of injured road user (X axis), the figures below illustrate which other road users were involved in the collision that caused their injury (Y axis), including no other vehicles - which means for example a motorcyclist becoming a fatality when no other vehicle was involved. ‘Involvement’ in the collision does not strictly mean that a given road user directly caused the injuries. Pedestrians are not listed in the Y axis. The sizes of the circles - either blue or black - are proportionate to the number of total fatalities (Figure 8) or total casualties (Figure 9) by type of road user within each of the Figures but are not comparable between them.
Although there have been clear reductions in the number of total fatalities and casualties (blue circles smaller in size than the black circles), the general patterns of road user involvement have remained broadly similar between the 2004-2008 and 2016-2020 periods. Car/taxi road users killed/casualties involved in a collision with another car/taxi are still the prominent group along with pedestrian killed/casualties involved in a collision with another car/taxi. Two noticeable stagnating numbers are in relation to pedal cycle casualties involved in a collision with another car/taxi with 553 in 2016-2020 compared to 634 in 2004-2008 and in relation to motorcyclists killed with no other vehicle involved with 7 in 2016-2020 compared to 9 in 2004-2008. Another point to note is that the rate of reduction in car/taxi users killed with no other vehicle between the two periods has been less pronounced than the rate of reduction in car/taxi users casualties with no other vehicle, which tend to prove that crashes involving car/taxi users with no other vehicle are more serious in nature.
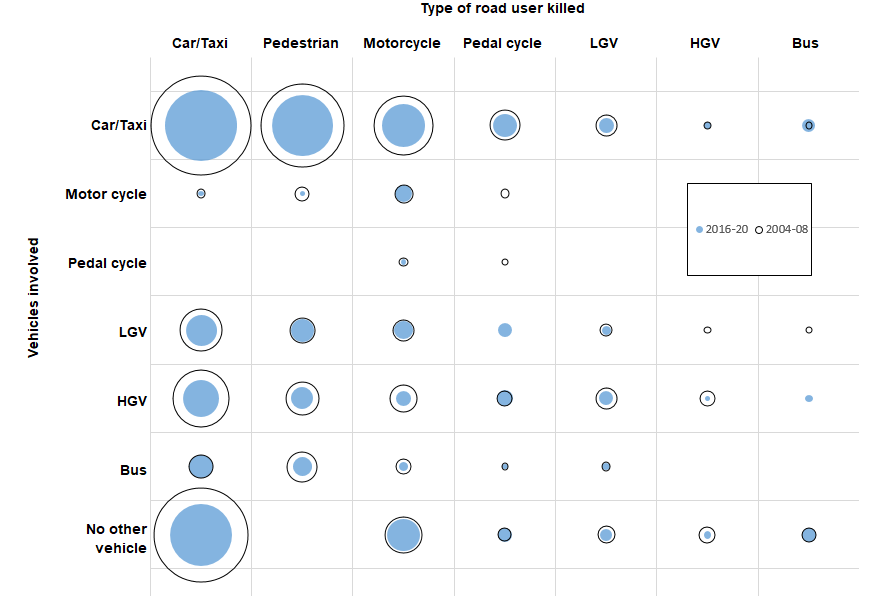
Figure 8: Type of vehicles involved in fatal road injuries (annual average) including no other vehicle
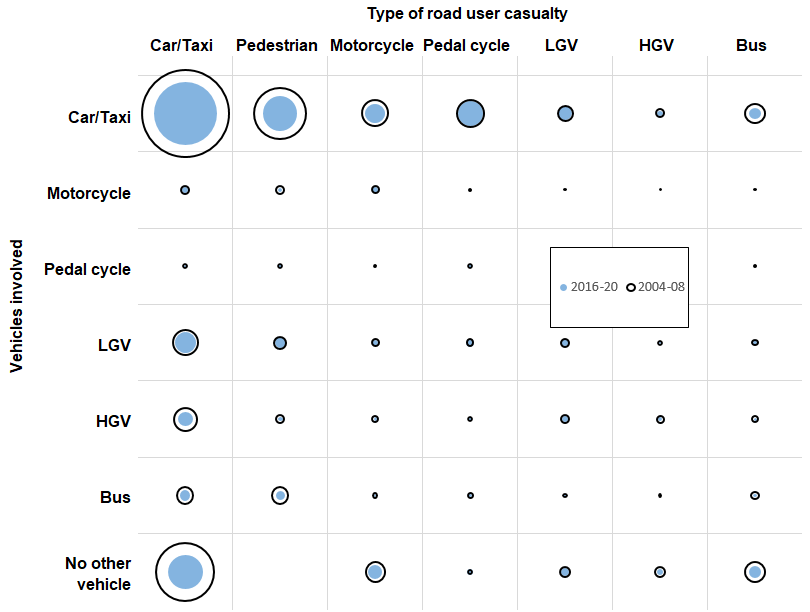
Figure 9: Type of vehicles involved in all road casualties (annual average), including no other vehicle