Delivery of casualty reduction targets for 2020
The Framework included Scotland-specific targets (with 2015 milestones) due for delivery in 2020. These targets and milestones are included in Table 1. Each reduction target is assessed against a 2004/08 average baseline. In addition to the above four targets a pre-existing target (a ten per cent reduction in the slight casualty rate) continued to be adopted. Progress is assessed towards a milestone in 2015 and the final target by means of an indicative trend based on a constant annual percentage reduction.
| Target | 2015 milestone % reduction | 2020 target % reduction |
| People killed | 30% | 40% |
| People seriously injured | 43% | 55% |
| Children (aged < 16) killed * | 35% | 50% |
| Children (aged < 16) seriously injured | 50% | 65% |
Table 1: Casualty reduction targets in Scotland's 2009 Road Safety Framework
As outlined above, due to changes in the reporting system used by Police Scotland, the number of serious and slight casualties cannot be directly compared to previously recorded figures. As a result, progress against the serious casualty reduction targets are based on adjusted figures, produced by the Department for Transport. The adjusted figures show how many serious casualties there would have been in previous years if they had been recorded using the same sort of reporting system that Police Scotland use currently.
Table 2 below provides final progress against the five national casualty reduction targets for 2020 and shows that the reduction achieved exceeded all five targets. Note that all the casualty reduction milestones for 2015 were met, bar the one on people seriously injured.
| 2004/08 baseline | 2020 target | 2020 actual figures | Final status |
| 292 | 175 = 40% reduction in people killed | 141 = 52% reduction | exceeded target |
| 4,865 | 2,191 = 55% reduction in people seriously injured | 1,547 = 68% reduction | exceeded target |
| 15 | 8 = 50% reduction in children killed | 6 in 2020 but average for the 2018- 2020 period was 4 a year= 76% reduction | exceeded target |
| 626 | 219= 65% reduction in children seriously injured | 144 = 77% reduction | exceeded target |
| 27.01 casualties per 100 million vehicle kilometres | 24.3 = 10% reduction in the slight casualty rate | 8.85 = 67% reduction | exceeded target |
Table 2: Progress against five national casualty reduction targets for 2020 since 2004/08 baseline
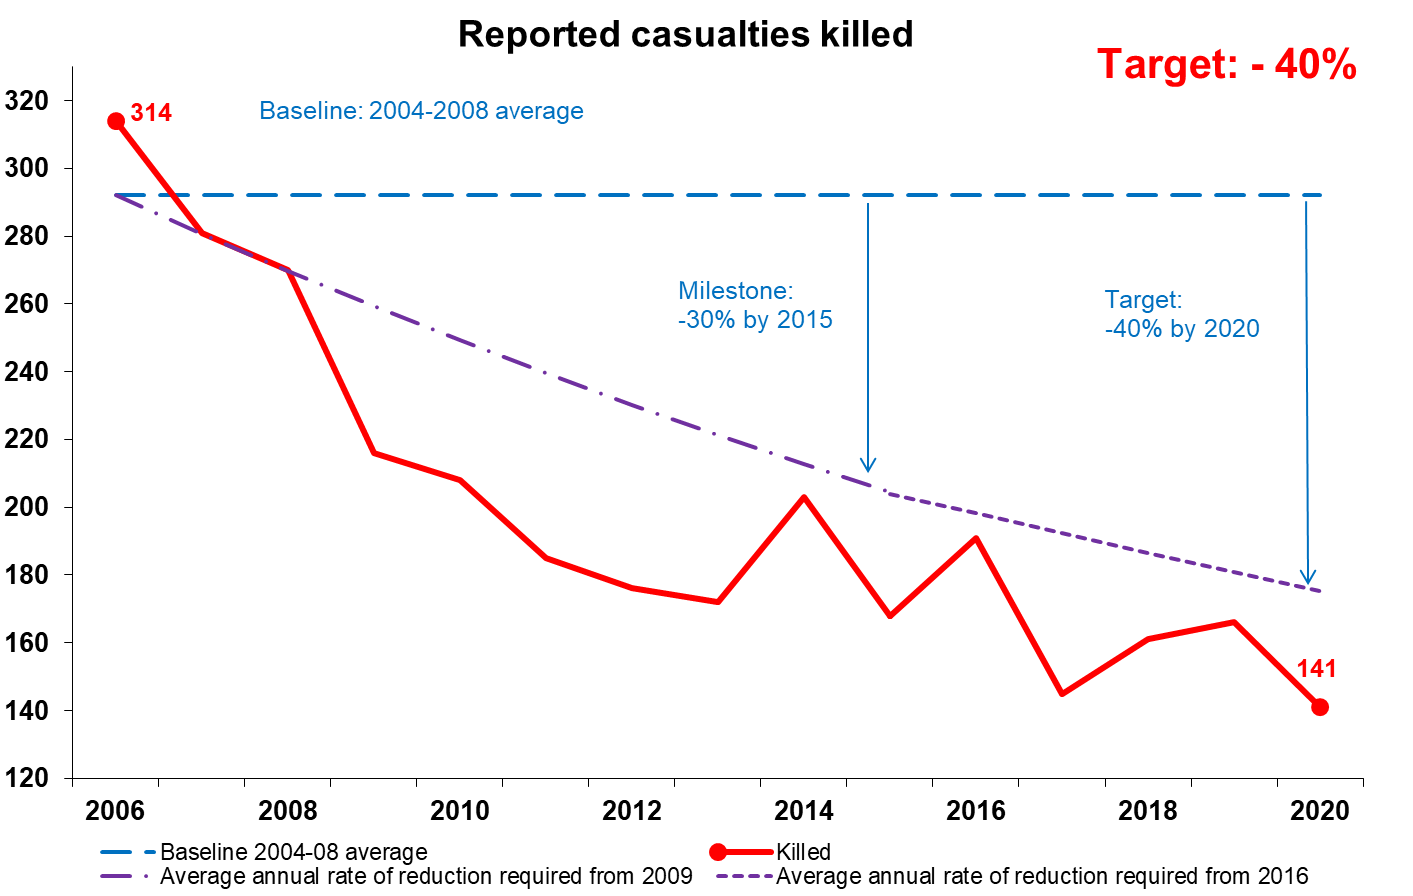
Target: 40% reduction in those killed by 2020
141 people were reported as killed in 2020, 52 per cent (151) below the 2004- 2008 average of 292. The decrease seen to 2020 has exceeded the framework target for 2020 (a reduction of 40% from 2004-08). Figure 3 shows that the total number of fatalities in 2020 was below the indicative line in purple representing a constant annual percentage decrease that would result in meeting the 2020 targets and has been for the past few years.
Target: 55% reduction in those seriously injured by 2020
Due to changes in severity reporting, progress against this target is measured on the basis of adjusted figures provided by the Department for Transport. These figures illustrate how many casualties there would have been in previous years if they had been recorded using an injury-based recording system. On the basis of the adjusted figures, 1,547 people were reported as seriously injured in 2020, 68 per cent (3,318) below the 2004-2008 average of 4,865. Figure 4 shows that the reduction has exceeded the framework target for 2020 (a reduction of 55% from 2004-08). Prior to the casualty reductions in 2020, Scotland had seen significant reductions but was not on track to meet this target. The reduction achieved in 2020 compared to previous years should be seen in the wider context of lower level of road traffic in Scotland in 2020 due to the Covid-19 pandemic.
The below chart show an “indicative line” in purple representing a constant annual percentage decrease that would result in meeting the 2020 targets.
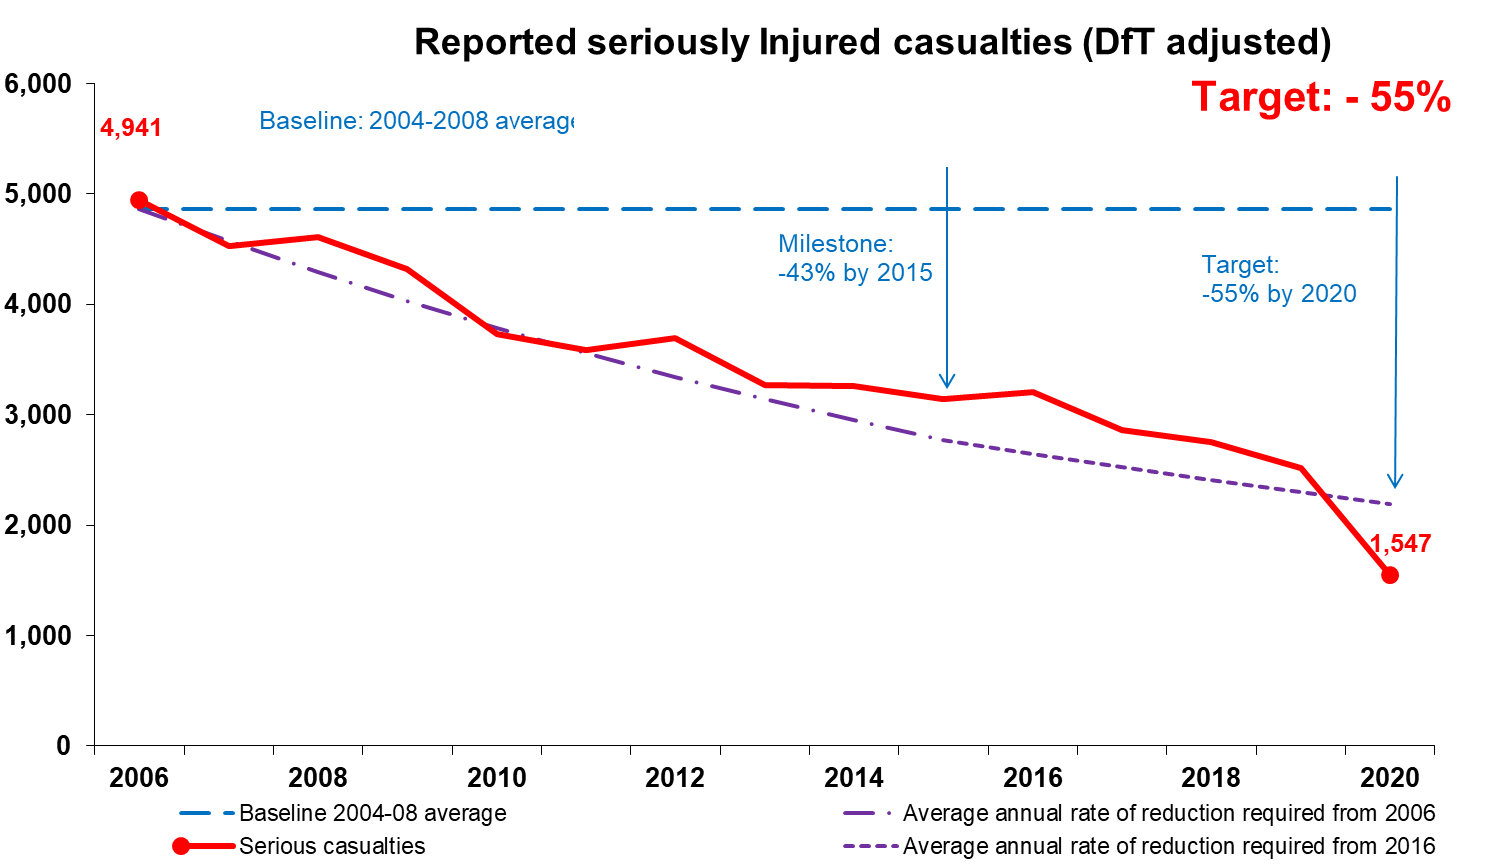
Figure 4: Progress towards casualties seriously injured reduction target
Target: 50% reduction in children killed by 2020
Due to small numbers and year-to-year fluctuations this target is measured using a three-year average. 6 children were reported as killed in 2020, meaning the average for the 2018- 2020 period was 4 a year, this is 76 per cent (11) below the 2004-2008 average of 15. Figure 5 shows that the reduction has exceeded the 2020 target.
The below chart show an “indicative line” in purple representing a constant annual percentage decrease that would result in meeting the 2020 targets.
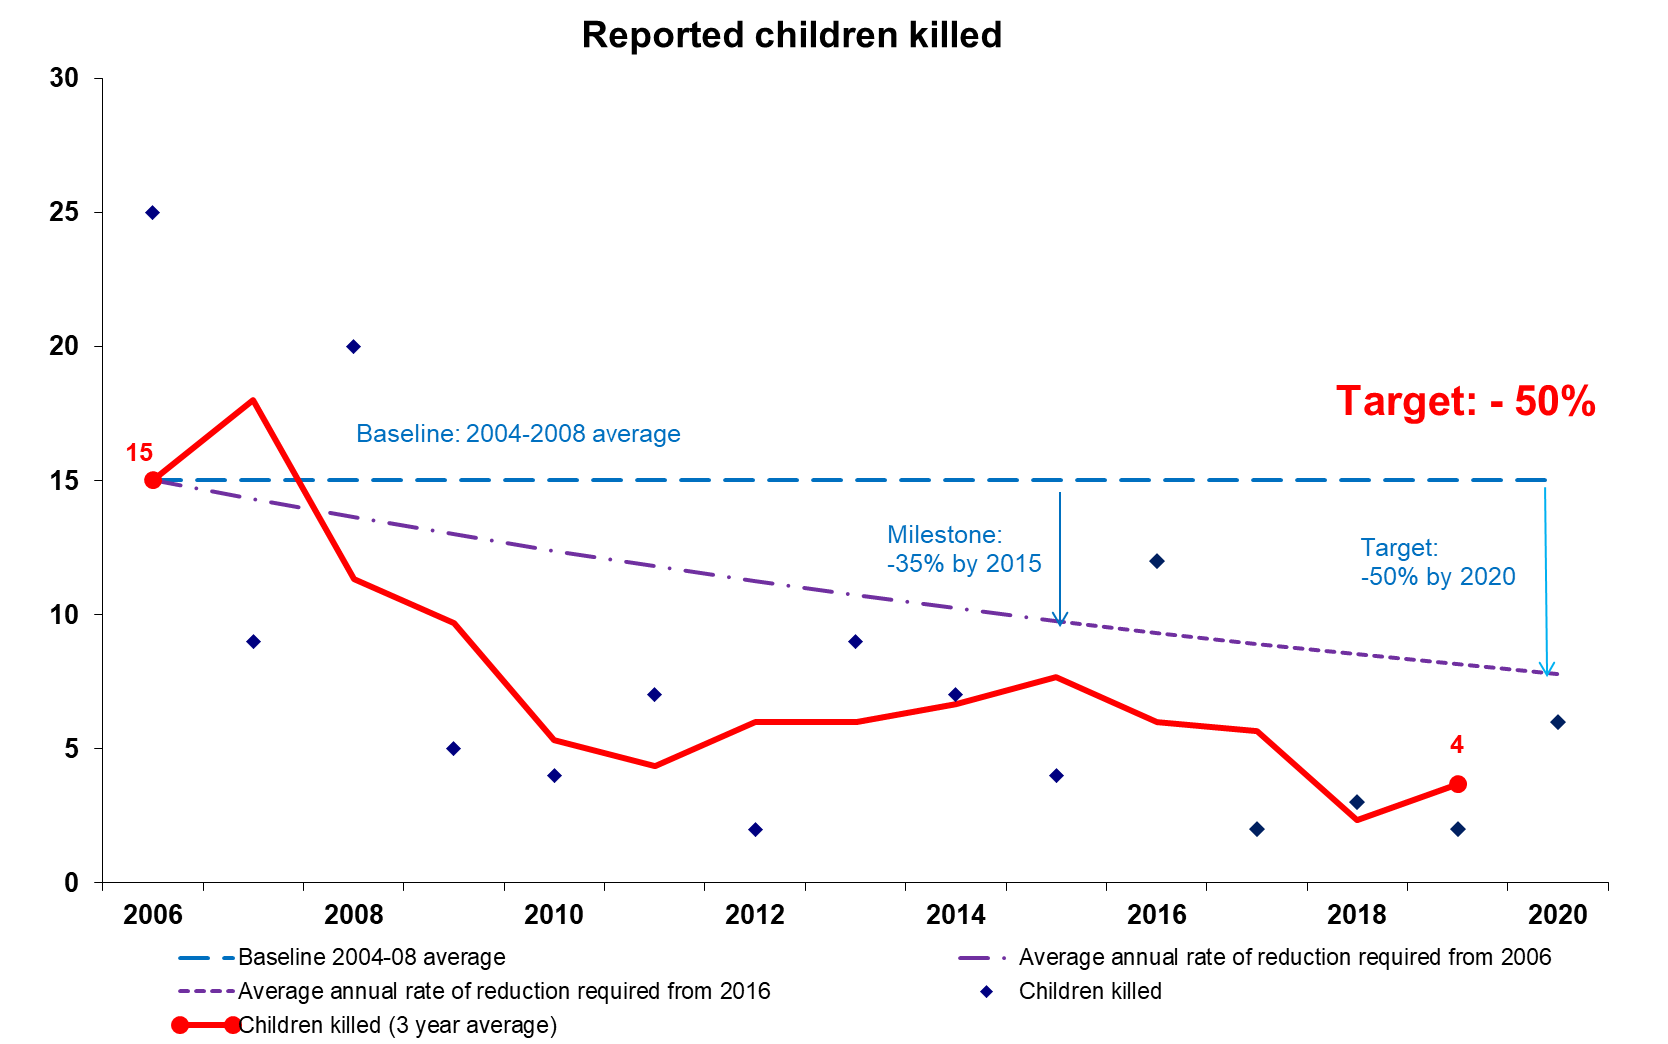
Figure 5: Progress towards children killed reduction target
Target: 65% reduction in children seriously injured by 2020
Due to changes in severity reporting, progress against this target is measured on the basis of adjusted figures provided by the Department for Transport. These figures illustrate how many casualties there would have been in previous years if they had been recorded using an injury-based recording system. On the basis of the adjusted figures, 144 children were reported as seriously injured in 2020, 77 per cent (482) below the 2004-2008 average of 626. Figure 6 shows that the decrease has exceeded the framework target for 2020 (a reduction of 65% from 2004-08). Prior to the casualty reductions in 2020, Scotland had seen significant reductions but was not on track to meet the target. The reduction achieved in 2020 compared to previous years should be seen in the wider context of lower level of road traffic in Scotland in 2020 due to the Covid-19 pandemic.
The below chart show an “indicative line” in purple representing a constant annual percentage decrease that would result in meeting the 2020 targets.
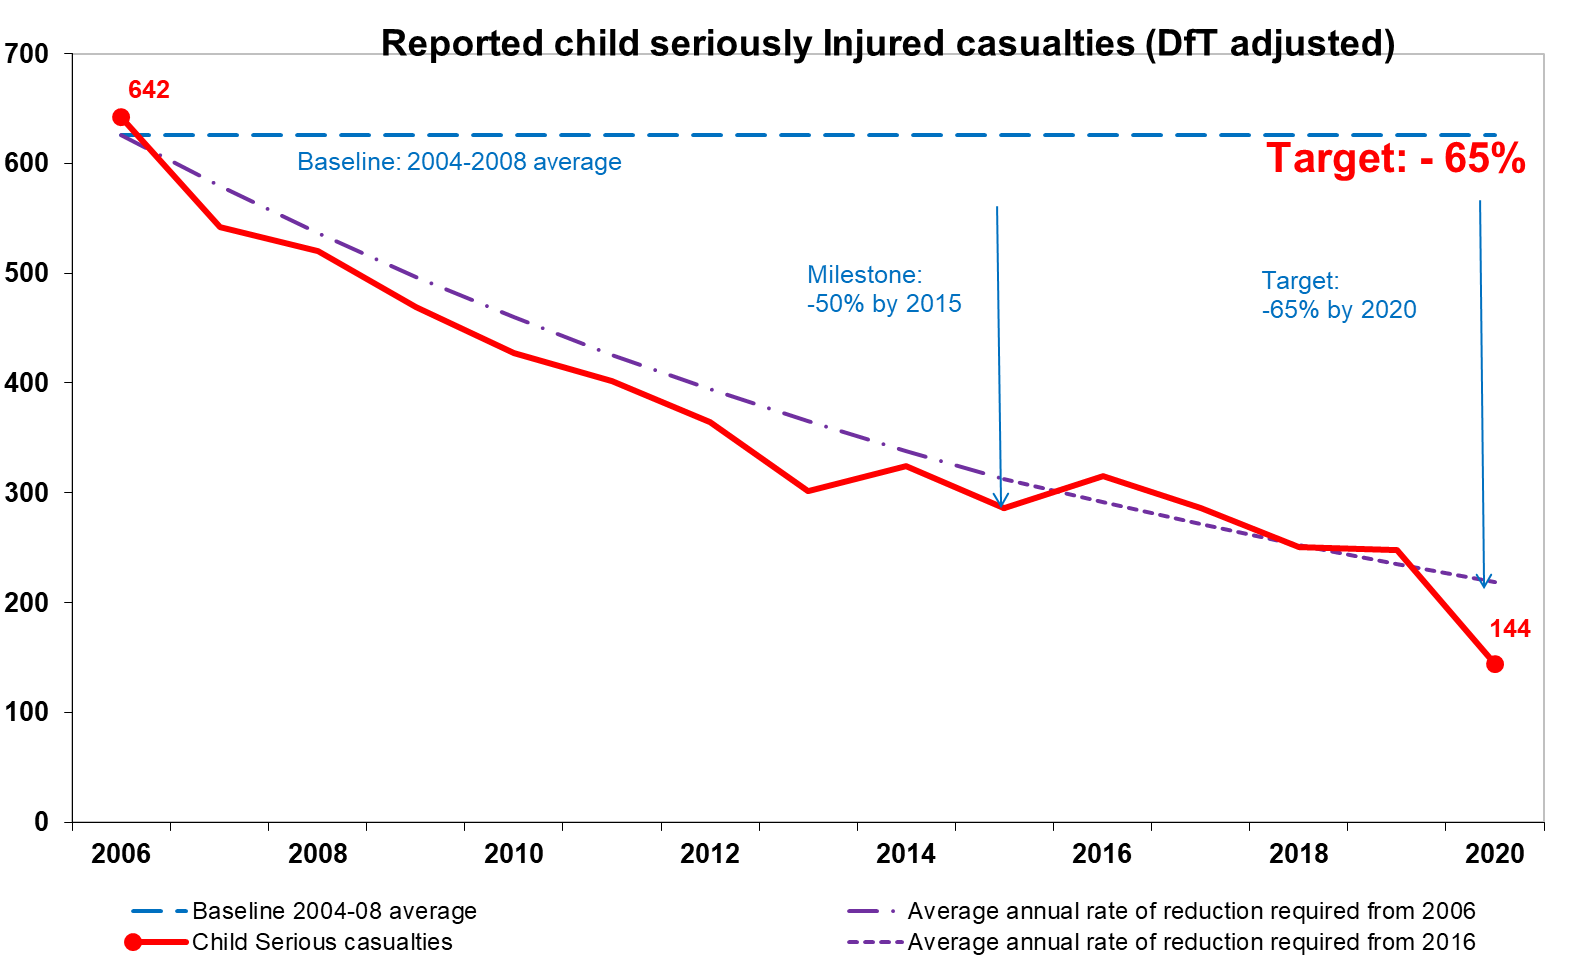
Figure 6: Progress towards children seriously injured reduction target
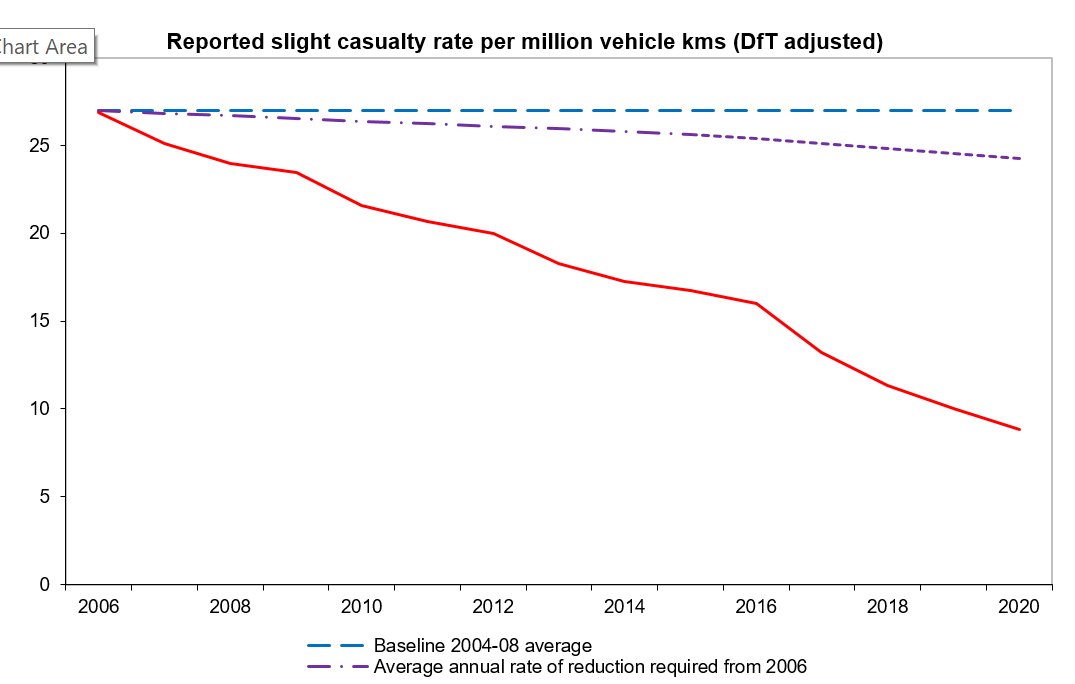
Target: 10% reduction in the slightly injured rate by 2020
Due to changes in severity reporting, progress against this target is measured on the basis of adjusted figures provided by the Department for Transport. These figures illustrate how many casualties there would have been in previous years if they had been recorded using an injury-based recording system. On the basis of the adjusted figures, the slight casualty rate of 8.85 casualties per 100 million vehicle kilometres in 2020 was 67 per cent below the 2004-2008 baseline average of 27.01. Figure 7 shows that the decrease has exceeded the framework target for 2020 (a reduction of 10% from 2004-08).
Priority Focus Areas outcomes and indicators
As previously mentioned the mid-term review of the Framework further enhanced its performance management system to reconcile the fact that different reductions had been seen amongst different road user types and therefore set overarching outcomes and indicators specific to three Priority Focus Areas. For example in relation to the Speed Priority Focus Area, one of the outcomes was to “increase the proportion of vehicles travelling at appropriate speeds on Scotland’s roads to support reducing road casualty numbers”. One of the indicators was the “positive behavioural or attitudinal trends in drivers including driving at appropriate speeds and awareness and understanding of speed limits and what they mean”.
The progress towards the delivery of these outcomes and the monitoring of their respective indicators were reported in the Outcomes Indicator Toolkit (OIT) which used a Red/Amber/Green (RAG) rating to illustrate the relative position of progress towards delivery and provided graphical summary sheet of the relevant indicators. The OIT was updated before each of the OPG and SPB meetings and reviewed at these meetings. The last OIT produced can be found in Annex A.
Table 3 provides RAG status for each of the Framework’s outcomes and indicates that they are all improving but none of them achieved a Green RAG status meaning more works need to be done in the future. In addition no assessment of the RAG status could be done in relation to the Pre-drivers outcome because the findings from the evaluation of Pre-driver interventions were that “there is currently no robust evidence suggesting that pre-driver interventions are being effective at improving road safety”. Even over a long period of time being a “safe driver” could not be solely contributed to a pre driver intervention.
Speed and Motorcyclists
Overarching outcomes
Increase the proportion of vehicles travelling at appropriate speeds on Scotland’s roads to support reducing road casualty numbers.
Red, amber green (RAG) status - Amber/Green (Ongoing/complete)
Direction of status - improving
Improve the safety of motorcycling by reducing levels of motorcycle injury accidents on the road network to support reducing road casualty numbers.
RAG status - Red/Amber (Incomplete/ongoing)
Direction of status - Improving
Pre-Drivers, Drivers ages 17 to 25 and Older Drivers
Overarching outcomes
Improve knowledge, positive attitudes and safer behaviours of individuals in relation to road safety before they start driving.
RAG status - No assessment
Direction of status - Improving
Increase safer driving behaviours by young drivers after they pass their test.
RAG status - Amber/Green (Ongoing/complete)
Direction of status - Improving
Increase awareness and knowledge capability of older drivers, and their families, to make informed choices about safe driving.
RAG status - Red/Amber (Incomplete/ongoing)
Direction of status - Improving
Cyclists and Pedestrians
Reduce the number of cyclist casualties through good design, appropriate speed management, high awareness of and compliance with, road traffic laws and safe practices by all road users
RAG status - Red/Amber (Incomplete/ongoing)
Direction of status - Improving
Reduce the number of pedestrian casualties through good design, appropriate speed management, high awareness of and compliance with, road traffic laws and safe practices by all road users.
RAG status - Amber/Green (Ongoing/complete)
Direction of status - Improving
Recommendations
- Monitoring the five targets to 2020 at SPB and OPG level was not sufficient to understand the underlying road casualty trends which would have allowed to focus attention on where the effort should pivot. That is why the Mid-term Review introduced three Priority Focus Areas and their associated outcomes. The next Framework should set out from the start both Interim Targets to 2030 complemented by Intermediate Outcome Targets that are mode or age specific targets to 2030. A number of other indicators categorised as either Intermediate Measures – tracking performance of casualty figures for specific user groups – or Key Performance Indicators – measuring observed road safety behaviours, vehicle safety and road infrastructure should also be set out in a comprehensive Performance Management System/Framework.
- If the next Framework sets out the above-mention Performance Management System, there won’t be any need to have milestones to 2025.