3. Collision Analysis
3. Collision Analysis
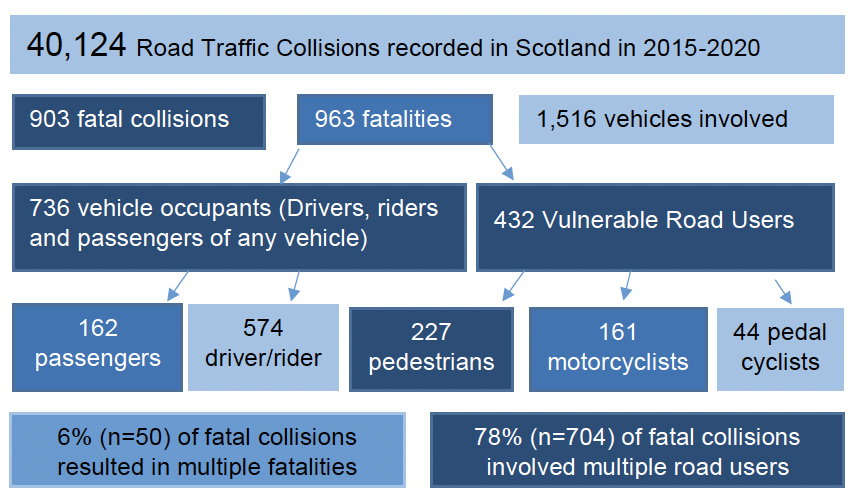
There were 903 fatal collisions involving 963 fatalities recorded between 2015 and 2020. Of these, 226 resulted in pedestrian fatalities, 156 in motorcyclist fatalities and 44 in pedal cyclist fatalities. The remaining 477 fatal collisions did not involve vulnerable road users (VRUs).
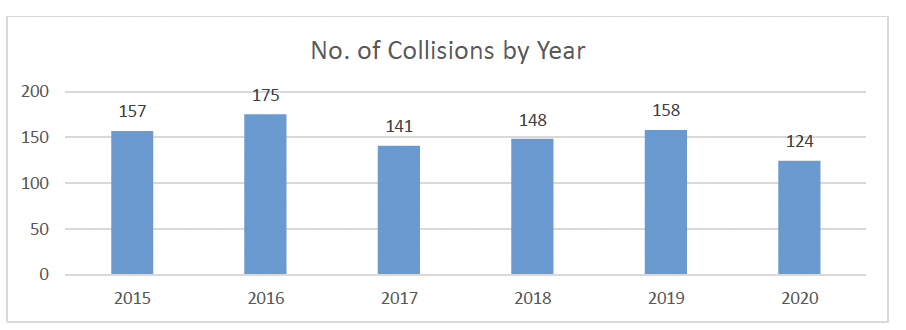
The number of fatal collisions remained relatively steady from 2015-2019 with a notable decrease in 2020. This can largely be accounted for by the Covid-19 pandemic which placed travel restrictions on much of the population.
3.1 Geographical Profile
National Overview
Geospatial analysis of all fatal collisions in Scotland highlights a hotspot around Glasgow with a high concentration of collisions across the Central Belt. Lower intensity hotspots are also observed around major population centres such as Edinburgh, Aberdeen and Inverness.
In addition, there are lesser hotspots/clusters around major roads between Scotland’s cities, on routes to England and around the coast from Dundee through Aberdeen and west to Inverness.
The following maps provide an overview of where all fatal collisions occurred in the north, east and west of Scotland. These includes all vehicular and pedestrian collisions. These maps further highlight that hotspots/clusters exist around Scotland’s cities and across the trunk road network. The highest number of fatal collisions occurred in the west of Scotland (38%, n=344), the lowest number occurred in the east (27%, n=245).
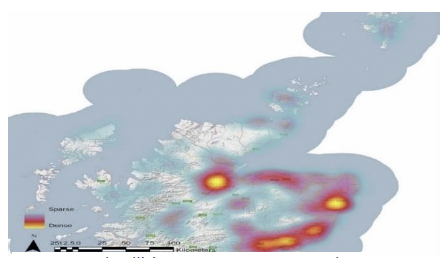
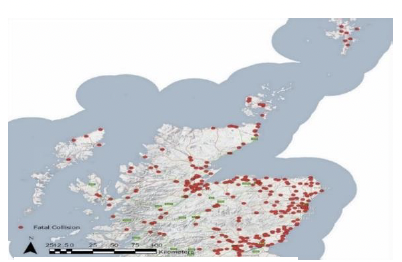
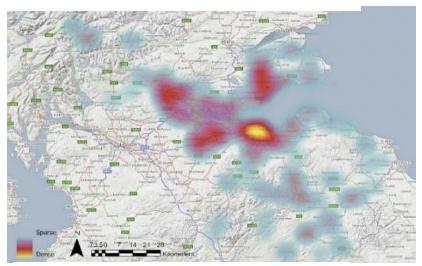
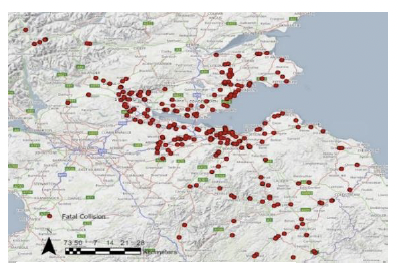
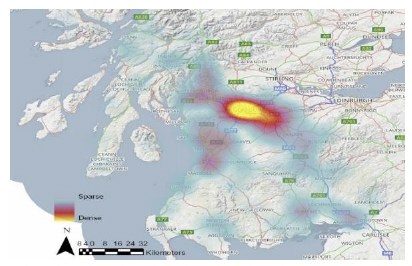
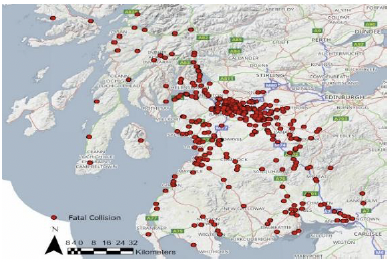
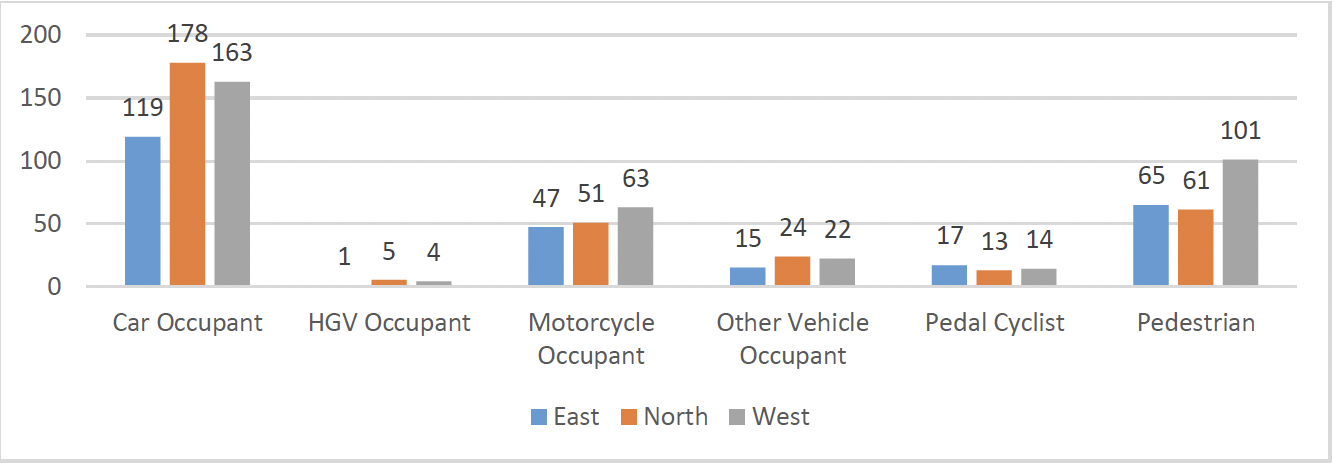
Figure 4 provides a breakdown by casualty class (mode of transport) by geographical area. This shows car occupant fatalities are notably greater in the north and west of Scotland. Pedal cyclist fatalities were more frequent in east. Pedestrian fatalities were significantly more frequent in the west, as were motorcyclist fatalities.
Local Authority Area Overview
Considering fatal collisions in terms of Local Authority Area (LAA) the following provides a more detailed picture.
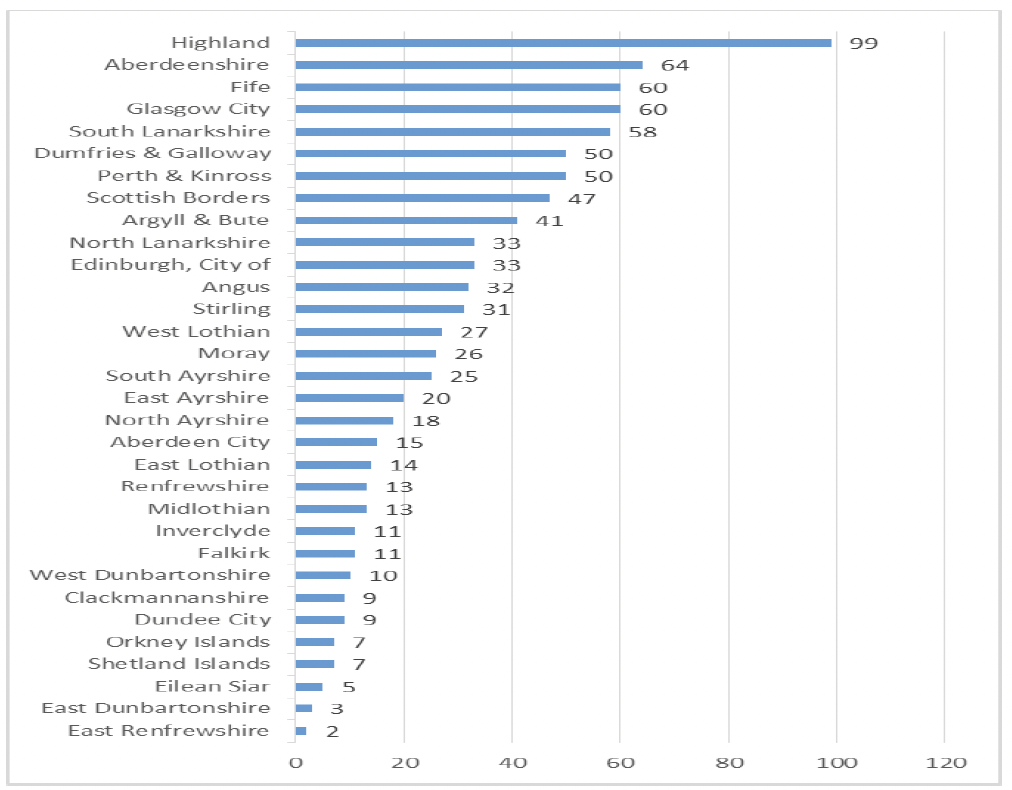
Figure 5 shows Highland local authority saw the most fatal collisions (11%, n=99). This is largely attributable to the topography of many of the roads within
their local authority area and the large geographical area it covers. In addition, as a popular destination for tourists and sightseers, a lack of familiarity with the roads is likely to be a significant factor.
Aberdeenshire (7%, n=64), Fife and Glasgow City (7% respectively, n=60 each) were the LAAs with the next highest number of collisions.
Figure 6 (below), shows the proportion of casualty class by LAA. This shows a high number of car occupant fatalities in Highland (n=66). This is significantly higher than the next highest LAAs, Aberdeenshire (n=38) and Dumfries & Galloway (n=36).
Glasgow City saw most pedestrian fatalities (n=38) followed by Fife (n=20).
Motorcycle fatalities were highest in Scottish Borders (n=15), closely followed by Dumfries & Galloway (n=13).
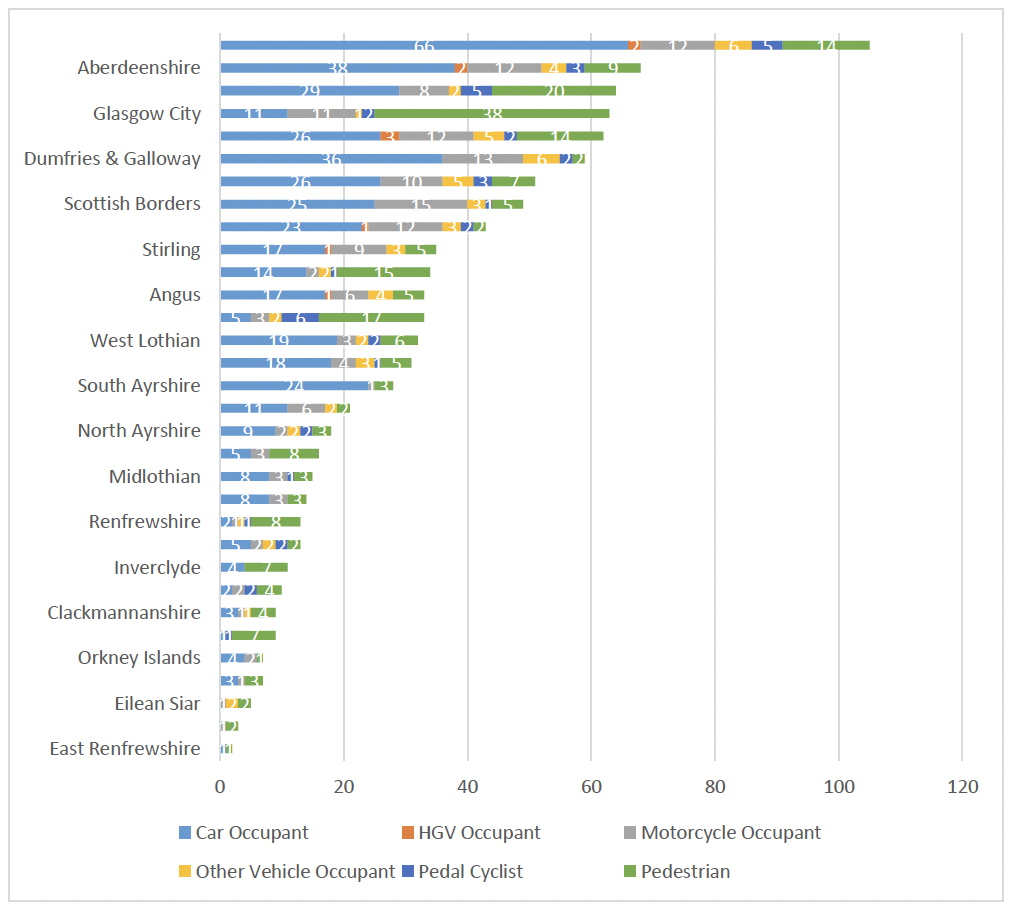
Pedal cyclist fatalities were most common in City of Edinburgh (n=6), closely followed by Fife and Highland (n=5). In total 19 of Scotland’s LAAs saw one or more pedal cyclist fatalities.
Casualty class is subject to further analysis under the fatalities section of this report.
3.2 Collision Type
For the purposes of analysis, collisions have been categorised based on the pertinent manoeuvre carried out which was deemed to have resulted in the collision. It may be the case that a collision could be categorised as more than one collision type, for example those categorised as ‘Overtaking and lane change’ may also fit into ‘Loss of control or off road (straight roads)’ but the overtaking manoeuvre was deemed to be the most significant manoeuvre as this instigated the loss of control.
Miscellaneous was used when the collision type did not fit any of the predetermined categories and was deemed to be a relatively unique set of circumstances. For example, the sudden braking of a bus resulted in a passenger being thrown from their seat and sustaining fatal injuries.
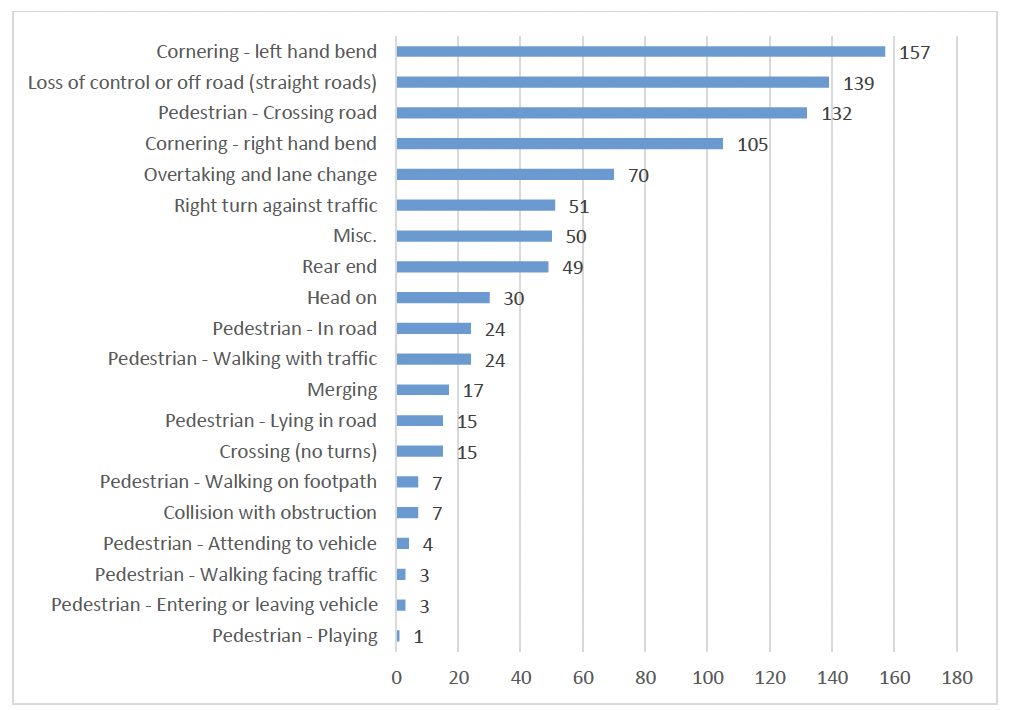
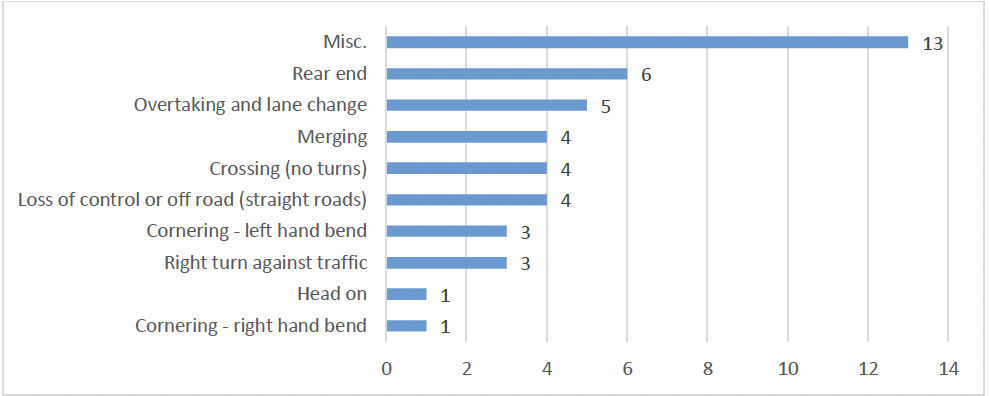
For all collisions, ‘Cornering (left hand or right hand bend)’ and ‘Loss of control or off road (straight road)’ were the most common collision types, accounting for a combined 44% (n=401) of collisions.
‘Pedestrian – crossing road’ is the third most common collision type, accounting for 15% (n=132) of collisions. Figure 7 depicts the collision type for all fatal collisions.
Object Hit when Leaving the Carriageway
Of the 736 non-pedestrian fatalities (i.e. driver/rider/passenger), 38% (n=278) were within a vehicle that left the carriageway and hit an object.
The likelihood that removing these hazards or protecting them with a suitable barrier may have prevented fatal injury will be discussed later in this report.
Figure 8 (below), shows the most frequently hit objects were trees (29%, n=82), and wall or fence (27%, n=75).
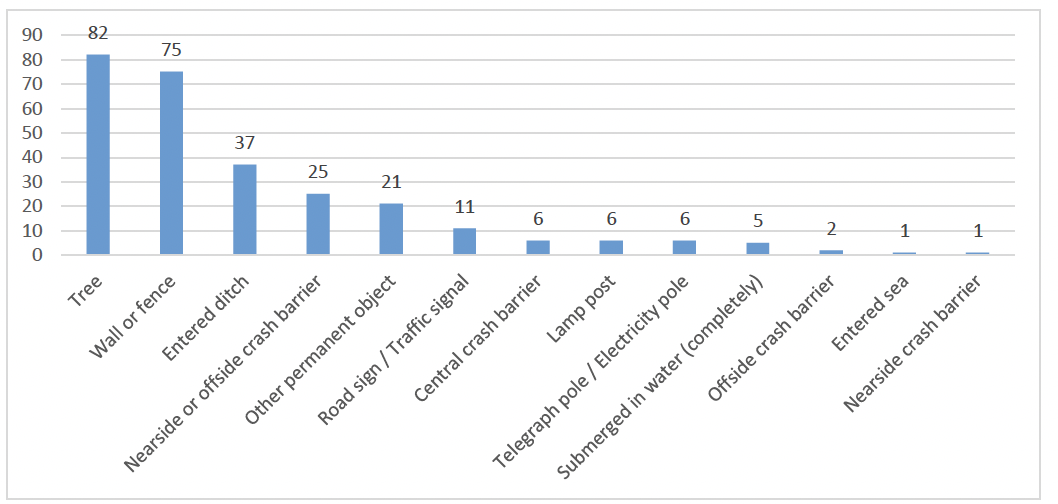
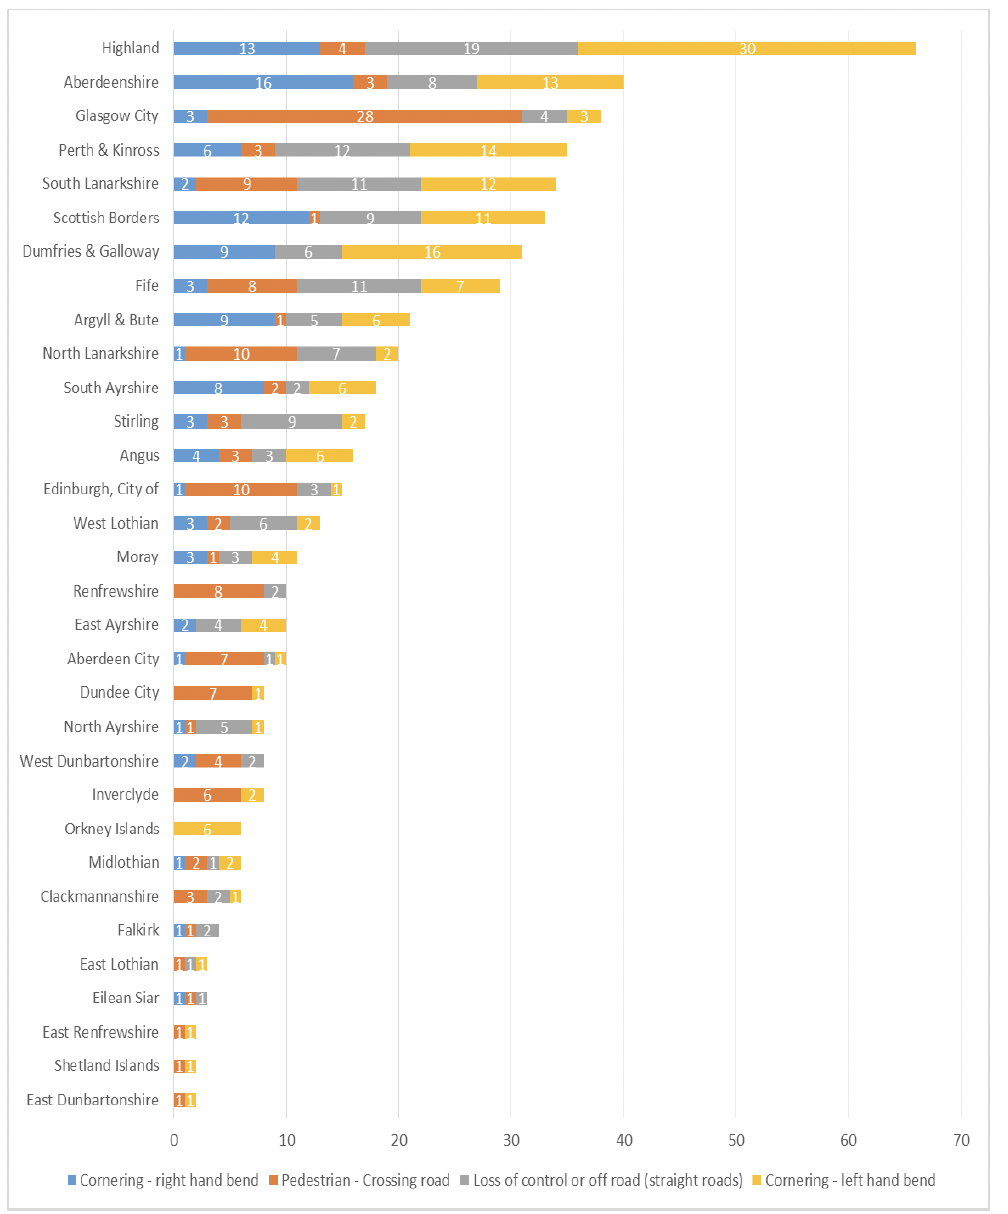
Figure 9, on the next page, shows the four most frequent collision types, as highlighted above, for all Local Authority (LAA).
This highlights Highland LAA saw the most fatal collisions overall across these collision types. 19% (n=30 of 157) of all ‘Cornering – left hand bend’ collisions occurred in Highland.
This chart also highlights the large number of pedestrian fatalities that occurred in Glasgow City. 21% (n=28 of 132) of all ‘Pedestrian-crossing road’ collisions occurred in this area.
This is owing largely to the urban profile of the area and a high presence of both pedestrians and vehicles. The years 2015 and 2020 saw particularly high levels of pedestrian fatalities in Glasgow City (12 and 9 respectively). The remaining four years (2016 – 2019) saw an average of 4 to 5 pedestrian fatalities.
Over the 6-year period, there were 6 to 7 pedestrian fatalities per year on average in Glasgow City. This is compared with an average of 2 to 3 pedestrians in the City of Edinburgh over the same time frame.
However when looking at 2016 – 2019, the average in Edinburgh increases to 3 to 4 which is not dissimilar to the average number in Glasgow over the same period. Therefore, the higher overall number of pedestrians killed in Glasgow is explained by the unusually high numbers in 2015 and 2020.
Collision Type – Pedestrian Fatalities
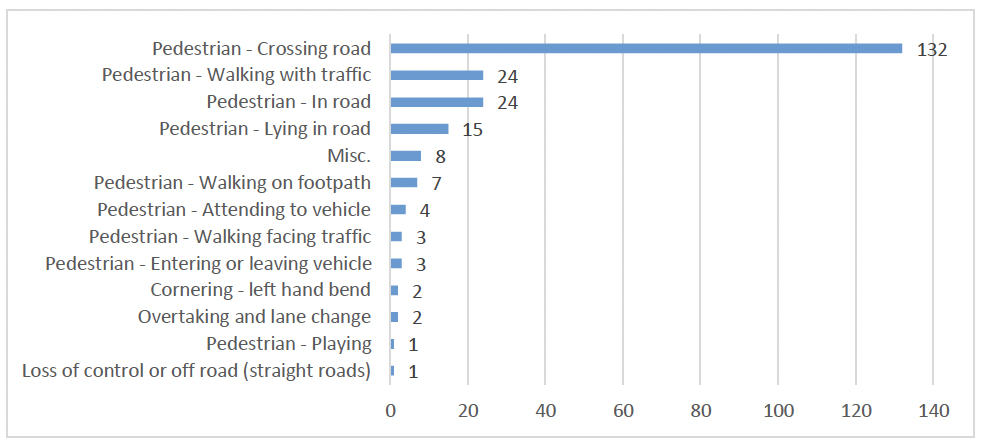
There were 226 collisions that resulted in 227 pedestrian fatalities.
These occurred most frequently when the pedestrian was crossing the road, accounting for 58% (n=132). Pedestrians who were walking with traffic or in the road were the next most commonly recorded, both 11% (n=24).
‘Pedestrian - lying in the road’ was recorded in 15 collisions and primarily involved those where pedestrians have been intoxicated and have fallen into the roadway or, have been lying in the road prior to the collision. Pedestrians who have suffered a medical episode and subsequently fallen onto the roadway are also captured in this category.
Collision Type – Motorcyclist Fatalities
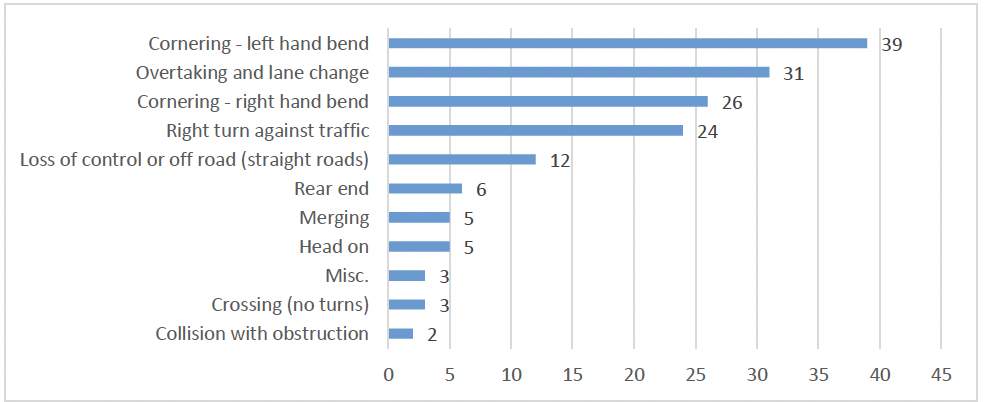
Of the 156 Collisions resulting in motorcyclist fatalities, those involving ‘Cornering (left or right-hand bend)’ were most common, accounting for 42% (n=65) with left-hand bends being more prominent (n=39). ‘Overtaking and lane change’ was the collision type for 20% (n=31).
Collision Type – Pedal Cyclist Fatalities
13 of 44 collisions (30%) resulting in a pedal cyclist fatality were recorded as miscellaneous.
Circumstances included striking a deer in the road, the door of a parked vehicle being opened in the path of a cyclist and other drivers failing to observe the cyclist and crossing into their path.
Rear end (14%, n=6) and overtaking/lane change (11%, n=5) were the next most common.
3.3 Collision Type – Urban/Rural
The majority (71%, n=642 of 903) of collisions occurred in rural environments.[1] 94% of ‘Cornering – right hand bend’ (n=99 of 105 collisions) and 90% of ‘Cornering – left hand bend’ (n=141 of 157 collisions) occurred in rural areas.
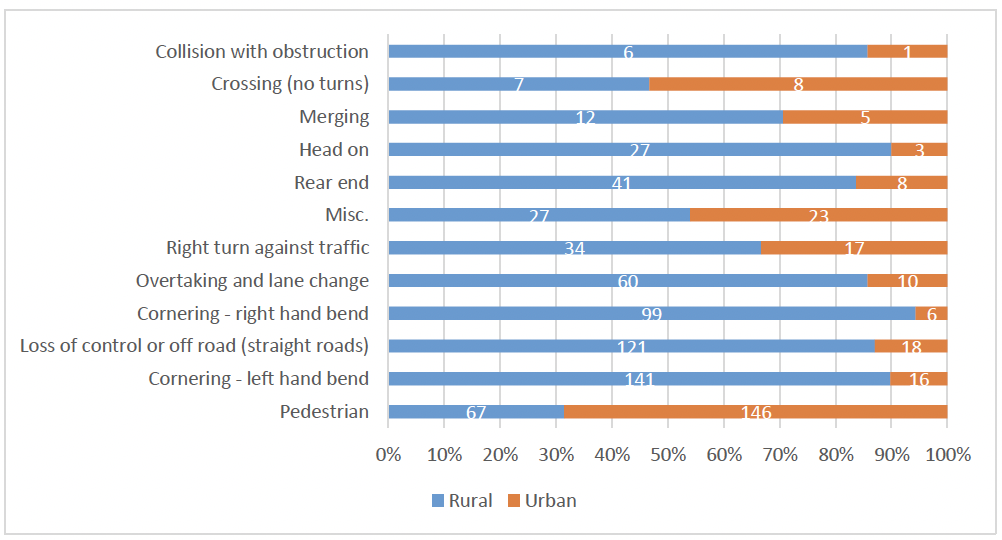
The majority (71%, n=642 of 903) of collisions occurred in rural environments.[2] 94% of ‘Cornering – right hand bend’ (n=99 of 105 collisions) and 90% of ‘Cornering – left hand bend’ (n=141 of 157 collisions) occurred in rural areas.
There were two notable exceptions. Firstly ‘Crossing (no turns)’ was split but slightly favouring urban locations (n=8 of 15 collisions, 53%). Secondly, ‘Pedestrian’ fatal collisions were more common in the urban environment (146 of 213 collisions, 69%).[3] Given the increased population density in urban areas, it is logical that more collisions involving pedestrians are likely to occur.
3.4 Road Type/Class
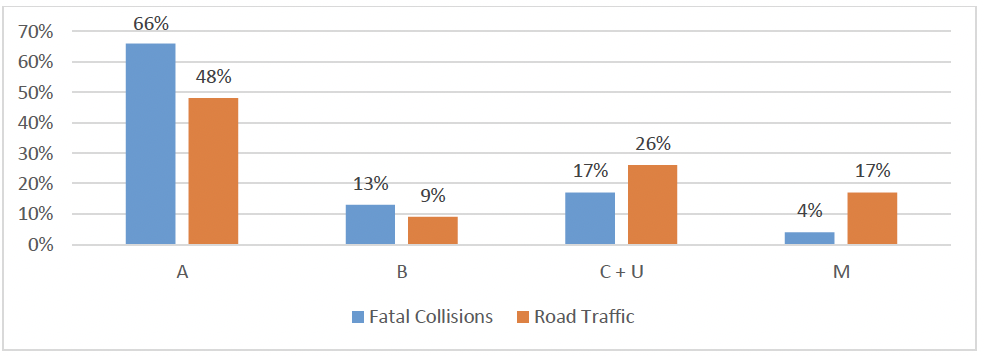
66% (n=600) of fatal collisions occurred on A class roads. Fatal collisions on motorways accounted for 4% (n=37). Figure 13 highlights the differences in road traffic levels per road type compared with the proportion of fatal collisions.[4]
A Class Roads
It is notable that, while A class roads accounted for both the highest proportions of road traffic volume and fatal collision occurrence, there is a stark difference in the levels between the two. Less than half of all vehicle kilometres travelled were on A class roads, but more than half the fatal collisions occurred on these roads.
Motorways
17% of all vehicle kilometres travelled were travelled on motorways, however only 4% of collisions occurred on motorways. This indicates that despite the often higher speeds and close proximity of multiple vehicles on motorways, fatal collisions are much less frequent.
This may be largely attributed to the separation of traffic travelling in opposite directions by central reservation barriers and the well-maintained roads.
Motorway collisions are much more likely to occur with vehicles travelling in the same direction, meaning less energy is involved in a collision.[5] This translates to a reduction in the severity of any collision and a reduced risk of fatality.
Posted Speed Limit
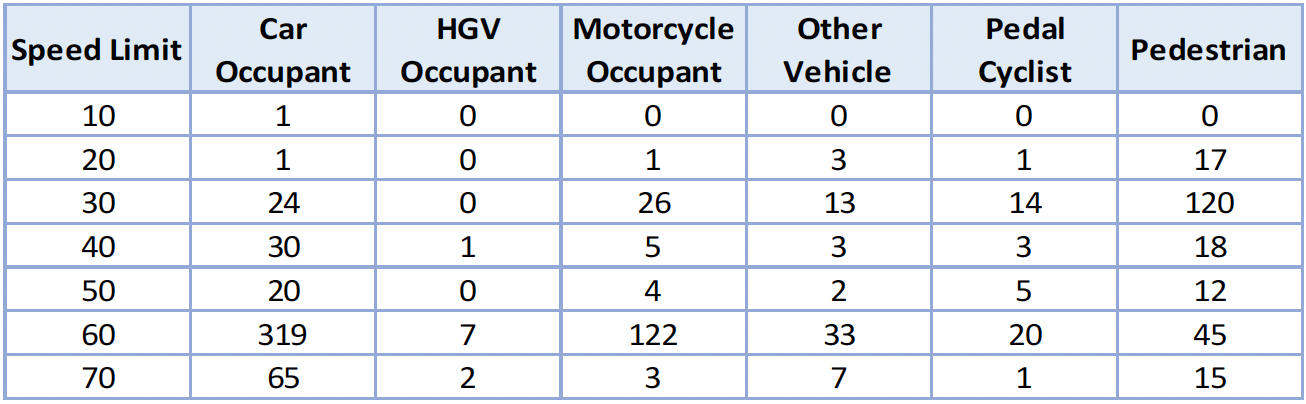
Figure 14 (below), shows the casualty class and posted speed limits of the roads on which fatal collisions occurred.
It must be noted that while this is the speed limit, it does not represent the speed at which a vehicle was travelling. For example, a driver at fault may be travelling at 50 mph on a road where the speed limit is 30mph.
Pedestrian
Pedestrian fatalities occurred more frequently on roads with lower speeds limits. 53% (n=120) occurred on 30mph roads and 7% (n=17) on 20mph roads. A further 20% (n=45) occurred on roads with a 60mph limit.
Pedal Cyclists
Pedal cyclists were most frequently killed on 60mph roads (45%, n=20) where they share roads with other faster-moving vehicles followed by 30mph roads where 32% of cyclists were fatally injured (n=14).
The majority of all other casualty classes were fatally injured on 60mph roads.
3.5 Temporal Profile
Figure 15 shows 460 car occupant fatalities occurred across all days of the week with the most frequent days being Saturday (n=84, 18%) and Sunday (n=75, 16%).
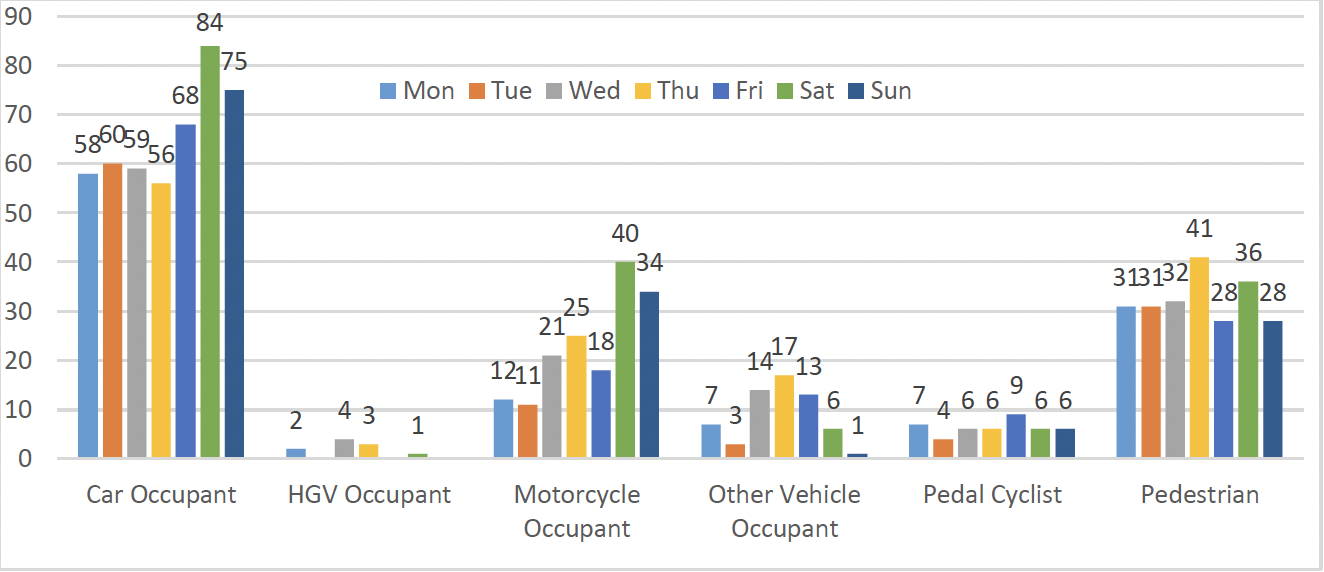
The weekend was also the most frequent time of the week for a collision resulting in a motorcyclist fatality.
The majority (n=9, 90%) of Heavy Goods Vehicle (HGV) occupant fatalities occurred on a weekday. Pedal cyclist and pedestrian fatalities were relatively evenly spread across the week.
Days of the Week / Hours of the day
Table 1 shows the days of the week against hours of the day for fatal collision occurrence.
From this it can be seen fatal collisions occurred most frequently between 10am and 6pm with the most frequent time being 4pm to 5pm.
The least frequent time for fatal collisions overall was between 3am and 6am.
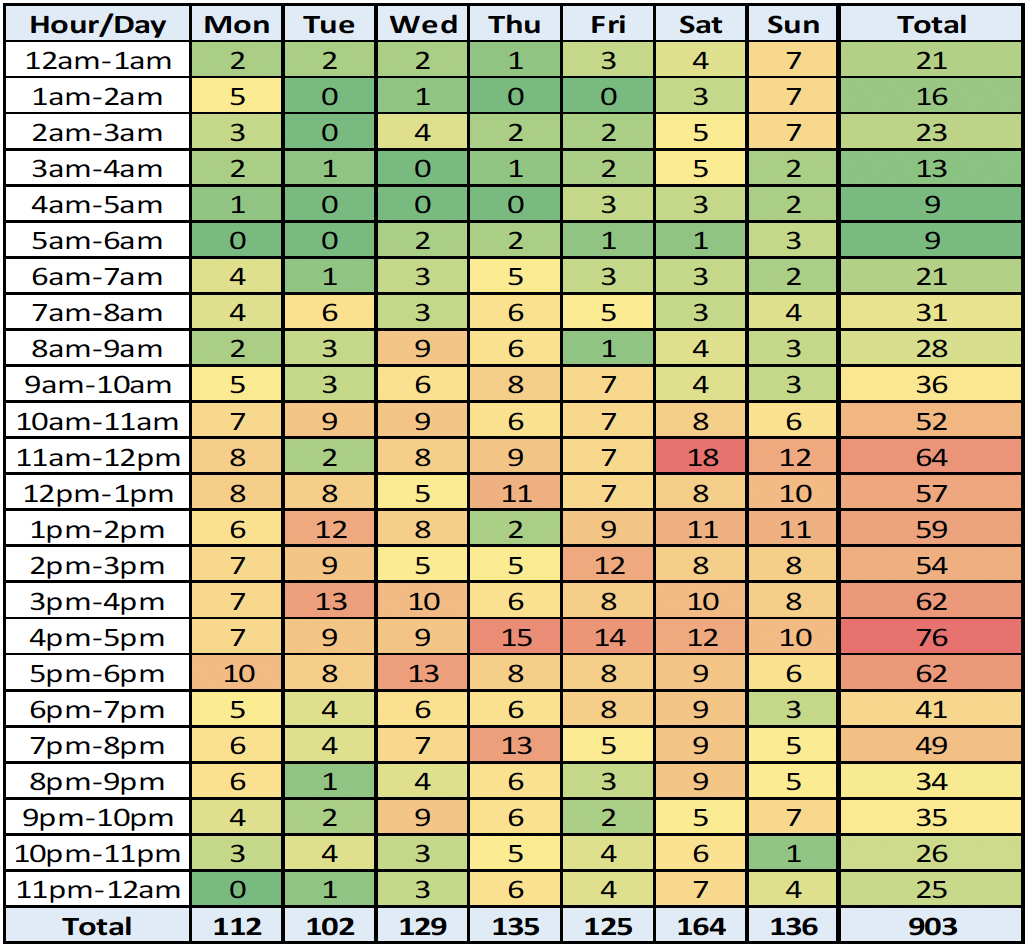
Thursday and Friday from 4pm to 5pm and Saturday from 11am to 12pm were the days and times when most fatal collisions occurred.
Casualty Class by Season
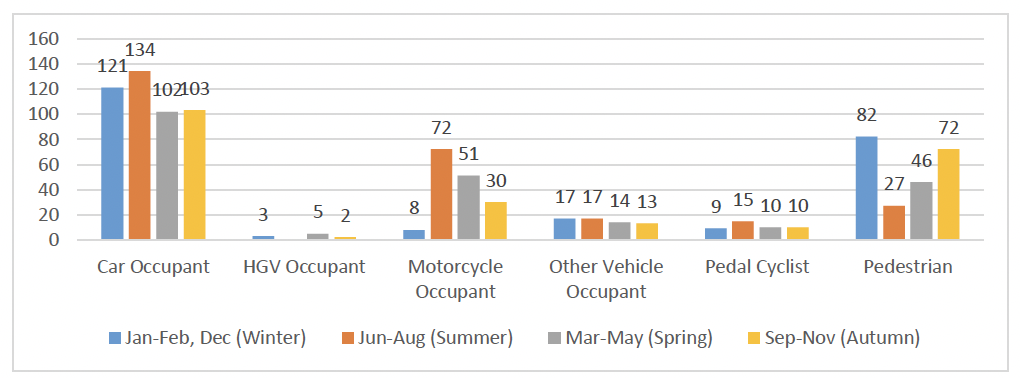
The most frequent single season for car occupant fatalities was summer followed by winter.
Motorcyclists
Motorcycle occupant fatalities were most common in the summer and least common in the winter. Motorcyclists tend to favour nicer weather during spring and summer months with many riders only insuring motorcycles for six months over the summer season.
Pedestrians
The majority of pedestrians were killed in autumn and winter when weather and lighting conditions are less favourable and they may be less visible to drivers.
3.6 Drivers/Riders Deemed at Fault
There were 1,516 drivers/riders involved in the 903 fatal collisions. 977 of these were found to be ‘at fault’ for the collision.
Age[6]
Drivers/riders aged 46-55 (n=303, 20%) and 26-35 (n=286, 19%) were most frequently involved in fatal collisions. Combined, these age groups accounted for 39% of all drivers/riders. (Recommendation 8 Motorcycle Safety Campaign)
However, when examining drivers/riders at fault for the collision, there is a shift towards younger drivers with those aged 26-35 (n=201, 21%) and 16-25 (n=189, 19%) being the two most represented age groups.
A further breakdown of younger drivers (those aged 16-25) shows those aged 16-20 accounted for 8% and 21-25 year olds account for 11% of all drivers at fault.
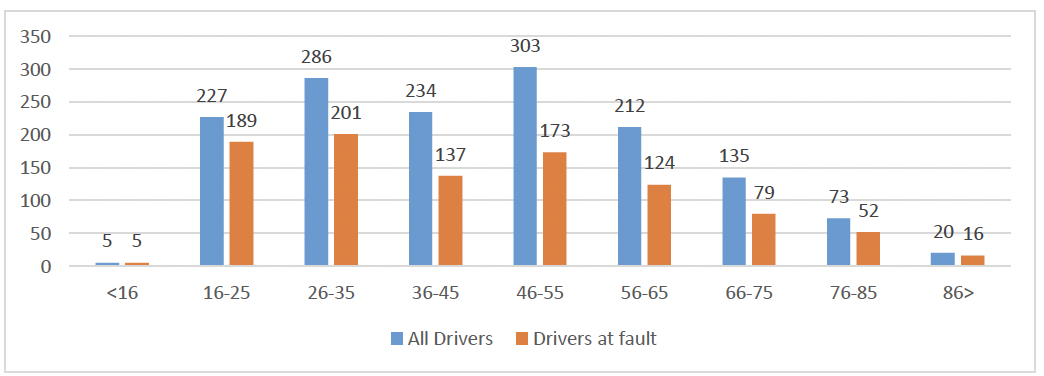
Figure 17 shows the overall numbers of drivers/riders involved in fatal collisions and driver/riders at fault by age group. 84% of drivers/riders aged 16-25 involved in fatal collisions were deemed to be at fault. This is compared with 57% of those aged 46-55. This indicates that, when younger drivers are involved in fatal collisions, they are more likely to have been at fault.
100% of driver/riders under 16 were deemed to be at fault when they were involved in a collision. Vehicles being driven/ridden on those occasions included pedal cycles and motorcycles/quad bikes.
80% of drivers/riders aged over 86 were deemed to be at fault for fatal collisions indicating that when involved, they bear a high level of responsibility. (Recommendation 35 Education)
Sex[7]
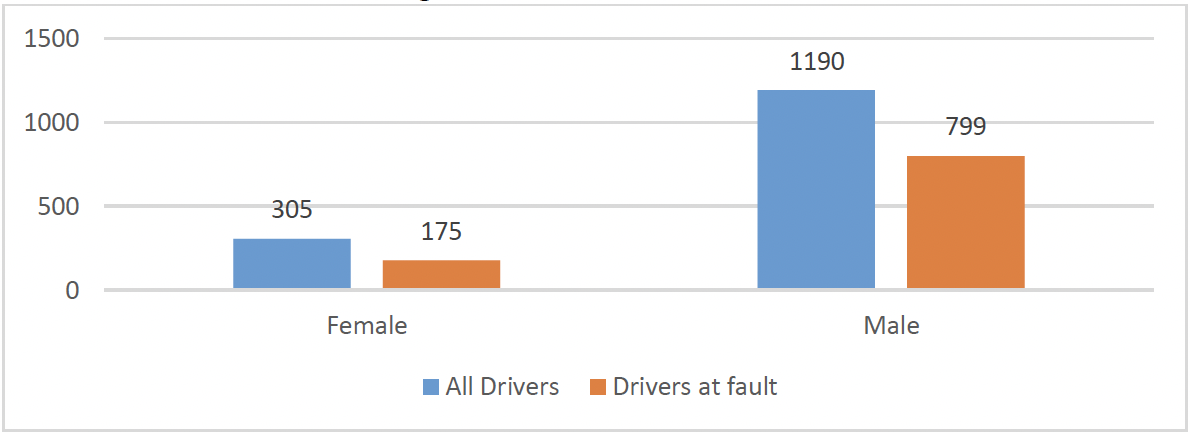
Department for Transport data shows the number of males and females with full driving licences to be relatively equal with males accounting for 54% and females 46%.[8] Despite this relatively equal split, males accounted for 80% (n=1,190 of 1,495) of all drivers/riders involved in fatal collisions and 82% (n=799 of 974) of all drivers/riders at fault.
67% (n=799 of 1,190) of all male drivers/riders involved in fatal collisions were at fault compared with 57% (n=175 of 305) of all female drivers/riders. Men are more likely to have jobs that involve driving, such as delivery drivers and taxi drivers and are thought to drive more miles overall than women.[9]
This greater presence and increased exposure on the roads may increase their risk and likelihood of being involved in a fatal collision.
There are however notable differences between the sexes when it comes to driving behaviours, with males more prominent when it comes to dangerous behaviour including speeding, aggressive driving and impairment by alcohol and/or drugs.[10]
These contributory factors will be considered in terms of sex differences further on in this report.
Vehicles[11]
Of the 1,516 vehicles involved in fatal collisions, 64% were cars (n=973).
Motorcycles accounted for 11% of all vehicles involved (n=170), despite totalling only 2% of all vehicles licensed for road use in Scotland.[12]
This highlights a disproportionate level of motorcycle involvement in fatal collisions when compared with their road presence.
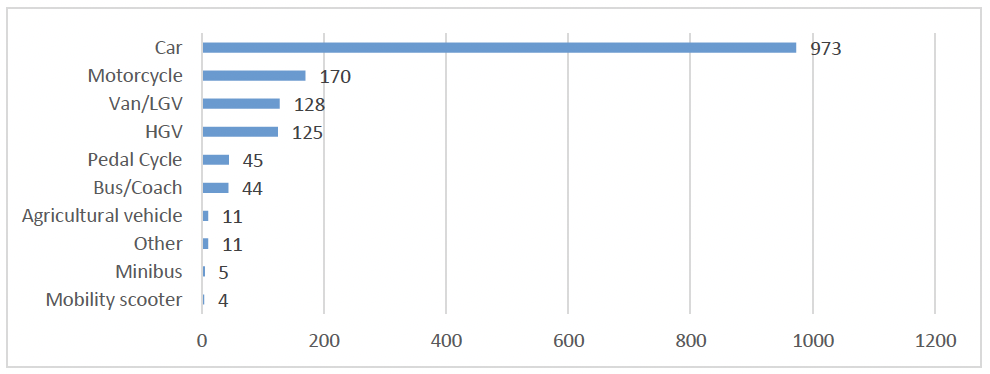
Figure 20 [13] depicts the proportion of vehicle types involved in fatal collisions where the driver/rider has and has not been at fault. This highlights that when involved in fatal collisions, 86% of motorcycle riders were at fault (n=146 of 170).
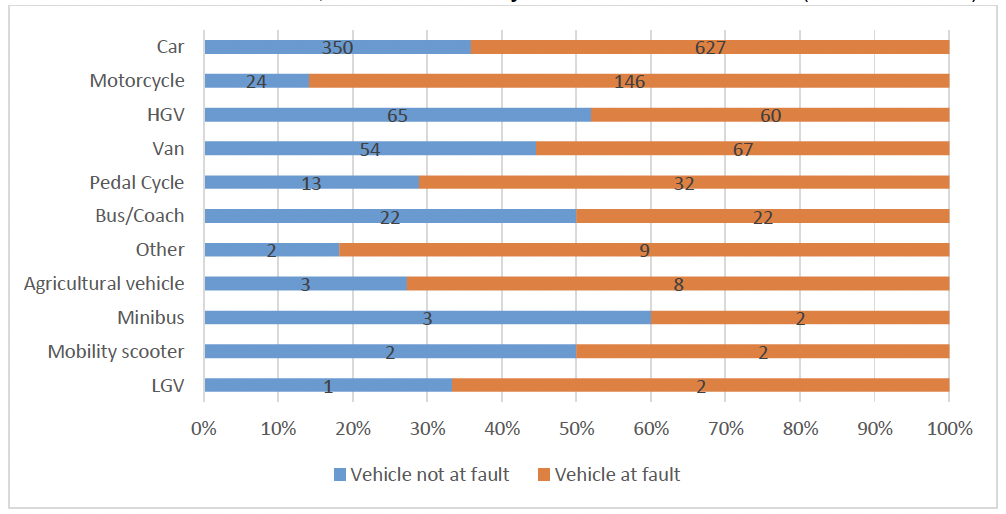
71% of pedal cyclists (n=32 of 45) were deemed to be at fault as were 73% of agricultural vehicle drivers (n=8 of 11).
It should be noted this does not always mean they were solely responsible for collision occurrence but, rather, that their actions contributed in some way.
3.7 Fatalities
Casualty Class[14]
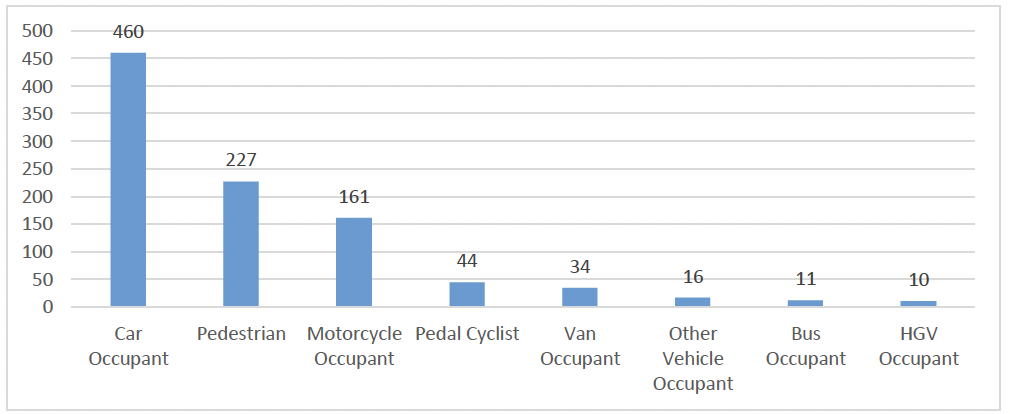
The most common casualty class was ‘car occupant’, accounting for 460 of the 963 fatalities (48%). 24% were pedestrians (n=227).
Vulnerable road users (pedestrians, motorcyclists and pedal cyclists), combined, accounted for 432 fatalities (45%). Vulnerable road users are disproportionately represented in road fatality figures compared with their level of road use.
Motorcyclists
Motorcycles are estimated to account for around 2% of vehicles licenced for use on Scotland’s roads and less than 1% of road traffic volume.[15] Motorcyclists however accounted for 17% of all fatalities. In almost all (99%, n=154 of 156) fatal collisions involving a motorcycle, it was the motorcycle rider and/or pillion passenger who died.
Five collisions resulted in the death of both the motorcycle rider and pillion passenger. This again highlights the particular vulnerability of this group of road users when involved in collisions, largely due to the lack of physical protection provided to them on this mode of transport.
Pedal Cyclists
Pedal cyclists accounted for 5% of all fatalities.
Pedal cyclist traffic is estimated to account for around 1% of all road traffic, although there has been increase in recent years as a result of both the Covid-19 pandemic and a conscious move by some to travel in a more economical and sustainable way.[16]
Age
There were fatalities across all age bands between 2015 and 2020.
The age groups with the largest number of fatalities were those aged 16-25 (n=149) and those aged 46-55 (n=147), each accounting for 15% of fatalities. Those aged under 16 and over 86 were the least frequently killed.
There were 29 child[17] fatalities, ranging from the age of 1 year-old to 15-years old, 14 of which (48%) were fatally injured as pedestrians.
Casualty Class by Age
Across the majority of age groups, more people were killed as drivers or riders than as passengers or pedestrians.
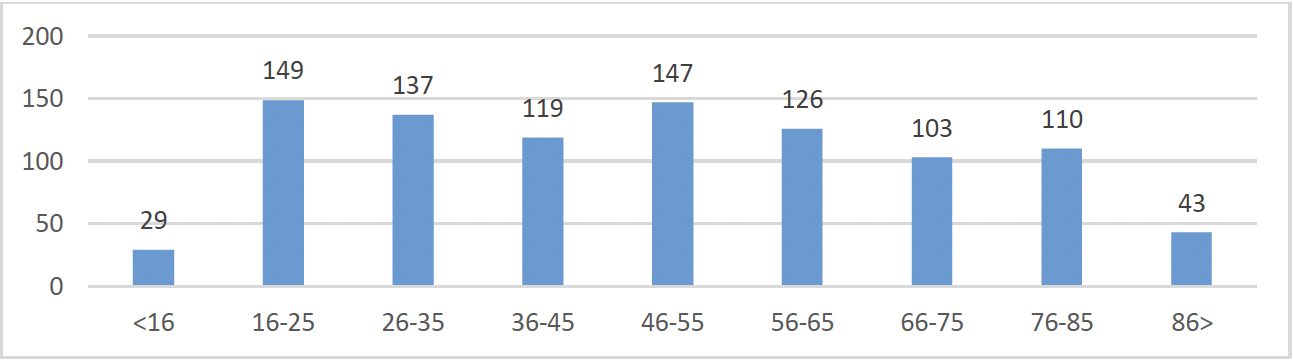
Figure 23 shows those aged under 16 and 76-85 were killed more frequently as pedestrians. These age groups may be more likely to be travelling on foot thus increasing their risk of becoming pedestrian fatalities.
However, there may be other factors to consider, including a lack of awareness and understanding around dangers amongst younger children or eyesight and mobility issues amongst older pedestrians.
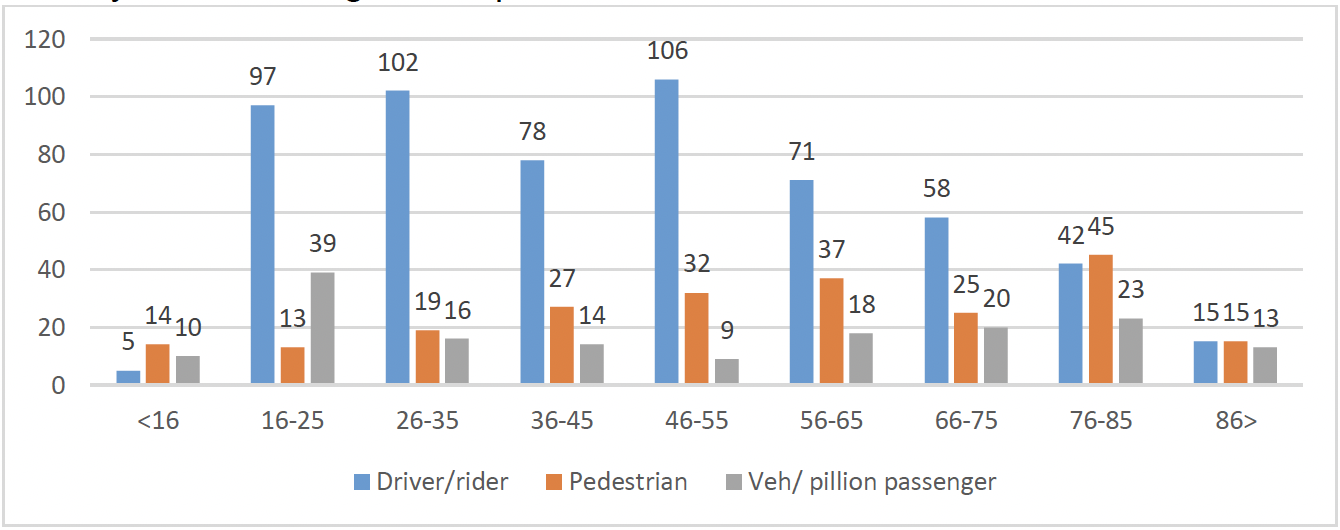
Figure 23 also shows those aged 16-25 were killed most frequently as passengers than any other age group.
Further analysis has found 77% of passengers in this age group (n=30 of 39 fatalities) were killed in vehicles driven by someone aged 16-25. This will be explored further later in this report.
Sex
Males were killed at a significantly higher rate than females. Males accounted for 673 (70%) fatalities, compared to 290 females (30%).
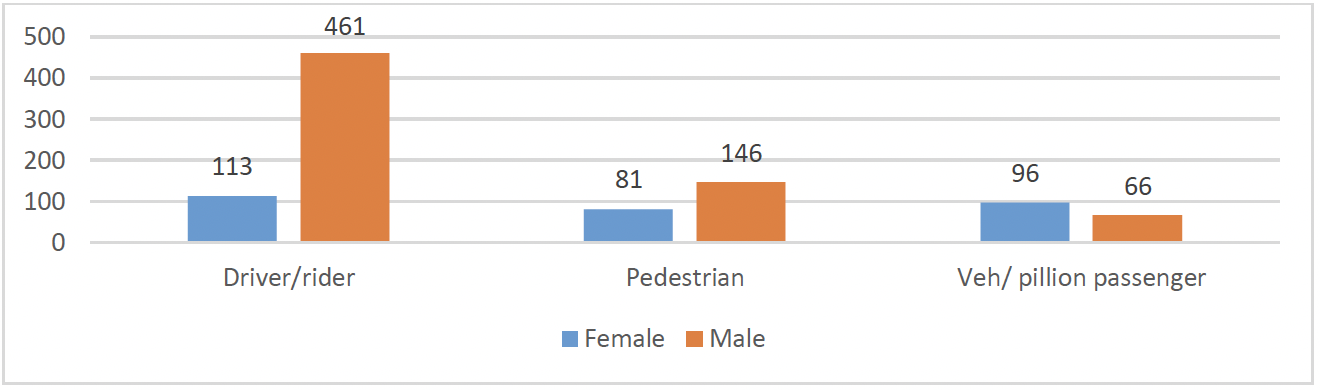
Figure 24 shows males were killed significantly more frequently as drivers/riders than females. Men are said to drive more miles than females and are more likely to have driving-related professions[18], therefore exposing them to the risk of a fatal collision more frequently.
Further explanations for higher rates of male fatalities relate largely to cultural gender differences.
It has been suggested women are more likely to drive cars that have been selected based on safety features and reliability, whereas males may be more focused on performance and style.[19]
Men are also more likely to exhibit risky behaviours including not wearing a seatbelt, not wearing a helmet or other safety gear when on a motorcycle, and speeding which results in collisions happening at higher speeds and increasing the likelihood of fatal injury.[20]
Pedestrian
Pedestrian fatalities were also more frequently male than female.
Research has shown males are less likely to cross at designated pedestrian crossings, more likely to make errors (such as misjudging the speed of oncoming vehicles), and more likely to be impaired by alcohol[21] all of which increase their likelihood of becoming a pedestrian fatality.
Passengers
More females were killed as passengers. Although the number of female drivers is increasing[22] there is some evidence that culturally, where heterosexual couples are involved, the male is more likely to drive with the female as a passenger which may increase the risk of females being killed as a passenger.[23]
Although men account for a higher proportion of road users and are therefore more likely to be involved in fatal collisions, when females are involved they are more likely to be killed or seriously injured.[24]
It has been identified that females involved in road collisions are significantly more likely to die as a result of injuries to their lower body than their male counterparts.[25] This is largely attributed to vehicle design which often does not take into account the height of an average female. As a result, women often need to sit closer to the steering column in order to reach the car’s pedals.
This would appear to be supported by the findings of this research, as shown in figure 25.
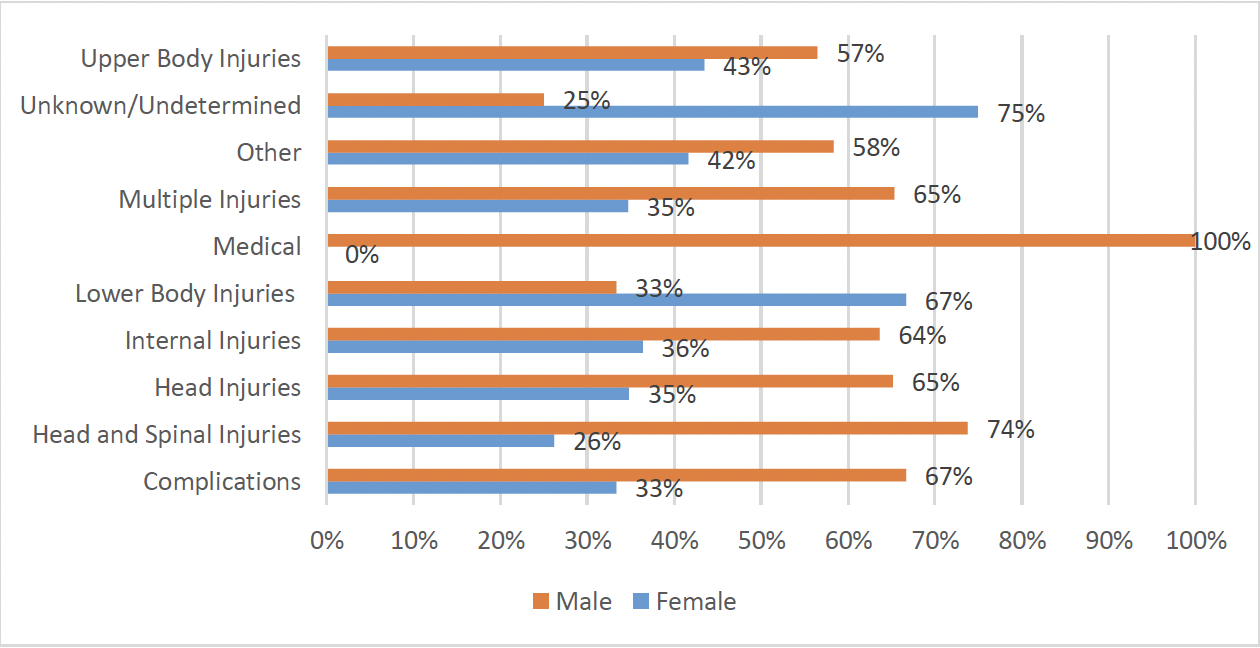
Figure 25 displays the injury type of those killed within a vehicle[26], the split for most injury types was relatively similar to the split of males and females killed in collisions (i.e. around 70% male, 30% female). The exception to this was lower body injuries where 67% (n=2) of those whose primary injuries occurred in this area were female. Although the numbers are small, it suggests more suitable safety testing is required based on sex.
Crash-test dummies have historically been designed based on the ‘average’ male and, therefore, do not take into consideration the differences in height, weight, body shape, body composition and spine stiffness, resulting in vehicle design being favoured towards the protection of males.[27]
Female crash test dummies have been developed and used in safety testing, however questions surrounded how accurately they reflected the female body.
In 2022, a team of Swedish engineers developed the first dummy designed on the body of the average woman.[28] Lab testing is ongoing to analyse the impact of collisions on this dummy and will provide data on ways in which vehicle design can be altered and improved to further protect female occupants.[29]
There is currently no mandatory requirement to use crash test dummies representative of the female body, however the results of the aforementioned testing may do a lot to change this, ultimately improving road safety and boosting gender equality. (Recommendation 55 in car safety)
Criminal History
200 Criminal History Service (CHS) records were available for the 977 drivers/riders at fault[30]. Of these, 108 (54%) had previous convictions for a variety of criminal offences including 81 drivers with previous convictions for driving related offences including dangerous driving, careless driving, drink driving and speeding.
This only takes into account the offences for which a driver has been convicted in a criminal court. It does not cover Recorded Police Warnings (RPW), Conditional Offer of Fixed Penalty Notices (COFPN) or Anti-Social Behaviour Orders (ASBOs) which can be issued for driving-related offences. Therefore, it may be the case drivers have come to the attention of police for criminal behaviour but, as this has not been dealt with in a court, it will not be captured by CHS.
Furthermore, CHS only captures convictions which occurred in Scotland. Therefore this analysis may not capture the whole picture of previous convictions and criminal behaviour.
It is evident that a large number of drivers who have been at fault for fatal collisions have previously been convicted for driving related offences and, therefore, have not been deterred by the punishments received in the earlier instances.
Age Categories
Drivers with traffic-related previous convictions were overwhelmingly male (96%, n=78 of 81) and almost half (48%, n=39) were aged 16-35 (21%, n=17 aged 16-25 and 27%, n=22 aged 26-35).
This supports the suggestion that younger drivers, particularly males, are more likely to exhibit risky driving behaviours.
Home Location
The majority (52%, n=42 of 81) of drivers with traffic-related previous convictions had home postcodes within the most deprived areas of Scotland.
Drink and Drug Offences
Of the 77 drivers found to have been ‘Impaired by alcohol’, criminal history was available for 19 of them. There was evidence of drivers who had previous convictions for drink-driving.
80 drivers at fault were impaired by drugs. Again, evidence was found of previous convictions for drug-related offences including drug-driving.
Therefore, there may have been opportunities for interventions to prevent or deter them from driving a vehicle while impaired on further occasions, which ultimately resulted in a fatal collision. (Recommendation 3 General)
Speeding
204 drivers were assigned the contributory factor ‘Exceeding the speed limit’, 10 of which had previous convictions for speeding.
This may suggest the penalties given out for the initial speeding convictions were not sufficient enough to act as a deterrent, and similar behaviour has been repeated ultimately resulting in a fatal collision.
An increase in penalty points as a deterrent could be particularly relevant for newer (often younger) drivers who will lose their licence if they reach six or more penalty points within two years of passing their driving test.
Careless Driving
After speeding offences (29 drivers at fault with previous convictions), ‘Careless driving’ was the next most common driving-related previous conviction, with 24 drivers at fault having been convicted of this offence.
The contributory factors assigned to these drivers largely related to careless driving but also included ‘Failed to look properly’; ‘Careless, reckless or in a hurry’ and ‘Failed to judge others path/speed’.
This indicates that some drivers who have previously displayed, and been prosecuted for, careless driving have not been deterred from repeating similar behaviour.
Dangerous Driving
‘Dangerous driving’ was a previous conviction for 8 drivers.
Further information is not available about the behaviour that was considered dangerous in these earlier instances – it may have included dangerous overtaking, racing or knowingly driving a vehicle with a dangerous fault or unsafe load.
A number of these drivers were then convicted of Causing Death by Dangerous Driving following the fatal collision.
This included drivers who had previously been banned for prior driving offences. This exemplifies a pattern of driving behaviour and a continued disregard for road safety.
Repeat Offenders
45 drivers had more than one previous conviction for road traffic offences.
This included being convicted of the same offence type on repeated occasions (e.g. multiple speeding offences) or being convicted of multiple different offence types (e.g. careless driving and speeding).
19 drivers who were at fault for fatal collisions were convicted of further offences following the collision; 8 of which were for traffic related offences including dangerous driving, careless driving and drink driving.
Of these, 8 drivers, 63% (n=5) also had previous convictions for road traffic offences.
This shows a repeated and continued lack of consideration for road safety and adherence to road traffic legislation. (Recommendations 62, 63, 64)