4. Contributory Factors.
4. Contributory Factors.
Analysis of contributory factors (CF) for fatal collisions is complex. There is often a number of factors which contribute at any one time to the occurrence and severity of a collision. The removal of any one of the CFs could result in a different outcome.
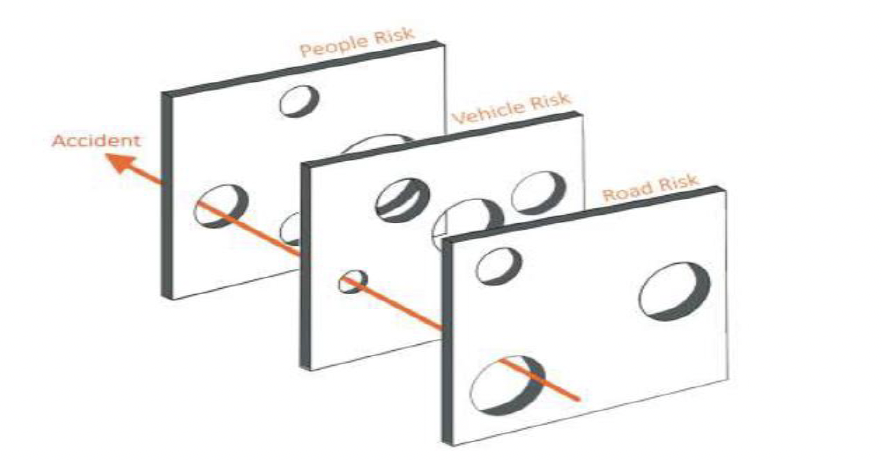
This is visualised by the ‘Swiss cheese model’ of hazards (see Figure 26) first proposed by Reason (1990). This shows how failures (collisions) occur only when specific risks align. If any one aspect is not conducive to the occurrence of the collision, it is prevented.
A total of 5,939 CFs were identified across the 903 fatal collisions from 2015-2020. Every collision was assigned at least 1 CF and the most any single collision had was 14.
Contributory factors were assigned to a collision if they were deemed to be pertinent in any way to the cause of the collision. Each factor was given a level of confidence – A (very likely) or B (possible). All assigned CFs of both A and B levels of confidence are included in the analysis to ensure the most comprehensive picture was established.
Multiple CFs can be assigned to a single person, vehicle or road as it was possible for numerous factors to have resulted in the occurrence of the collision and the resultant outcomes.
It should be noted that one CF did not fit into the categories of ‘People’, ‘Vehicle’ or ‘Road’ – this was ‘Gusting wind’. This was a CF in 4 fatal collision
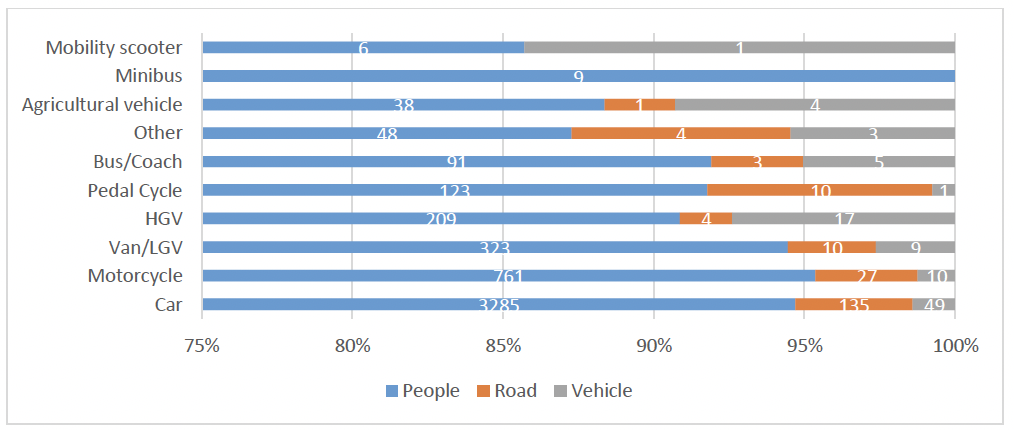
Figure 27 shows the number of fatal collisions where ‘People’, ‘Vehicle’ or ‘Road’ CFs were assessed as having contributed. ‘People’ CFs were the most prevalent with almost all collisions involving at least one ‘People’ CF (n=901 of 903).
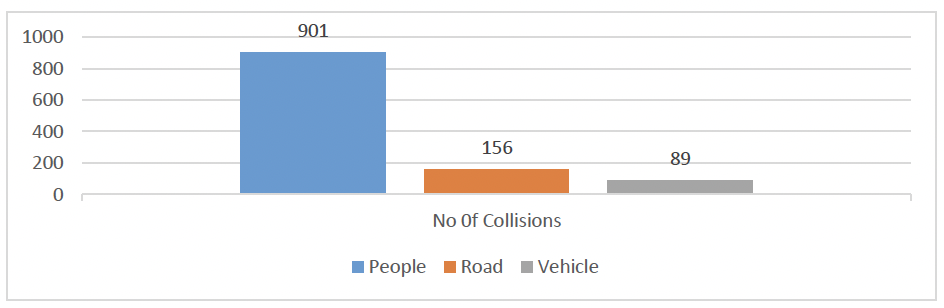
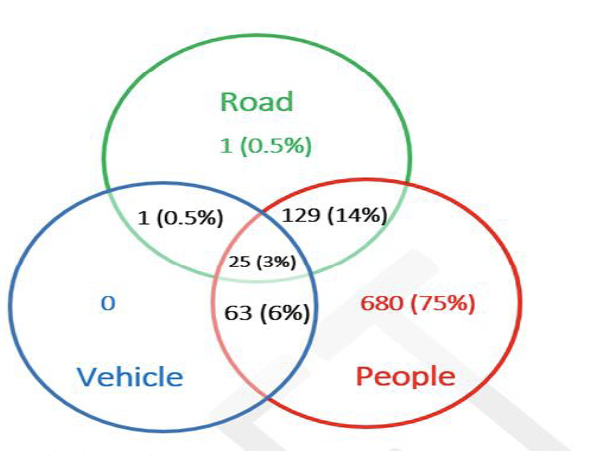
Figure 28 shows the majority of collisions (75%, n=680) involved solely ‘People’ CFs. 14% involved both ‘People’ and ‘Road’ and 6% involved ‘People’ and ‘Vehicle’. 3% of fatal collisions involved CFs from all three. Only two collisions did not involve ‘People’ CFs.[31]
4.1 People Contributory Factors
There was a total of 5,638 CFs relating to ‘people risk’ assigned across the 903 fatal collisions.
The five most prevalent factors relating to people, ‘Careless, reckless or in a hurry’, ‘Failed to look properly’, ‘Loss of control’, ‘Poor turn or manoeuvre’ and ‘Failed to judge others path/speed’ accounted for a combined 2,413 (43%).
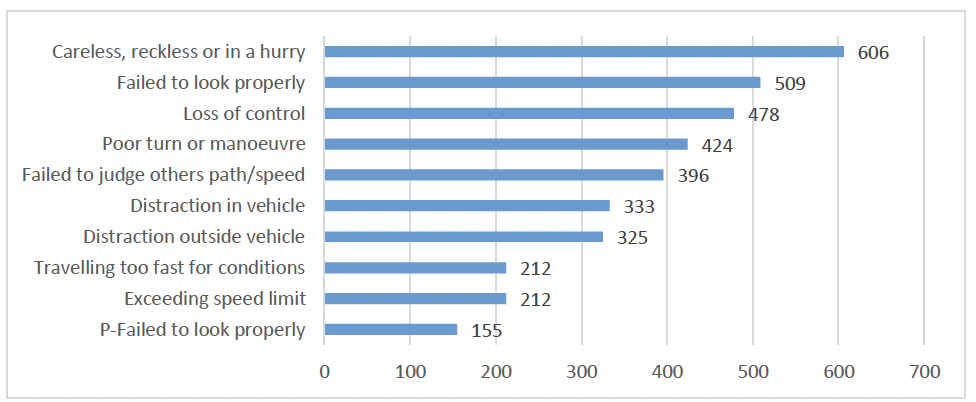
Other commonly recorded CFs included ‘Distraction’, both inside and outside of vehicles, accounting for 658 CFs (12%) and speed-related CFs (Exceeding speed limit and Travelling too fast for conditions) accounting for a further 424 CFs (8%). A full breakdown of people-related contributory factors is provided in Appendix C.
Interlinked Contributory Factors
Many of the most-commonly applied CFs are largely interlinked.
To illustrate, ‘Careless, reckless or in a hurry’ was the most common ‘People’ CF, assigned 606 times across 579 collisions.
Of those:
- 337 collisions (58%) were also assigned ‘Failed to look properly’.
- 345 collisions (60%) were also assigned ‘Loss of Control’.
- 346 collisions (60%) were also assigned ‘Poor turn or manoeuvre’.
86 collisions were assigned all four of the above - failing to look properly may result in a driver committing a poor turn or manoeuvre and ultimately losing control. This may all have occurred because the driver was being careless, reckless or in a hurry.
For most collisions, it cannot be ascertained why a driver chose to behave or drive in a certain way. We may never know why they chose to drive at excessive speed, why they lost control or why they failed to notice an oncoming vehicle or hazard. Therefore, considering the impact of countermeasures including improved safety features within vehicles, such as ‘AEBS’ and ‘Distraction monitoring’ (which come into play when certain behaviours occur) and ‘Improved road user training and education’ (which aim to either prevent these behaviours from occurring), will be more beneficial.
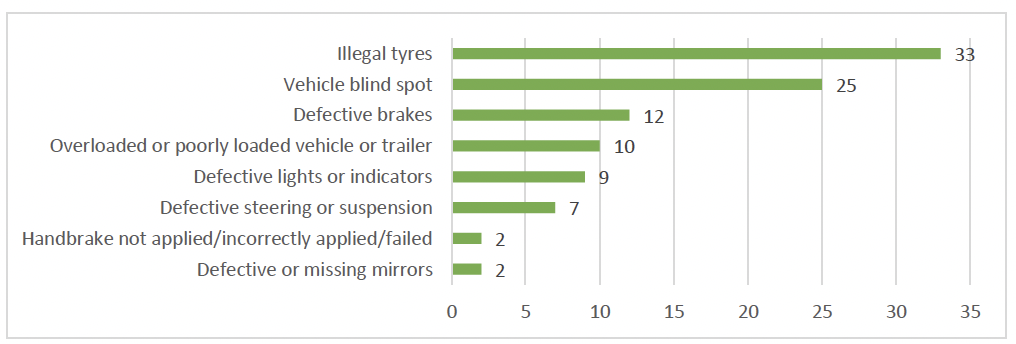
4.2 Vehicle Contributory Factors
The frequency of all ‘Vehicle’ CFs are shown in Figure 30. ‘Illegal tyres’ and ‘Vehicle blind spot’ were found to be the most-frequently applied CFs for vehicles.
Many of the factors could be argued to be ‘People’-related as the responsibility is on the operator of a vehicle to ensure that it is roadworthy, and its features are not defective. Nevertheless, as they are factors relating to the vehicle, they are categorised as such.
Vehicle Contributory Factors And Vehicle Type
Of the 100 assigned Vehicle contributory factors, cars were the vehicle type assigned CFs most frequently (n=49) followed by HGVs (n=17) and motorcycles (n=10).
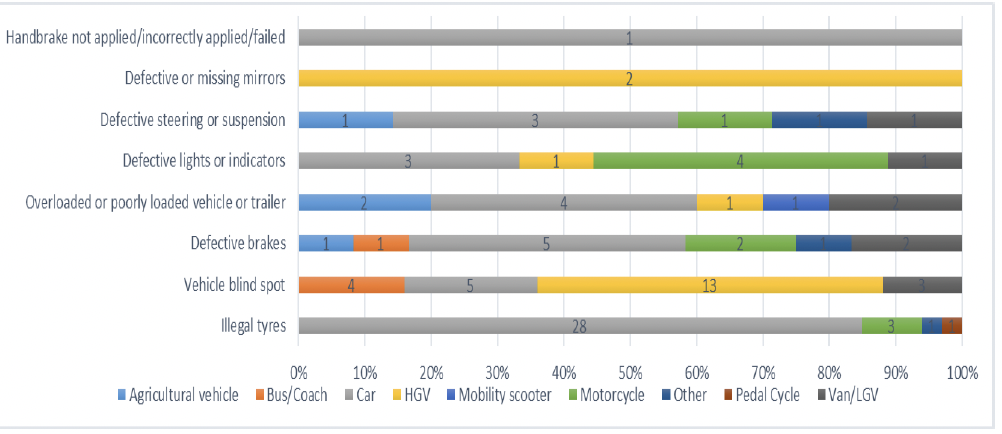
‘Vehicle blind spot’ is a notable issue amongst HGVs accounting for 13 of 25 instances (52%) where this was assigned; 92% (n=12) of collisions relating to an HGV’s blind spot resulted in a pedestrian fatality.
In these collisions, the VRU had not been seen by the HGV driver due to the design of the larger vehicle. Nearly half (46%, n=6) of fatal collisions where an HGV blind spot was a recognised CF were in Aberdeen City and City of Edinburgh.
Pedestrians and HGVs are likely to be in closer proximity in built up, urban areas, including these cities. (Recommendation 11)
Illegal Tyres
‘Illegal tyres’ were found to be a CF for 28 cars.
61% of collisions with ‘Illegal tyres’ (n=20 of 33 collisions) occurred across spring (March-May) and summer (June-August). This may suggest drivers are more cognisant of tyre maintenance in autumn and winter months when weather is less favourable, but during spring and summer this becomes less of a concern. This may also be a result of successful campaigns that remind drivers to ensure their vehicles are ready for winter.
Nearly a quarter, (n=4) of these spring and summer collisions were in North East Division in Aberdeenshire (Aboyne, Upper Deeside and Donside; Mid Formartine) and Moray (Speyside Glenlivet).This may present an opportunity for locally focused action. (Recommendations 47, 50)
4.4 Road Contributory Factors
Figure 32 illustrates all ‘Road’ CFs assigned to fatal collisions. ‘Road layout’ was the most-frequently applied.
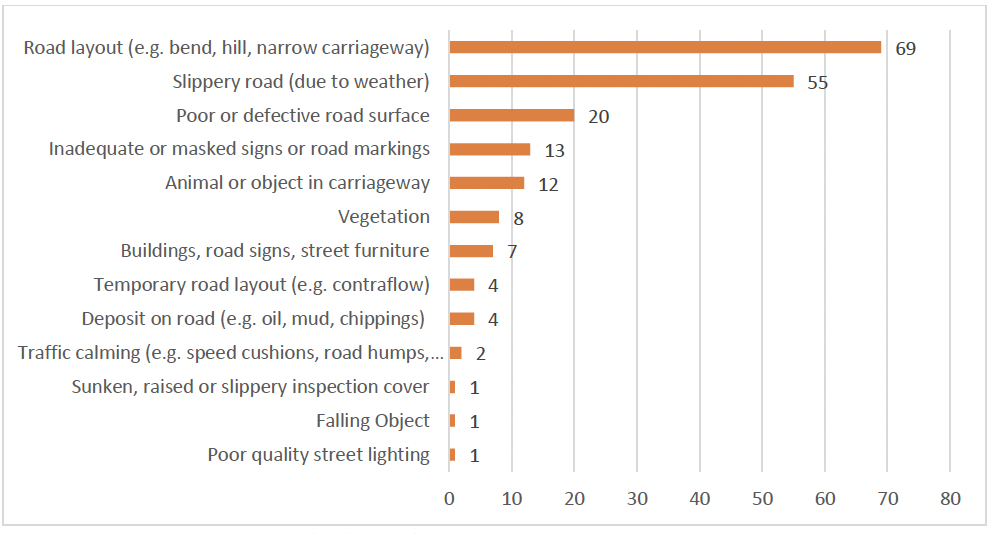
This was in instances when the physical road environment contributed (e.g. a sharp bend) or when a drivers vision was affected by the layout (e.g. a blind summit restricted views of oncoming vehicles). ‘Slippery road (due to weather)’ was also found to be a common ‘Road’ factor.
88 of the 197 assigned ‘Road’ CFs (45%) were assigned to collisions which occurred in the North of Scotland. This may be largely attributable to the topography in these areas which are known to have many bends and hills for drivers to navigate.
‘Animal or object in the carriageway’ related primarily to deer. Drivers had struck or swerved to avoid the deer and subsequently lost control.
One collision involved a pedal cyclist and a deer.
Collisions involving deer occurred in Highland (n=3), Argyll and Bute (n=1) and South Lanarkshire (n=1).
Vegetation related to a driver/rider’s view being obstructed by vegetation including overgrown side verges and hedges, overhanging branches, large hedges and trees. 88% (n=7) of these collisions occurred in the North of Scotland in Aberdeenshire, Moray and Highland.
In three collisions involving ‘Inadequate or masked signs or road markings’, the ‘Give Way’ road markings were in a poor state of repair or not visible and this was identified as a potential CF. Two of these occurred in the Highland area.
4.4 Contributory Factors And Vehicle Type
67% of all CFs were applied to cars. 15% were applied to motorcycles. Given that motorcycles account for around 2% of vehicles on the road, the high proportion of CFs attributed to them is disproportionate.
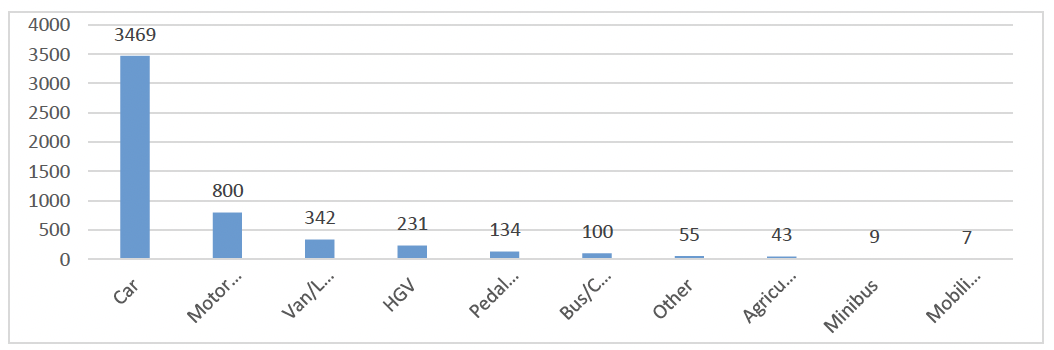
Figure 34 (below) shows the proportion of ‘People’, ‘Vehicle’ and ‘Road’ CFs assigned to each vehicle type. This highlights some slight differences in the CFs assigned to different vehicle types. For example, 8% of all CFs assigned to pedal cyclists related to ‘Road’. This compares to 4% for cars and 4% for motorcycles. Additionally, 9% of agricultural vehicle and 7% of HGV CFs related to ‘Vehicle’ compared with 1% for cars and 1% for motorcycles.
4.5 Age
Younger Drivers - People Contributory Factors
It is clear there is a link between a lack of driving experience, age and fault for collisions, and this merits further exploration. ‘People’ CFs relating to both a lack of driving experience and risk-taking behaviours are most prevalent amongst drivers aged 16-25.
These include:
- Distraction in vehicle
- Distraction outside vehicle
- Travelling too fast for conditions
- Learner or inexperienced driver/rider
- Unfamiliar with model of vehicle
- Following too close
- Racing
- Stolen vehicle
- Failed to signal or misleading signal
- Not displaying lights at night or in poor disability
- Involved in police pursuit
A high level of risk is often associated with young drivers due to a combination of both youth and inexperience. Less driving experience may result in a reduced ability to identify and react to hazards and increased risk-taking behaviour, such as speeding, is often associated with youth and cognitive maturity[32].
Inexperienced Drivers
35 drivers had less than 2 years driving experience, all of whom were deemed to be at fault to some extent for fatal collisions. Inexperience was deemed to be a CF for nearly 75% of these.
The majority (58%, n=21) of these inexperienced drivers were aged 16-25 and a further 23% (n=8) were aged 26-35. Perhaps not unexpectedly since these age groups will have the largest numbers of new drivers amongst them. However, it can be argued that a driver’s cognitive maturity can also have a significant impact[33].
The pre-frontal cortex of the brain plays an important role in regulating impulsive behaviour and the ability to anticipate the consequences of behaviour. The pre-frontal cortex does not reach full maturity until people are at least in their mid-20s[34].
Furthermore, the limbic region, which is associated with emotional responses is over-active between the ages of 15-24. Increased limbic activity means young people are more easily influenced by their peers and are more likely to indulge in risky behaviour.
The impact of inexperience highlights there may be a need to improve the training offered to new drivers to equip them with the skills to deal with various scenarios as and when they arise. At present, there is no requirement to undertake any further training with a licenced instructor which may result in discrepancies in training standards.
Speed
Factors pertaining to speed were noted to be prevalent amongst younger drivers.
32% (n=66 of 204) of those assigned ‘Exceeding speed limit’ were aged 16-25 as were 29% (n=62 of 208) of those assigned ‘Travelling too fast for conditions’. While the two both relate to speed, there are differences which require different approaches to tackle the issue.
‘Exceeding speed limit’ relates to a driver driving too fast and disobeying the posted speed limits either through choice or inattention. Countermeasures to tackle this will be discussed in more detail later in this report however they include enforcement/high-visibility patrols, Intelligent Speed Assist (ISA) and improved education/training.
‘Travelling too fast for conditions’ does not necessarily mean that the driver was exceeding the posted speed limit, but rather the speed at which they were travelling was not adjusted to account for external conditions such as rain or snow, or while negotiating a bend.
This is often a result of lack of experience of driving in such conditions and lack of awareness of how to alter driving behaviour appropriately.
Improved driver training and increased driving experience for younger drivers is required to enhance driving skills and abilities.
Further training
Ensuring novice drivers undertake many hours of supervised on-road driving has proven to be effective in a number of European countries[35].
Drivers may develop safer habits during this supervision including seatbelt wearing, adhering to speed limits and developing enhanced skills around scanning and anticipation of other road users.
Supervised training is likely to extend the length of time before a driver obtains a full licence and, therefore, they will be older when they are able to drive independently.
It is estimated increasing driving age by just one year is likely to produce a 5-10% reduction in the crash rate for the first year or driving[36].
Progressive Licensing Regimes combine extensive driver training with a phased approach to driving. This includes restricting the times at which young/new drivers can drive, limitations on passenger numbers and zero alcohol tolerance[37].
This approach has been successful in reducing young driver crashes when implemented in countries around the world (USA, Canada, Australia and others)[38]. (Recommendations 29, 40, 41)
Younger Passenger Fatalities
As highlighted earlier, passengers aged 16-25 were significantly more likely to be killed in a vehicle driven by someone in the same age group (n=31 passenger fatalities). Of these 31 fatalities, a third (n=10) of these 16-25 year-old passenger fatalities occurred between midnight and 5am, primarily on Saturday (n=4) or Sunday (n=3) mornings.
20 of these involved speeding, 10 involved impairment by alcohol and 10 impairment by drugs.[39] 24 had ‘Distraction within vehicle’ as a possible CF linked largely to the presence of young passengers within the vehicle.
Research by Brake[40] has shown younger drivers are more susceptible to peer pressure which can encourage bad driving and risk-taking behaviour and newly qualified drivers with a car full of passengers of a similar age are four times more likely to be in a fatal crash, compared with driving alone. When carrying older adult passengers, young drivers are less likely to crash.
This suggests passenger age, peer pressure and the distraction of younger passengers increases the risk.[41] (Recommendation 28)
Vehicle Contributory Factors
Vehicle CFs were noted to be high amongst younger drivers.
Almost half (48%, n=16) of instances where ‘Illegal tyres’ were deemed to have contributed to the collision involved drivers aged 16-25. These included issues with tyre tread, pressure and size.
These collisions occurred most frequently in Aberdeenshire, Glasgow City and Dumfries & Galloway.
Drivers aged 16-25 were also responsible for 33% (n=4 of 12) of ‘Defective brakes’ and 29% (n=2 of 7) ‘Defective steering or suspension’ as well as 22% (n=2 of 9) ‘Defective lights or indicators’. Therefore, it is strongly recommended
there is an improvement in driver awareness, education and training for younger drivers regarding vehicle maintenance.
Improved awareness and development of good practice around vehicle maintenance would arguably have knock-on effects for slightly-older drivers.
Those aged 26-35 were responsible for 18% of all ‘Vehicle’ contributory factors including 43% (n=3 of 7) of ‘Defective steering or suspension’ and 33% (n=4 of 12) ‘Defective brakes’. Furthermore, those aged 46-55 accounted for 24% of all ‘Vehicle’ CF assignment.
There is a clear need for improved vehicle maintenance across a range of age groups - however, implementing training, good practice and good habits at the earliest stage of driving could positively impact on all drivers. (Recommendations 51, 58)
Road Contributory Factors
45% (n=88 of 198) of all ‘Road’ CFs were attributed to drivers aged 16-35 (21% aged 16-25 and 24% aged 26-35, 41 and 47 CFs respectively).
The top ‘Road’ CF amongst younger drivers (16-25) was ‘Slippery road’ (due to weather) accounting for 20 CFs. This indicates again there is a relationship between a lack of driving experience and an inability to adapt driving appropriately to relevant conditions.
Older Drivers
There was a number of ‘People’ CFs assigned most frequently to older drivers (those aged over 65). These are:
- Illness or disability, mental or physical
- Disobeyed Give Way or Stop Sign markings
- Junction overshoot
- Dazzling headlights
- Uncorrected/defective eyesight
These CFs relate largely to health and eyesight issues as well as potentially delayed reaction times.
Illness/Disability
A further interrogation of the collisions where ‘Illness or disability, mental or physical’ was recorded found that, in most cases, the older driver had, for an unknown reason, lost control of the vehicle, leaving the road or crossing over in to the path of an oncoming vehicle. As the reason for their deviation from the road is unknown, the possibility of a medical episode prior to the collision has been considered and duly recorded.
Any confirmed medical episodes would be recorded as medical deaths, not reportable road deaths and, therefore, are not captured within the scope of this project.
A review of the fatal collisions involving ‘Illness or disability, mental or physical’ for over 65s identified a number of occasions where issues with stricter licensing practices may have impacted.
On two occasions, the drivers’ licences had been revoked on medical grounds as they were deemed unfit to drive.
In a further three instances, the drivers had reported medical issues to the DVLA but, following investigations by DVLA medical team, they were deemed fit to drive. (Recommendation 36)
Whilst the legal responsibility to alert the DVLA of relevant medical conditions lies with the driver, doctors are encouraged to disclose relevant information if a patient is unfit to drive but continues to do so.
The absence of any legal responsibility and the existence of doctor-patient confidentiality means reporting on fitness to drive is not absolute.
While General Medical Council guidance is clear that public safety should take priority over patient confidentiality[42], at present it remains only guidance. Establishing a legal responsibility on medical professionals to report to the DVLA may remove the risk of some unfit drivers continuing to be on the roads. (Recommendation 37)
In three instances, the drivers had been complaining to family members of feeling unwell in the days/weeks/months prior to the fatal collision. This included periods of confusion and disorientation.
People must feel encouraged and supported to have difficult discussions with older people around their fitness to drive and to act where necessary.
A study by Transport Scotland in 2020 found family members did not respond positively when they felt road safety campaigns and messages placed the burden on them to have these discussions.[43]
Therefore, there needs to be a balance between providing people with the tools to feel empowered to engage with older drivers but without making it solely their responsibility. This could be mitigated by the introduction of some form of mandatory cognitive assessment when licence renewal is required at 70.
Current licensing requirements mean drivers must reapply for their driving licence when they reach the age of 70 and every 3 years thereafter.
There is no requirement for any medical assessment, and renewal is reliant on the information provided by the driver.
By way of contrast, in Japan, mandatory cognitive tests for over 70s forms part of the licence renewal process. The cognitive test involves testing hazard perception, eyesight, reaction speeds and knowledge of road laws. As a result, Japan has seen a significant reduction in older drivers at fault collisions resulting in death[44].
This reduction will be a combination of some older drivers surrendering their licences as a result of failing the assessment or surrendering their licence because they did not wish to take the mandatory test. Nevertheless, this has resulted in a number of potentially unfit older drivers no longer being on the road. (Recommendation 42)
Currently in the UK, drivers requiring a Group 2 bus or lorry licence must renew this at 45 years old through a D4 Medical Examination Report.
A D4 will be needed every 5 years until the driver is 65 when one will be required annually[45]. Under this process, drivers must see a registered doctor to have their blood pressure and eyesight checked (the eyesight test can also be undertaken by a registered optician) and complete a questionnaire on their medical history[46].
This highlights an efficient and necessary process that could be replicated for older drivers. (Recommendations 6, 7, 45)
Eyesight
83% (n=5 of 6) of drivers who were found to have ‘Uncorrected/defective eyesight’ were over 65. The majority of those who survived the collision failed the roadside eyesight test afterwards.
Although an argument can be made that reading letters and numbers is different to observing the moving shapes of other road users, it cannot be ignored that the eyesight of these drivers at fault was deemed to be below the required driving standard.
As is the case with GPs, opticians do not have a legal responsibility to notify the DVLA of a patient’s fitness to drive and only guidance on prioritising public safety is available[47]. (Recommendation 43, 44)
Services such as DriveAbility Scotland exist where drivers are able to self-refer and undertake driving assessments which include cognitive assessments and eyesight checks alongside practical driving exercises[48].
An instructor will provide the driver with feedback following the assessment.
The outcome is advisory only and will not result in a loss of licence.
In the absence of mandatory cognitive assessments and eyesight checks for older drivers, it will be beneficial to encourage voluntary uptake of such driving assessments.
Humberside Police is currently piloting a project where direct referrals from police are submitted to similar organisations in place of immediate revocation of a driver’s licence or prosecution. The findings from this project, when available, could be reviewed to assess suitability for implementation of a similar approach in Scotland. (Recommendations 5, 26)
Cassie’s law came into effect in February 2013 after Cassie McCord was killed on her way to school by an 87 year-old driver just three days after he failed an eyesight test and refused to surrender his licence.
Cassie’s Law allows the Police to notify the DVLA electronically utilising a D751E form with details of an eyesight test failure. A notice of revocation of the licence can be issued to the driver within hours.
Police Scotland was responsible for 6% of all D751Es submitted between 2013 and 2020 (4th highest number submitted by any UK police force).
Sussex Police, with a population about a fifth of the size of Scotland, submitted more than twice as many D751Es over the same period.
This highlights that, while many officers will be aware of, and utilising, the procedure within Police Scotland, there is more could be done to increase awareness amongst officers.
Knowing the procedure as ‘Cassie’s law’, and remembering the story that led to its introduction, may make it more memorable and increase its implementation. (Recommendations 23, 24)
Driving often provides a sense of independence for older drivers and may prevent isolation, particularly for older people residing in more rural areas. It is imperative, therefore, that any discussions around the potential removal of licences bares this in mind and steps are taken to ensure older people are not negatively affected as a result.
This will include ensuring alternative, attractive, accessible and affordable methods of travel are available.
4.6 Additional Findings
Foreign Drivers
70 foreign drivers were involved in 64 fatal collisions.[49] 74% of these drivers were deemed to be at fault.
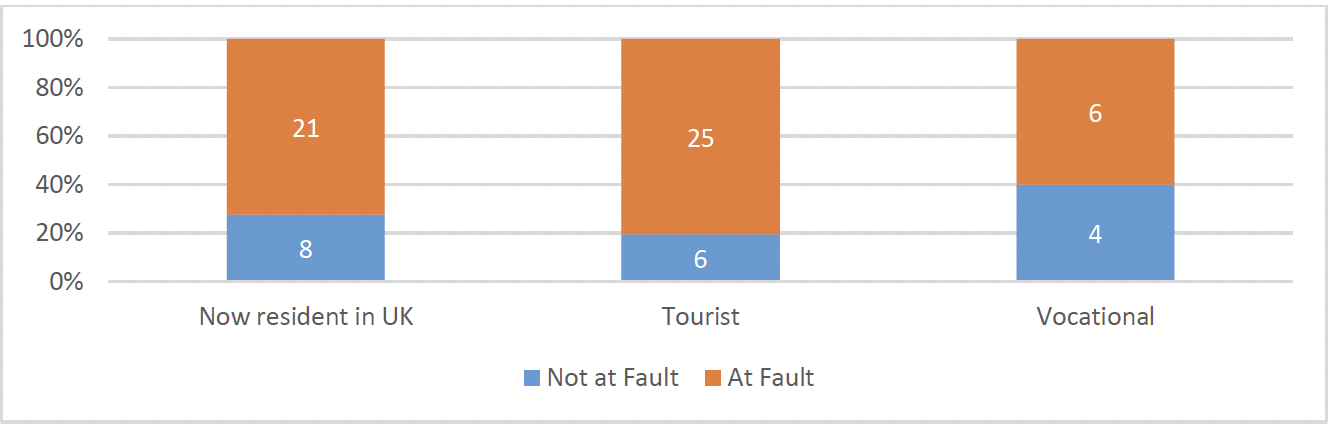
Figure 36 shows the proportion of foreign drivers deemed to be at fault.
81% of tourists were at fault as were 60% of vocational foreign drivers. 72% of foreign drivers now resident in the UK were drivers at fault.
Foreign Drivers Now Resident in the UK
Foreign drivers now resident in the UK are recorded as those who have home addresses in the UK but were driving on a licence issued by another country. 42% (n=12 of 29) of this group were driving on Polish licences.
One driver had converted to a UK licence from a foreign licence one year prior to the collision.
Polish is the most common non-British nationality in Scotland[50] and, therefore, there is likely to be a large number of Polish nationals on Scottish roads, thus increasing the likelihood they would become involved in a collision.
Only 19% (n=4 of 21) of at fault drivers now resident in the UK had ‘Inexperience of driving on the left’ assigned as a CF. This indicates that, in the majority of cases, driving in Scotland on a foreign licence does not appear to be linked to a lack of understanding of Scottish road layouts.
The top CFs for this group are largely the same as those for the general cohort including ‘Careless, reckless or in a hurry’.
Tourists
The majority of tourists at fault were male (84%, n=21 of 25) and aged over 26 (92%). Nearly a quarter (24%, n=6) were aged 26-35. 28% (n=7) of all tourists at fault were visiting from Germany. A further 16% (n=4) were from France.
84% (n=21) of tourists were assigned ‘Inexperience of driving on the left’. This was the most frequently assigned CF for this group highlighting that misunderstanding and confusion around road layouts was a significant factor in collisions involving tourists.
In many of these, the driver had been travelling on the wrong side of the road resulting in a head-on collision with oncoming traffic.
In a number of other collisions, the tourist failed to give way to vehicles when joining another road, possibly due to a misunderstanding of the road layout and/or signage and confusion around vehicles travelling in a different direction than they are used to.
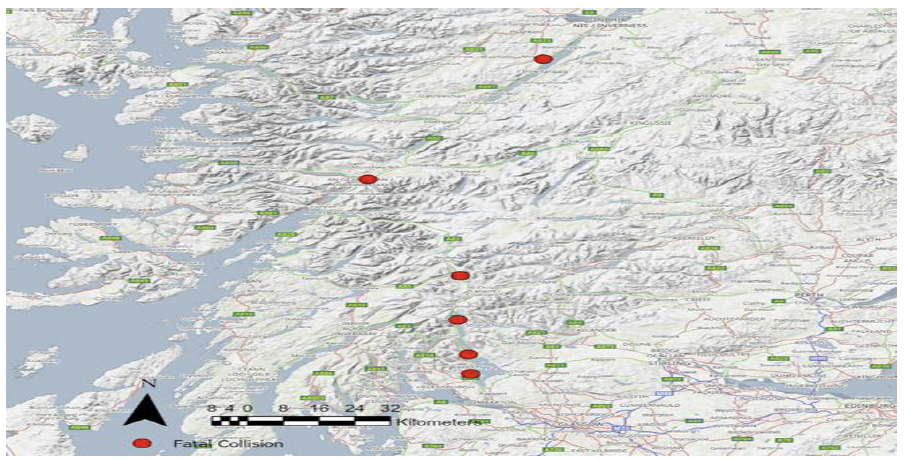
More than a quarter (29%, n=6) of collisions resulting from ‘Inexperience of driving on the left’ occurred on the A82, with four on the roughly 40-mile stretch of road between Arden, Alexandria and Bridge of Orchy (see Map 7).
The majority of other factors assigned to tourists are similar to those recorded for UK drivers including ‘Failed to look properly’ and ‘Poor turn or manoeuvre’.
Of note, 40% of tourist at fault collisions involved ‘distraction outside vehicle’. Although in most cases, distraction is provided only as a possible factor when reasons for other CFs such as loss of control or failing to look are unknown, it may be the case that the tourists became distracted by their surroundings when travelling in unfamiliar and often picturesque locations.
The majority of tourists at fault were driving hire cars (68%, n=17).This indicates that a number of tourists travel in their own vehicles when in Scotland. (Recommendations 15, 16, 17, 18, 31, 32, 65, 69, 70)
Alcohol And Drug Impairment
Driver/rider impairment by alcohol was a factor in 45 fatal collisions and impairment by drugs in 48. Impairment by both alcohol and drugs was a factor in a further 34 fatal collisions.
Blood analysis was available for 22 drivers who were impaired by alcohol. Of these, more than half (55%, n=12) were found to be more than four times the current legal limit. Blood analysis also detected the presence of various drugs including Cocaine, Methadone, Cannabis, Diazepam and Etizolam amongst drivers impaired by drugs.
Impairment is markedly more frequent amongst younger drivers with 63% (n=102 of 161) of these CFs assigned to drivers aged 16-35 (35% aged 26-35 and a further 29% aged 16-25). As previously highlighted, younger drivers are associated with higher levels of risk-taking behaviour, including drink-driving.
For drivers aged 16-25, impairment was significantly more likely on a Saturday and Sunday (28%, n=13 and 33%, n=15 respectively) and for those aged 26-35 on a Saturday (41%, n=23 of 56).
Just under half (48%, n=11 of 23) these collisions occurred between the hours of 10pm and 6am. Collisions with these characteristics were most prevalent in the North and West of Scotland, particularly in Aberdeenshire, Moray, Highland, Orkney, East Ayrshire and South Ayrshire.
Of the 77 drivers found to have been ‘Impaired by alcohol’, criminal history was available for 17 of them[51].
There was evidence of drivers having previous convictions for drink-driving. Therefore, there may have been opportunities for interventions to prevent them from driving a vehicle while impaired on further occasions, which ultimately resulted in a fatal collision.
Alco-lock technology[52] has been identified as a very effective technology for preventing driving when alcohol is detected.
Under the EU’s Vehicle General Safety Regulation, all new cars from 2022 will be built to enable the installation of an Alco-lock device. However, this does not make it mandatory for a device to be installed. (Recommendations 20, 27, 33)
Commuting And Travelling In The Course Of Employment
Driving is the most dangerous work activity most people will undertake and results in far more work-related accidental deaths than all other work activities[53]. Employers have a responsibility to ensure the safety of their employees when at work.
21% (n=325 of 1,516) of all drivers involved in fatal collisions were undertaking a ‘journey as part of work’. A further 9% (n=134) were ‘commuting to/from work’. This highlights that drivers travelling for employment purposes constituted a notable proportion of the drivers involved in fatal collisions.
95% of those undertaking a ‘journey as part of work’ were male, supporting previous literature[54] that males are more likely to have driving-related jobs.
18% (n=175 of 977) of drivers at fault were undertaking a ‘journey as part of work’.
Some notable CFs that were more prevalent amongst this group include ‘Vehicle blind spot’, ‘Overloaded or poorly loaded vehicle or trailer’, ‘Defective brakes’, ‘No banksman[55]’ and ‘Inadequate training for loading vehicle/driving with loaded vehicle’. This highlights poor vehicle maintenance alongside a lack of appropriate training and adherence to health and safety practices.
In order to identify any commonality or trends in the nature of employment, employee duties or companies involved, a review was carried out of drivers involved in fatal collisions whilst undertaking a ‘journey as part of work’. However, this failed to identify anything of note that would allow recommendations to be targeted at any specific companies or business types.
12% (n=13) of those assigned ‘Illness or disability, mental or physical’ were travelling in the course of their employment.
In one case, the driver had a history of health-related incidents, including whilst driving. The driver had sought medical advice regarding this and adhered to all medical advice given to them by medical professionals who had followed DVLA guidelines. Both DVLA and their employer were aware and as a result, mitigations were put in place, they were driving smaller vehicles than they would have previously.
Nevertheless, given medical investigations were still underway into the underlying condition, perhaps more could have been done by the employer and the DVLA to prevent driving until investigations were complete.
9% (n=92) of drivers at fault were commuting to/from work. The top CFs for these drivers were the same as the overall cohort including ‘Careless, reckless or in a hurry’ and ‘Loss of control’.
The Scottish Occupational Road Safety Alliance (ScORSA) assists small to medium sized businesses with developing traffic management processes and systems, providing guidance on how to keep their workforce safe[56].
Membership of this organisation is free and members have access to various resources, networking opportunities and mentoring schemes.
Membership should be encouraged and promoted to increase awareness among companies and reduce the risks for professional drivers. (Recommendation 52)
Seatbelt Use
Of the 520[57] fatalities in a vehicle in which seatbelt use is required or recommended:
- 21% (n=107) were not wearing a seatbelt
- 72% were wearing a seatbelt
- 7% were recorded as ‘Unknown’[58].
While adherence to the law requiring vehicle occupants to wear seatbelts was generally high, it is clear many drivers and passengers still chose not to utilise this simple but effective safety measure.
Not wearing a seatbelt was seen most frequently amongst young fatalities, particularly young males. Those aged 16-25 accounted for 20% (n=21) followed by those aged 26-35 and 36-45 (both 17%, n=18).
They were also more likely to have home postcodes in more socially-deprived areas.
Therefore, although seatbelt wearing rates were good overall, there is more that could be done particularly targeting young people from more socially-deprived areas to further increase wearing rates.
Two child fatalities were not wearing a seatbelt. It should be borne in mind that it is the responsibility of drivers to ensure any child under 14 is secured by seatbelt or suitable child restraint. (Recommendation 21)
Age and size appropriate child seats are imperative in reducing the risk of injury to children. Those responsible for young children should be fully-informed on appropriate child restraints. (Recommendations 48, 49, 53, 54)
Use Of Helmets
Cyclists - 44 cyclists were fatally injured, of which 39% (n=17) were not wearing a cycle helmet. Nine of these were recorded as suffering head injuries. Whilst it would not have prevented the collision, wearing a helmet could have potentially protected this area and reduced the severity of injury, thus preventing the fatality.
The remaining eight who were not wearing a helmet died from multiple injuries and, therefore, the impact which a helmet may have made is inconclusive.
Although female cyclists were significantly less likely to be fatally injured than male cyclists, they were slightly less likely to have been wearing a helmet (43%, n=3 of 7 females compared with 41%, n=15 of 37 males were not wearing a helmet). Studies have found that females may be less likely to wear helmets as they feel they are slow riders or skilful riders and therefore do not require one[59].
It is argued that wearing a helmet makes little difference to overall cycling safety.
Countries with mandatory helmet laws, or high levels of helmet usage, show no reduction in head injuries compared to countries or areas without these laws[60]
Good quality infrastructure has a greater impact on safety than personal protective equipment. Any mandatory helmet use may have a negative impact and discourage people from cycling and have further ramifications for health and fitness[61].
Nevertheless, Scotland’s infrastructure for cycling is currently not fit for purpose and there is significant work to be done to make roads more accessible and safer for cyclists. Helmet use is likely to be beneficial and should be strongly encouraged. (Recommendation 34)
Motorcyclists
161 motorcyclists (151 riders and 10 passengers) were killed. Only 5 were not wearing a helmet. This highlighted high levels of helmet use amongst motorcyclists. All of those not wearing a helmet were male and 60% (n=3) were younger than 25; one rider was aged 14 and two aged 23. (Recommendation 9)
Mobile Phone Usage
The dangers of driving while using a mobile phone are well known; they provide a huge source of distraction and require drivers to take their eyes away from the road. Even a momentary distraction can be catastrophic.
A driver using a mobile phone was deemed to be a factor in 24 fatal collisions. Those aged 26-35 were found to be the most frequent offenders, accounting for 38% (n=9) and a further 25% (n=6) were aged 16-25. 29% (n=7) were aged 36-45 showing that mobile phone use is not solely a young driver’s issue.
Males were significantly more likely to have been using a mobile phone.
Mobile phones and technology are an intrinsic part of daily life, particularly for young people. Studies have found around a third of young people aged 18-30 have reported symptoms of smartphone addiction[62].
Young people continue to be heavily reliant on their smartphones and this coupled with the previously discussed risk-taking behaviour more commonly seen amongst younger drivers, means it is likely mobile phone usage while driving will continue to be a problem.
Therefore, there needs to be continued awareness raising about the dangers of mobile phone use.
Recent legislation changes have seen rules on mobile phone usage tightened, meaning it is now illegal for drivers to use a handheld mobile phone under virtually any circumstances while driving. It is hoped this will act as a further deterrent for drivers and prevent them from being distracted unnecessarily. (Recommendations 2, 22)
Excessive Speed
‘Exceeding the speed limit’ or ‘Driving too fast for conditions’ were contributing factors in 36% of all fatal collisions (n=322 of 903).
As previously reported, younger drivers are prominent, with 15-25 year-olds assigned a CF in 31% (n=101 of 322) of collisions. 26-35 year-olds accounted for a further 27% (n=86).
Collisions occurred throughout the day, peaking between the hours of 15:00 and 18:00 (21%, n=68).There were higher numbers of collisions during summer (n=98) and spring (n=83), with the peak month being July (n=38).
There was little year-to-year variation with the number of collisions ranging from 50 to 63, with the exception of 2015 which recorded only 38 fatal collisions where excessive speed was a contributing factor.
The majority of collisions occurred on single carriageway roads (86%, n=277). In terms of speed limit, collisions on roads with a 60mph limit were most frequent (64%, n=205).
Scottish Index Of Multiple Deprivation (SIMD) [63][64]
There is no strong correlation between deprivation and the likelihood of being involved in or at fault for a fatal collision. There may, however, be a link between some CFs and deprivation.
Drivers involved in fatalities, with home postcodes in the most deprived areas in Scotland, were twice as likely to have been impaired by alcohol and/or drugs as those from the least deprived areas. This confirms a previously established link between social deprivation, alcohol use and abuse, and drink driving[65].
This issue cannot be resolved solely by police enforcement or vehicular technology such as an Alco-lock. It requires a much wider public health approach to tackle the root causes of social deprivation and related inequalities.
A number of other CFs associated with risk-taking behaviour including ‘Exceeding speed limit’, ‘Aggressive driving’, ‘Racing’, and ‘Vehicle in the course of crime’ which were also notably more frequent amongst drivers from more deprived areas.
Fatalities with home postcodes in the more socially deprived areas were also twice as likely not to have been wearing a seatbelt than those from the least socially deprived areas. ‘Fatigue’ and ‘Illness or disability, mental or physical’ were noted to be higher amongst drivers from less deprived areas.