8. Progress towards the casualty reduction targets for 2020 (Tables 5-9)
Key Reported Road Casualties Scotland 2016
8. Progress towards the casualty reduction targets for 2020 (Tables 5-9)
8.1 The following section provides information on the progress made towards each of the casualty reduction targets set out in Scotland's Road Safety Framework to 2020 (see section 11.5 for more information about the Framework).
8.2 Progress is assessed towards a milestone in 2015 and the final target by means of an indicative trend based on a constant annual percentage reduction (see section 11.6 for more information). Detailed tables for each of the targets, including a breakdown by mode and historic data are included in Tables 5 to 9.
Target: 40% reduction in those killed by 2020
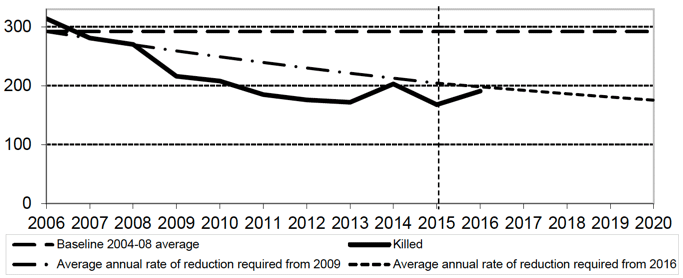
8.3 There were 191 people killed in 2016, a 35% reduction since the 2004-08 baseline average. The decrease seen to 2016 is less than that required to achieve the 2020 milestone reduction (40%). Figure 4 shows that the total number of fatalities in 2016 was below the indicative line required to achieve the target [Table 5].
Figure 4: Progress to casualty reduction target: Casualties killed

Target: 55% reduction in those seriously injured by 2020
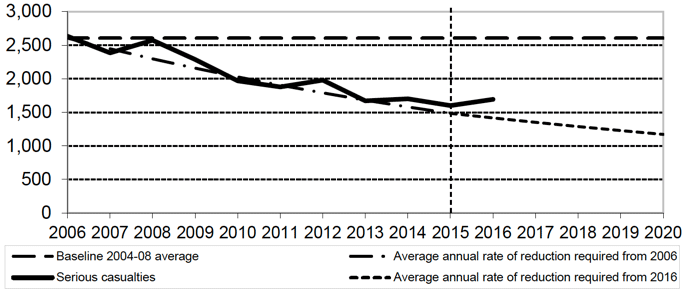
8.4 There were 1,693 serious injuries in 2016, a 35% reduction since the 2004-08 baseline level. The decrease seen to 2016 has not yet reached the framework target for 2020 (a reduction of 55% from 2004-08) [Table 6].
Figure 5: Progress to casualty reduction target: Seriously injured casualties

Target: 50% reduction in children killed by 2020
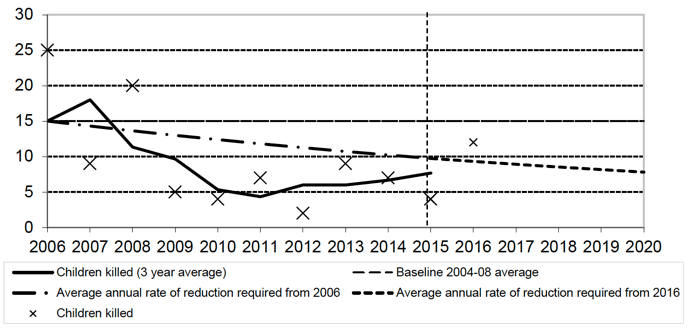
8.5 Due to small numbers and year-to-year fluctuations this target is measured using a three year average. An average of 8 children a year were killed in the 2014-2016 period, a 50% reduction since the 2004-2008 baseline. The current reduction seen to 2016 is the same as that required by the 2020 target [Table 7].
Figure 6: Progress to casualty reduction target: Children killed

Target: 65% reduction in children seriously injured by 2020
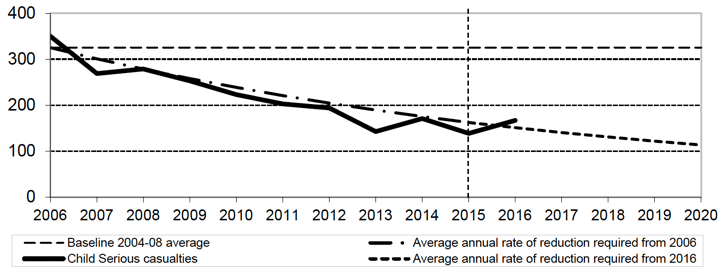
8.6 167 children recorded as seriously injured in 2016, a 49% reduction since the 2004-08 baseline. The decrease to 2016 is less than that required to achieve the 2020 milestone reduction (65%) [Table 8].
Figure 7: Progress to casualty reduction target: Children seriously injured

Target: 10% reduction in slight casualties by 2020 (per 100 million vehicle kilometres)
8.7 Table 9 shows that the 2016 slight casualty rate was 19.37 casualties per 100 million vehicle kilometres. This was a 40% reduction since the 2004-08 baseline and is therefore greater than the reduction required to achieve the 2020 target [Table 9].
| Pedestrian | Pedal cycle | Motor cycle | Car | Bus / coach | Goods1 | Other2 | All road users | |
| 1994-98 ave | 104 | 11 | 31 | 209 | 3 | 15 | 5 | 378 |
| 1994 | 111 | 5 | 24 | 197 | 9 | 14 | 3 | 363 |
| 1995 | 121 | 11 | 33 | 221 | 1 | 19 | 3 | 409 |
| 1996 | 106 | 15 | 29 | 185 | 3 | 14 | 5 | 357 |
| 1997 | 87 | 9 | 37 | 219 | 2 | 16 | 7 | 377 |
| 1998 | 96 | 13 | 33 | 223 | 1 | 13 | 6 | 385 |
| 1999 | 89 | 8 | 30 | 169 | 1 | 11 | 2 | 310 |
| 2000 | 72 | 12 | 40 | 182 | 1 | 15 | 4 | 326 |
| 2001 | 76 | 10 | 49 | 194 | 0 | 14 | 5 | 348 |
| 2002 | 73 | 8 | 46 | 154 | 0 | 21 | 2 | 304 |
| 2003 | 63 | 14 | 50 | 189 | 1 | 14 | 5 | 336 |
| 2004 | 76 | 7 | 42 | 167 | 3 | 12 | 1 | 308 |
| 2005 | 66 | 16 | 34 | 153 | 0 | 15 | 2 | 286 |
| 2006 | 61 | 10 | 58 | 175 | 0 | 8 | 2 | 314 |
| 2007 | 60 | 4 | 40 | 160 | 0 | 15 | 2 | 281 |
| 2008 | 60 | 9 | 34 | 153 | 1 | 8 | 5 | 270 |
| 2009 | 47 | 5 | 43 | 116 | 0 | 5 | 0 | 216 |
| 2010 | 47 | 7 | 35 | 105 | 1 | 8 | 5 | 208 |
| 2011 | 43 | 7 | 33 | 89 | 1 | 9 | 3 | 185 |
| 2012 | 59 | 9 | 21 | 73 | 1 | 13 | 0 | 176 |
| 2013 | 38 | 13 | 23 | 89 | 2 | 5 | 2 | 172 |
| 2014 | 59 | 8 | 30 | 94 | 1 | 2 | 9 | 203 |
| 2015 | 44 | 5 | 27 | 75 | 1 | 13 | 3 | 168 |
| 2016 prov. | 32 | 8 | 30 | 106 | 3 | 6 | 6 | 191 |
| 2004-08 average | 65 | 9 | 42 | 162 | 1 | 12 | 2 | 292 |
| 2012-16 average | 46 | 9 | 26 | 87 | 2 | 8 | 4 | 182 |
| Numbers in 2016 | 44 | 6 | 28 | 110 | 1 | 8 | 2 | 198 |
| implied by target | ||||||||
| 2016 % change: | * | * | * | 41% | * | * | * | 14% |
| on 2015 | ||||||||
| on 04-08 ave | -50% | * | * | -34% | * | * | * | -35% |
* A percentage change is not shown if the denominator is 50 or fewer.
1. Light goods vehicles and heavy goods vehicles.
2. Taxis, minibuses and other modes of transport.
| Pedestrian | Pedal cycle | Motor cycle | Car | Bus / coach | Goods1 | Other2 | All road users | |
| 1994-98 ave | 1,272 | 238 | 324 | 2,292 | 93 | 156 | 84 | 4,460 |
| 1994 | 1,536 | 311 | 329 | 2,607 | 141 | 197 | 87 | 5,208 |
| 1995 | 1,466 | 281 | 362 | 2,432 | 104 | 192 | 93 | 4,930 |
| 1996 | 1,173 | 201 | 271 | 2,108 | 93 | 123 | 72 | 4,041 |
| 1997 | 1,124 | 201 | 321 | 2,146 | 53 | 120 | 82 | 4,047 |
| 1998 | 1,060 | 197 | 338 | 2,167 | 75 | 150 | 85 | 4,072 |
| 1999 | 1,054 | 181 | 401 | 1,835 | 82 | 133 | 79 | 3,765 |
| 2000 | 925 | 164 | 435 | 1,796 | 79 | 106 | 63 | 3,568 |
| 2001 | 842 | 161 | 405 | 1,758 | 62 | 115 | 67 | 3,410 |
| 2002 | 820 | 144 | 410 | 1,628 | 59 | 120 | 48 | 3,229 |
| 2003 | 712 | 125 | 367 | 1,511 | 69 | 114 | 59 | 2,957 |
| 2004 | 674 | 121 | 353 | 1,414 | 63 | 83 | 58 | 2,766 |
| 2005 | 677 | 116 | 371 | 1,304 | 63 | 83 | 52 | 2,666 |
| 2006 | 688 | 131 | 352 | 1,258 | 57 | 91 | 58 | 2,635 |
| 2007 | 594 | 147 | 381 | 1,110 | 33 | 87 | 33 | 2,385 |
| 2008 | 645 | 155 | 396 | 1,203 | 59 | 65 | 52 | 2,575 |
| 2009 | 509 | 152 | 332 | 1,135 | 36 | 73 | 50 | 2,287 |
| 2010 | 457 | 138 | 319 | 903 | 52 | 60 | 40 | 1,969 |
| 2011 | 515 | 156 | 293 | 758 | 51 | 63 | 44 | 1,880 |
| 2012 | 461 | 169 | 343 | 847 | 44 | 68 | 49 | 1,981 |
| 2013 | 403 | 149 | 281 | 720 | 34 | 45 | 39 | 1,671 |
| 2014 | 422 | 159 | 326 | 686 | 28 | 51 | 31 | 1,703 |
| 2015 | 424 | 164 | 257 | 639 | 49 | 46 | 21 | 1,600 |
| 2016 prov. | 397 | 147 | 268 | 758 | 42 | 55 | 26 | 1,693 |
| 2004-08 average | 656 | 134 | 371 | 1,258 | 55 | 82 | 51 | 2,605 |
| 2012-16 average | 421 | 158 | 295 | 730 | 39 | 53 | 33 | 1,730 |
| Numbers in 2016 | 374 | 76 | 211 | 717 | 31 | 47 | 29 | 1,485 |
| implied by target | ||||||||
| 2015 % change: | -6% | -10% | 4% | 19% | * | * | * | 6% |
| on 2015 | ||||||||
| on 04-08 ave | -39% | 10% | -28% | -40% | -24% | -33% | -49% | -35% |
* A percentage change is not shown if the denominator is 50 or fewer.
1. Light goods vehicles and heavy goods vehicles.
2. Taxis, minibuses and other modes of transport.
| Pedestrian | Pedal cycle | Motor cycle | Car | Bus / coach | Goods1 | Other2 | All road users | 3 year average3 | |
| 1994-98 ave | 17 | 3 | 0 | 8 | 1 | 0 | 0 | 30 | |
| 1994 | 18 | 4 | 1 | 10 | 4 | - | - | 37 | |
| 1995 | 16 | 3 | - | 11 | - | - | - | 30 | 31 |
| 1996 | 16 | 6 | 1 | 3 | 1 | - | - | 27 | 28 |
| 1997 | 15 | 1 | - | 9 | - | 1 | - | 26 | 28 |
| 1998 | 18 | 3 | - | 9 | 1 | - | 1 | 32 | 28 |
| 1999 | 17 | 1 | - | 6 | - | - | 1 | 25 | 26 |
| 2000 | 13 | 4 | - | 4 | - | - | - | 21 | 22 |
| 2001 | 14 | 4 | - | 2 | - | - | - | 20 | 18 |
| 2002 | 12 | - | - | 2 | - | - | - | 14 | 17 |
| 2003 | 5 | 2 | - | 10 | - | - | - | 17 | 14 |
| 2004 | 8 | - | 1 | 3 | - | - | - | 12 | 13 |
| 2005 | 5 | 4 | - | 1 | - | - | 1 | 11 | 16 |
| 2006 | 9 | 5 | - | 10 | - | 1 | - | 25 | 15 |
| 2007 | 4 | 1 | - | 4 | - | - | - | 9 | 18 |
| 2008 | 4 | 2 | 1 | 13 | - | - | - | 20 | 11 |
| 2009 | 1 | 1 | - | 3 | - | - | - | 5 | 10 |
| 2010 | 1 | 1 | 1 | 1 | - | - | - | 4 | 5 |
| 2011 | 2 | - | - | 5 | - | - | - | 7 | 4 |
| 2012 | 1 | 1 | - | - | - | - | - | 2 | 6 |
| 2013 | 5 | 2 | - | 2 | - | - | - | 9 | 6 |
| 2014 | 3 | - | - | 4 | - | - | - | 7 | 7 |
| 2015 | 3 | 1 | - | - | - | - | - | 4 | 8 |
| 2016 prov. | 3 | 1 | 1 | 7 | - | - | - | 12 | |
| 2004-08 average | 6 | 2 | 0 | 6 | - | 0 | 0 | 15 | |
| 2012-16 average | 3 | 1 | 0 | 3 | - | - | - | 7 | |
| 2014-16 average | 8 | ||||||||
| 2014-16 avg % change | |||||||||
| on 04-08 ave | -50% | ||||||||
1. Light goods vehicles and heavy goods vehicles.
2. Taxis, minibuses and other modes of transport.
3. All averages rounded to whole percentages.
| Pedestrian | Pedal cycle | Motor cycle | Car | Bus / coach | Goods1 | Other2 | All road users | |
| 1994-98 ave | 546 | 96 | 5 | 136 | 10 | 8 | 10 | 812 |
| 1994 | 656 | 140 | 5 | 151 | 20 | 12 | 8 | 992 |
| 1995 | 622 | 110 | 7 | 142 | 9 | 13 | 17 | 920 |
| 1996 | 524 | 94 | 3 | 115 | 14 | 3 | 10 | 763 |
| 1997 | 490 | 77 | 4 | 129 | 3 | 6 | 10 | 719 |
| 1998 | 437 | 61 | 8 | 144 | 5 | 6 | 5 | 666 |
| 1999 | 413 | 68 | 5 | 102 | 2 | 2 | 8 | 600 |
| 2000 | 365 | 61 | 7 | 90 | 7 | 5 | 5 | 540 |
| 2001 | 339 | 52 | 7 | 108 | 5 | 6 | 7 | 524 |
| 2002 | 328 | 46 | 7 | 109 | 9 | 7 | 7 | 513 |
| 2003 | 268 | 46 | 5 | 83 | 5 | 2 | 6 | 415 |
| 2004 | 239 | 40 | 9 | 74 | 3 | 3 | 4 | 372 |
| 2005 | 239 | 26 | 11 | 67 | 6 | 2 | 5 | 356 |
| 2006 | 239 | 35 | 10 | 60 | 4 | 0 | 2 | 350 |
| 2007 | 181 | 28 | 4 | 51 | 1 | 1 | 3 | 269 |
| 2008 | 194 | 18 | 5 | 56 | 2 | 1 | 3 | 279 |
| 2009 | 155 | 26 | 2 | 62 | 2 | 1 | 5 | 253 |
| 2010 | 150 | 23 | 3 | 40 | 7 | 0 | 0 | 223 |
| 2011 | 139 | 23 | 2 | 34 | 4 | 0 | 1 | 203 |
| 2012 | 132 | 21 | 1 | 34 | 1 | 5 | 0 | 194 |
| 2013 | 92 | 11 | 1 | 34 | 3 | 0 | 2 | 143 |
| 2014 | 116 | 18 | 4 | 27 | 2 | 1 | 3 | 171 |
| 2015 | 97 | 11 | 1 | 27 | 2 | 0 | 1 | 139 |
| 2016 prov. | 105 | 8 | 4 | 46 | 2 | 2 | 0 | 167 |
| 2004-08 average | 218 | 29 | 8 | 62 | 3 | 1 | 3 | 325 |
| 2012-16 average | 108 | 14 | 2 | 34 | 2 | 2 | 1 | 163 |
| Numbers in 2016 | 109 | 15 | 4 | 31 | 2 | 1 | 2 | 163 |
| implied by target | ||||||||
| 2016 % change: | 8% | * | * | * | * | * | * | 20% |
| on 2015 | ||||||||
| on 04-08 ave | -52% | * | * | -25% | * | * | * | -49% |
* A percentage change is not shown if the denominator is 50 or fewer.
1. Light goods vehicles and heavy goods vehicles.
2. Taxis, minibuses and other modes of transport.
| Pedestrian | Pedal cycle | Motor cycle | Car | Bus / coach | Goods1 | Other2 | All road users | Traffic | Slight casualty rate | |
| numbers | mill veh-km | per 100 mill veh-km | ||||||||
| 1994-98 ave | 3,009 | 1,034 | 580 | 10,859 | 912 | 583 | 501 | 17,478 | 37,653 | 46.42 |
| 1994 | 3,083 | 1,068 | 577 | 10,123 | 1,084 | 669 | 398 | 17,002 | 36,000 | 47.23 |
| 1995 | 3,048 | 1,031 | 576 | 10,321 | 802 | 579 | 498 | 16,855 | 36,737 | 45.88 |
| 1996 | 3,047 | 1,081 | 550 | 10,740 | 902 | 499 | 499 | 17,318 | 37,777 | 45.84 |
| 1997 | 2,944 | 1,062 | 590 | 11,669 | 886 | 525 | 529 | 18,205 | 38,581 | 47.19 |
| 1998 | 2,921 | 930 | 605 | 11,444 | 887 | 643 | 580 | 18,010 | 39,168 | 45.98 |
| 1999 | 2,620 | 828 | 594 | 10,901 | 841 | 609 | 534 | 16,927 | 39,770 | 42.56 |
| 2000 | 2,607 | 708 | 655 | 10,675 | 854 | 542 | 582 | 16,623 | 39,561 | 42.02 |
| 2001 | 2,487 | 745 | 724 | 10,342 | 761 | 595 | 499 | 16,153 | 40,065 | 40.32 |
| 2002 | 2,423 | 676 | 711 | 10,050 | 801 | 621 | 460 | 15,742 | 41,535 | 37.90 |
| 2003 | 2,215 | 663 | 697 | 10,055 | 822 | 537 | 474 | 15,463 | 42,038 | 36.78 |
| 2004 | 2,328 | 648 | 599 | 10,024 | 849 | 561 | 419 | 15,428 | 42,705 | 36.13 |
| 2005 | 2,308 | 649 | 677 | 9,532 | 794 | 495 | 478 | 14,933 | 42,718 | 34.96 |
| 2006 | 2,104 | 640 | 658 | 9,272 | 706 | 484 | 456 | 14,320 | 44,119 | 32.46 |
| 2007 | 2,050 | 563 | 640 | 8,793 | 590 | 506 | 431 | 13,573 | 44,666 | 30.39 |
| 2008 | 1,888 | 566 | 612 | 8,314 | 527 | 467 | 373 | 12,747 | 44,470 | 28.66 |
| 2009 | 1,643 | 647 | 646 | 8,328 | 437 | 423 | 416 | 12,540 | 44,219 | 28.36 |
| 2010 | 1,509 | 636 | 491 | 7,293 | 487 | 386 | 359 | 11,161 | 43,488 | 25.66 |
| 2011 | 1,506 | 661 | 482 | 6,930 | 453 | 384 | 305 | 10,721 | 43,390 | 24.71 |
| 2012 | 1,459 | 727 | 503 | 6,745 | 396 | 411 | 314 | 10,555 | 43,549 | 24.24 |
| 2013 | 1,304 | 725 | 471 | 6,151 | 358 | 390 | 260 | 9,659 | 43,840 | 22.03 |
| 2014 | 1,270 | 727 | 471 | 6,007 | 262 | 400 | 265 | 9,402 | 44,839 | 20.97 |
| 2015 | 1,227 | 628 | 450 | 5,999 | 282 | 411 | 209 | 9,206 | 45,374 | 20.29 |
| 2016 prov. | 1,234 | 634 | 413 | 5,819 | 256 | 411 | 230 | 8,997 | 46,437 | 19.37 |
| 2004-08 average | 2,136 | 613 | 637 | 9,187 | 693 | 503 | 431 | 14,200 | 43,736 | 32.52 |
| 2012-16 average | 1,299 | 688 | 462 | 6,144 | 311 | 405 | 256 | 9,564 | 44,808 | 21.38 |
| Rate in 2016 | 30.56 | |||||||||
| implied by target | ||||||||||
| 2016 % change: | 1% | 1% | -8% | -3% | -9% | 0% | 10% | -2% | 2% | * |
| on 2015 | ||||||||||
| on 04-08 ave | -42% | 3% | -35% | -37% | -63% | -18% | -47% | -37% | 6% | -40% |
1. Light goods vehicles and heavy goods vehicles.
2. Taxis, minibuses and other modes of transport.