4. Reported numbers of Casualties (Tables 2a, 2b and 4)
4. Reported numbers of Casualties (Tables 2a, 2b and 4)
4.1 In 2019, 168 people were killed in road accidents in Scotland: 7 (4%) more than 2018. Since 1978, there has been a clear, steady, long-term downward trend. More recent years' figures have fluctuated around a less pronounced downward trend [Figure 1].
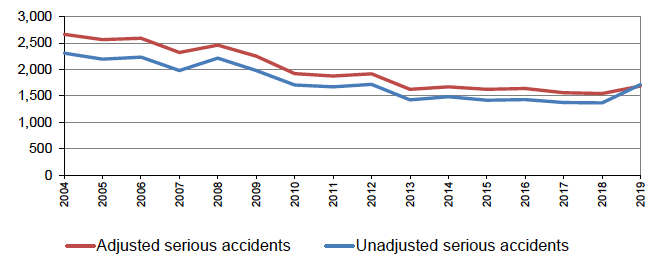
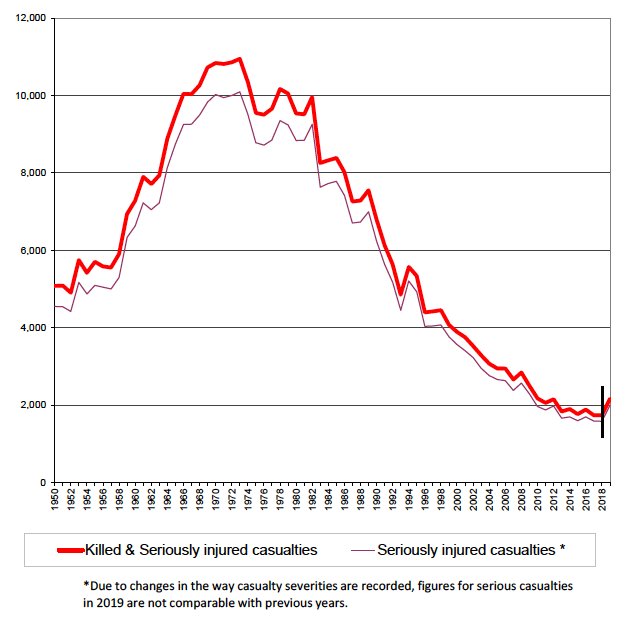
4.2 In 2019 there were 2,001 people seriously injured in road accidents. As outlined in section 2.4, this figure cannot be directly compared to the reported figures for previous years. Table 2b provides adjusted figures to show how many serious casualties there would have been in previous years if they had been recorded using an injury-based reporting system. These experimental statistics, produced by the Department for Transport, make it possible to compare the most recent statistics to previous years. On the basis of the adjusted figures, the number of people seriously injured in 2019 increased by 12% on 2018. Figure A shows how the adjusted and non-adjusted figures compare since 2004. The long-term trend has generally been downward since the early 1980s [Figure A].
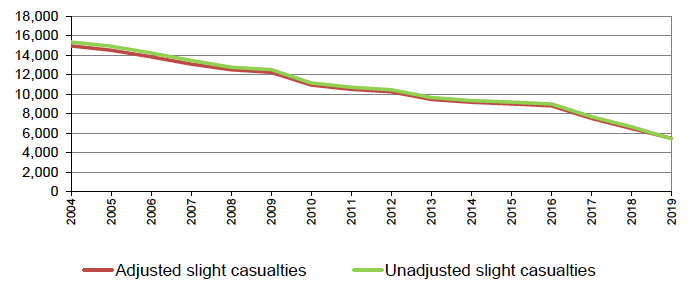
4.3 There were 5,425 people reported as slightly injured in 2019. Once again, this figure cannot be directly compared to the reported figures for previous years. Table 2b provides adjusted figures to show how many slight casualties there would have been in previous years if they had been recorded using an injury-based reporting system. On the basis of the adjusted figures, the number of people slightly injured in road accidents in 2019 decreased by 16% on 2018. Figure B shows how the adjusted and non-adjusted figures compare since 2004. There has been a clear downward trend in these figures since 1997 [Figure B].
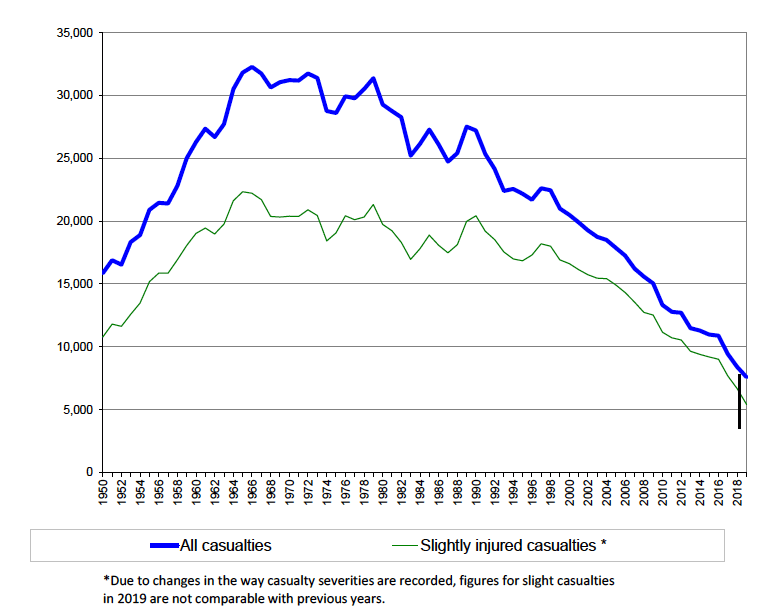
4.4 There were a total of 7,594 casualties (of all severities) reported in 2019: 830 (10%) fewer than in 2018 and the lowest number since annual records began in 1950. Between circa 1970 and 1990, the figures fluctuated around a general downward trend, with numbers falling from the short-term peak in 1989 & 1990 (of over 27,000). Since 1998, there has been a consistent reduction every year, with numbers falling below 12,000 in 2013, which was half the level of the early 1990s [Figure 3].
| Killed | Serious injury | Killed and Serious | Slight injury | All Severities | ||
|---|---|---|---|---|---|---|
| 1950 | 529 | 4,553 | 5,082 | 10,774 | 15,856 | |
| 1955 | 610 | 5,096 | 5,706 | 15,193 | 20,899 | |
| 1960 | 648 | 6,632 | 7,280 | 19,035 | 26,315 | |
| 1965 | 743 | 8,744 | 9,487 | 22,340 | 31,827 | |
| 1970 | 815 | 10,027 | 10,842 | 20,398 | 31,240 | |
| 1975 | 769 | 8,779 | 9,548 | 19,073 | 28,621 | |
| 1980 | 700 | 8,839 | 9,539 | 19,747 | 29,286 | |
| 1985 | 602 | 7,786 | 8,388 | 18,899 | 27,287 | |
| 1986 | 601 | 7,422 | 8,023 | 18,094 | 26,117 | |
| 1987 | 556 | 6,707 | 7,263 | 17,485 | 24,748 | |
| 1988 | 554 | 6,732 | 7,286 | 18,139 | 25,425 | |
| 1989 | 553 | 6,998 | 7,551 | 19,981 | 27,532 | |
| 1990 | 546 | 6,252 | 6,798 | 20,430 | 27,228 | |
| 1991 | 491 | 5,638 | 6,129 | 19,217 | 25,346 | |
| 1992 | 463 | 5,176 | 5,639 | 18,534 | 24,173 | |
| 1993 | 399 | 4,454 | 4,853 | 17,561 | 22,414 | |
| 1994 | 363 | 5,208 | 5,571 | 17,002 | 22,573 | |
| 1995 | 409 | 4,930 | 5,339 | 16,855 | 22,194 | |
| 1996 | 357 | 4,041 | 4,398 | 17,318 | 21,716 | |
| 1997 | 377 | 4,047 | 4,424 | 18,205 | 22,629 | |
| 1998 | 385 | 4,072 | 4,457 | 18,010 | 22,467 | |
| 1999 | 310 | 3,765 | 4,075 | 16,927 | 21,002 | |
| 2000 | 326 | 3,568 | 3,894 | 16,624 | 20,518 | |
| 2001 | 348 | 3,410 | 3,758 | 16,153 | 19,911 | |
| 2002 | 304 | 3,229 | 3,533 | 15,742 | 19,275 | |
| 2003 | 336 | 2,957 | 3,293 | 15,463 | 18,756 | |
| 2004 | 308 | 2,766 | 3,074 | 15,428 | 18,502 | |
| 2005 | 286 | 2,666 | 2,952 | 14,933 | 17,885 | |
| 2006 | 314 | 2,635 | 2,949 | 14,320 | 17,269 | |
| 2007 | 281 | 2,385 | 2,666 | 13,573 | 16,239 | |
| 2008 | 270 | 2,575 | 2,845 | 12,747 | 15,592 | |
| 2009 | 216 | 2,287 | 2,503 | 12,540 | 15,043 | |
| 2010 | 208 | 1,969 | 2,177 | 11,161 | 13,338 | |
| 2011 | 185 | 1,878 | 2,063 | 10,722 | 12,785 | |
| 2012 | 176 | 1,981 | 2,157 | 10,555 | 12,712 | |
| 2013 | 172 | 1,667 | 1,839 | 9,653 | 11,492 | |
| 2014 | 203 | 1,701 | 1,904 | 9,398 | 11,302 | |
| 2015 | 168 | 1,602 | 1,770 | 9,207 | 10,977 | |
| 2016 | 191 | 1,698 | 1,889 | 9,009 | 10,898 | |
| 2017 | 145 | 1,594 | 1,739 | 7,694 | 9,433 | |
| 2018 2 | 161 | 1,584 | 1,745 | 6,679 | 8,424 | |
| 2019 3 | prov. | 168 | 2,001 | 2,169 | 5,425 | 7,594 |
| 2004 - 2008 average | 292 | 2,605 | 2,897 | 14,200 | 17,097 | |
| 2015 - 2019 average 3 | 167 | .. | .. | .. | 9,465 | |
| 2019 percentage change 3: | ||||||
| on 2018 3 | 4% | .. | .. | .. | -10% | |
| on 04-08 average 3 | -42% | .. | .. | .. | -56% |
1. Although regular records of the numbers of casualties began in 1947, the level of severity was only collected from 1950 and the number of injury road accidents weren’t collected until 1970.
2. Some figures for 2018 and earlier years may have been revised slightly from those published previously due to late returns, or due to late corrections being made to returns that had been received earlier.
3. Due to changes in severity reporting, the number of serious casualties cannot be compared directly to those reported in previous years.
These % change figures for serious casualties have therefore been omitted
Figure A: DfT Adjusted/unadjusted serious accidents, 2004 to 2019

Source: Department for Transport.
The unadjusted figures in this chart are National Statistics
The adjusted figures in this chart are Experimental Statistics
Figure B: DfT Adjusted/unadjusted slight casualties, 2004 to 2019

Source: Department for Transport.
The unadjusted figures in this chart are National Statistics
The adjusted figures in this chart are Experimental Statistics
| DfT adjusted serious | DfT adjusted Slight | Dft unadjusted Serious | Dft unadjusted Slight | DfT Serious/Slight total | |
|---|---|---|---|---|---|
| 2004-2008 average | 2,919 | 13,774 | 2,558 | 14,136 | 16,694 |
| 2004 | 3,141 | 14,944 | 2,737 | 15,348 | 18,085 |
| 2005 | 3,002 | 14,507 | 2,597 | 14,912 | 17,509 |
| 2006 | 2,991 | 13,830 | 2,607 | 14,214 | 16,821 |
| 2007 | 2,685 | 13,078 | 2,315 | 13,448 | 15,763 |
| 2008 | 2,778 | 12,513 | 2,535 | 12,756 | 15,291 |
| 2009 | 2,552 | 12,244 | 2,269 | 12,527 | 14,796 |
| 2010 | 2,188 | 10,928 | 1,960 | 11,156 | 13,116 |
| 2011 | 2,082 | 10,495 | 1,873 | 10,704 | 12,577 |
| 2012 | 2,161 | 10,244 | 1,959 | 10,446 | 12,405 |
| 2013 | 1,857 | 9,462 | 1,667 | 9,652 | 11,319 |
| 2014 | 1,876 | 9,164 | 1,694 | 9,346 | 11,040 |
| 2015 | 1,800 | 8,988 | 1,597 | 9,191 | 10,788 |
| 2016 | 1,902 | 8,790 | 1,694 | 8,998 | 10,692 |
| 2017 | 1,775 | 7,506 | 1,589 | 7,692 | 9,281 |
| 2018 | 1,761 | 6,473 | 1,580 | 6,654 | 8,234 |
| 2019 | 1,965 | 5,457 | 1,998 | 5,424 | 7,422 |
| 2019 change on 2018 | 11.6 | -15.7 | -9.9 | ||
| 2019 change on 04-08 average | -32.7 | -60.4 | -55.5 |
Source: Department for Transport.
The unadjusted figures in this table are National Statistics
The adjusted figures in this table are Experimental Statistics
Unadjusted figures in this table may not match those in other tables in this publication as DfT close its database each year but Transport Scotland keep its database open.
Figures for serious and slight injuries are as reported by police. Since 2019, Police Scotland has adopted a new severity reporting system which means that serious injury figures, and to a lesser extent slight injuries, are not comparable with earlier years. Adjustments to account for the change have been produced.
More information on the change and the adjustment process is available at the following address.
Figure 1: Number of casualties killed, 1950 to 2019

Figure 2: Killed and Seriously injured casualties and Seriously injured casualties, 1950 - 2019

Figure 3: All casualties and Slightly injured casualties, 1950 - 2019
