Casualties by Police Force division and Local Authority area
Key Reported Road Casualties Scotland 2020
Casualties by Police Force division and Local Authority area
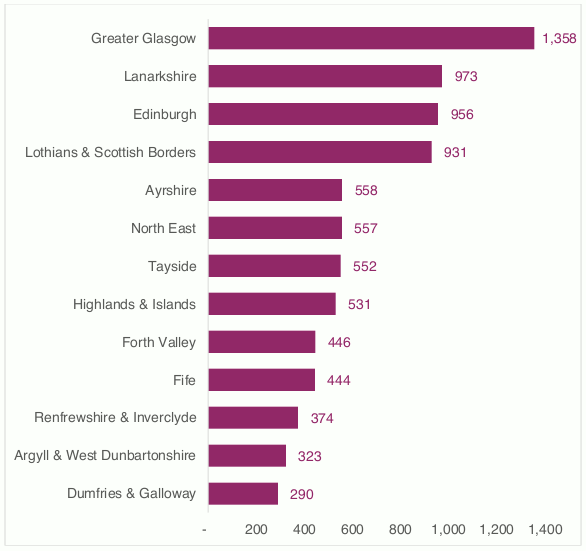
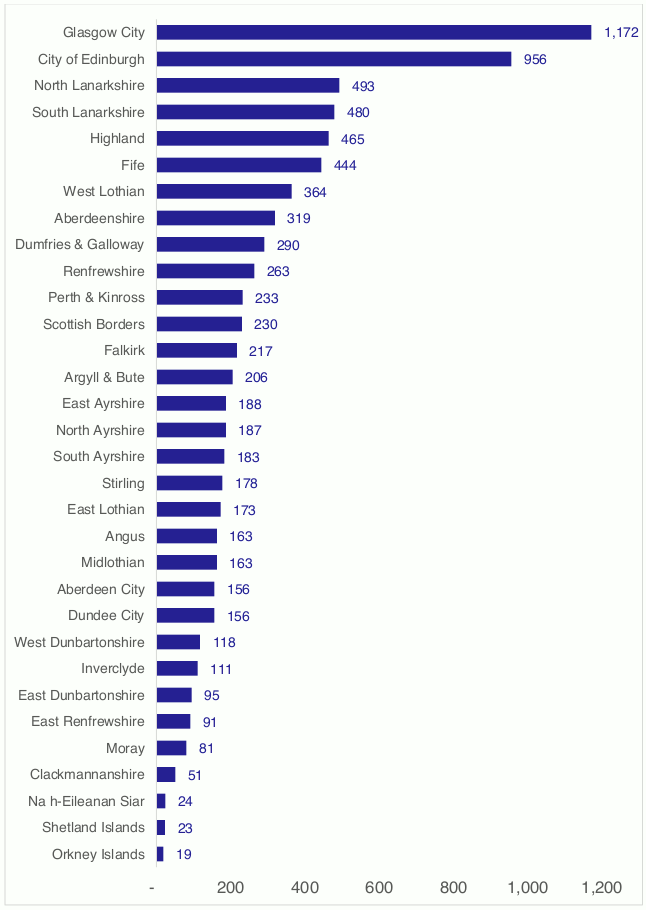
Figures 10 and 11 show the average number of reported numbers of casualties in each Police Force division and each Local Authority area for 2016-2020. Since numbers for individual police force divisions and local authorities can be low, late returns and amendments can result in higher percentage changes than those seen in the national figures. In addition, there can be quite large percentage year-to-year fluctuations in the figures for local authority areas within Scotland, particularly for those with the lower numbers. We therefore present the average figures for the last five years.
For both police force divisions and local authorities, the highest number of casualties are seen in urban, densely populated areas. Figure 11 shows that Glasgow City and City of Edinburgh have the highest number of road casualties in the 2016-2020 period. Orkney Islands, Shetland Islands and Na h-Eileanan Siar have the lowest number of casualties.
Figure 10: Average number of reported road casualties by Police Force division, 2016-2020.

Figure 11: Average number of reported road casualties by Local Authority, 2016-2020.
