Socio-Economic Case
This section initially focuses on estimating the demand impacts of the 4 remaining options with the primary focus being on Option 1, based on the experience of the pilot but updated to use data to April 25. Scenario analysis is then run based on these results to estimate the long-term impacts of making the pilot permanent.
This is then followed by an assessment of the options against the revised Project Objectives and a summary of the analysis of issues raised by the in scope Impact Assessments.
Full Value for Money analysis is undertaken in Section 8 once all 5 dimensions have been considered.
Demand impact estimates
Methodology
The impact on demand has been estimated using the same econometric approach that was used in the “final” evaluation report but applied to data to end April 25. Details of the methodology can be found in Annex A but the basic approach is to estimate the impact of the Pilot using a “dummy variable” (1 when it is in place, 0 otherwise), a similar dummy when peak fares were restored along with additional trend variables over these periods. This is alongside a range of other variables, as before to account for factors such as the day of the week, wider seasonality, bad weather, large scale events and the impact of the fare rise in April 2024, the reduced timetable in Summer 24 as well as general levels of (road) travel across Scotland. The 3.8% rise in rail fares in April 25 is not included in the analysis as it is considered to not have been in place sufficiently long to be picked up within the data.
The counterfactual
As discussed in the final report, the key analytical issue for analysing the Pilot and hence the first step of the impact of a permanent change is around what would have happened if it had not been in place – the counterfactual. Significant work has been undertaken examining possible scenarios.
5 main scenarios were considered in the final evaluation report. The key factor is how demand recovered compared with pre-Covid 19 levels before the Pilot started and how this would have continued in the absence of the Pilot and what has happened since. There remains considerable uncertainty around the counterfactual.
- M1 - Assume recovery trend pre-Pilot continued.
- M2 - Assume recovery stabilised at 90% of pre-C19 demand (Demand at end Jul 23) – Equivalent to the rUK position and considered the primary scenario
- M3 - Assume recovery stabilised at 80% of pre-C19 demand (Demand at end Mar 2023)
- M4 - Assume recovery stabilised at end Sept 2023 (Before trial started)
- M5 - Assume recovery trend continued to 100% pre-C19 demand (End Nov 2023) and then would have stabilised at this level
Scenarios M2 and M4 were the basis of the evaluation report and these scenarios are used again here. A further scenario was added that assumed a long-term trend before during and after the trial period and alternative trends during and after. For simplicity they are labelled as:
- Core scenario - Assume recovery stabilised at 90% of pre-C19 demand (Demand at end Jul 23) – Equivalent to the rUK position. Formerly M4
- Alternative scenario - Assume recovery stabilised at end Sept 2023 (Before trial started). Formerly M2
- Long term trend – Assume long term trend with adjustments during and after trial period. New.
Results
The econometric results from the 3 scenarios are shown in the tables below.
Core Scenario
| Variable | Coefficient | Std. Error | t-ratio | p-value |
|---|---|---|---|---|
| Constant | 110091 | 8745.18 | 12.5887 | <0.00001 |
| PFTDummy | 11906.1 | 2401.26 | 4.9583 | <0.00001 |
| PeakFaresBackDu | 19266.6 | 2601.73 | 7.4053 | <0.00001 |
| Trendto90PCD | 122.256 | 6.85269 | 17.8406 | <0.00001 |
| Xmas_NewYear | -59938.5 | 4259.27 | -14.0725 | <0.00001 |
| Sat | 19030 | 2401.68 | 7.9236 | <0.00001 |
| Sun | -95627.2 | 2378.58 | -40.2036 | <0.00001 |
| Mon | -12882 | 2353.35 | -5.4739 | <0.00001 |
| Thur | 4720.56 | 2350.12 | 2.0086 | 0.04482 |
| Fri | 21418.2 | 2365.99 | 9.0525 | <0.00001 |
| Sport | 12254.8 | 3083.78 | 3.9740 | 0.00008 |
| Concert | 16287 | 4567.51 | 3.5658 | 0.00038 |
| Strike | -115144 | 5411.89 | -21.2761 | <0.00001 |
| Weather | -13590.9 | 3250.61 | -4.1810 | 0.00003 |
| ExtremeWeather | -88473.3 | 7562.31 | -11.6992 | <0.00001 |
| Travel_Demand_n | 60398.1 | 8819.49 | 6.8483 | <0.00001 |
| Jan | -21569.8 | 2975.32 | -7.2496 | <0.00001 |
| June | -9094.29 | 2846.43 | -3.1950 | 0.00144 |
| July | -11394.5 | 2865.24 | -3.9768 | 0.00007 |
| Aug | 13266.4 | 2922.24 | 4.5398 | <0.00001 |
| Oct | -4886.2 | 2775.71 | -1.7603 | 0.07863 |
| Dec | 10711.7 | 3126.49 | 3.4261 | 0.00063 |
| EmergencyTimetable | -7823.24 | 3199.01 | -2.4455 | 0.01462 |
Core scenario summary statistics
- Mean dependent var: 206218.2
- Sum squared resid: 6.46e+11
- R-squared: 0.825855
- D. dependent var: 57420.55
- E. of regression: 24199.76
- Adjusted R-squared: 0.822382
At first glance this scenario seems counterintuitive – the Peak Fares dummy variable is smaller in magnitude than the Peak Fares Back dummy (and there are no significant trend variables other than the initial one). However, because the post-trial period (at this point) is shorter in magnitude than the trial itself this is a quirk of how the econometrics can be interpreted and this scenario produces sensible results when used to estimate the impacts of the trial and the post-trial period (See below). All other co-efficient are sensible and in line with the previous evaluation analysis.
Alternative Scenario
| Variable | Coefficient | Std. Error | t-ratio | p-value |
|---|---|---|---|---|
| const | 110790 | 8736.95 | 12.6806 | <0.00001 |
| TrendtoOCt23 | 118.59 | 5.55811 | 21.3364 | <0.00001 |
| PeakFaresTrend | 32.2154 | 6.65325 | 4.8421 | <0.00001 |
| Xmas_NewYear | -59880.6 | 4250.28 | -14.0886 | <0.00001 |
| Sat | 18982.4 | 2400.3 | 7.9083 | <0.00001 |
| Sun | -95765.2 | 2377.01 | -40.2882 | <0.00001 |
| Mon | -12930 | 2351.97 | -5.4975 | <0.00001 |
| Thur | 4678.27 | 2349.08 | 1.9915 | 0.04667 |
| Fri | 21356.7 | 2365.12 | 9.0299 | <0.00001 |
| Sport | 12607.3 | 3076.42 | 4.0981 | 0.00004 |
| Concert | 16653.3 | 4562.33 | 3.6502 | 0.00027 |
| Strike | -116441 | 5378.95 | -21.6475 | <0.00001 |
| Weather | -13271.5 | 3158.4 | -4.2020 | 0.00003 |
| ExtremeWeather | -88366.6 | 7559.12 | -11.6901 | <0.00001 |
| Travel_Demand_n | 59702.1 | 8833.26 | 6.7588 | <0.00001 |
| Jan | -19607.2 | 2942.86 | -6.6626 | <0.00001 |
| June | -9129.42 | 2814.46 | -3.2438 | 0.00122 |
| July | -10726.4 | 2830.74 | -3.7893 | 0.00016 |
| Aug | 13491.2 | 2869.58 | 4.7014 | <0.00001 |
| Nov | 5616.48 | 3370.36 | 1.6664 | 0.09591 |
| Dec | 13046.7 | 3104.21 | 4.2029 | 0.00003 |
| EmergencyTimetable | -12038.4 | 3227.17 | -3.7303 | 0.00020 |
Alternative scenario summary statistics
- Mean dependent var: 206218.2
- Sum squared resid: 6.46e+11
- R-squared: 0.825878
- D. dependent var: 57420.55
- E. of regression: 24187.23
- Adjusted R-squared: 0.822566
This scenario is intuitive – there was a positive impact from Peak Fares which did not continue when the pilot ended. All other co-efficient are sensible.
Long Term Trend
| Variable | Coefficient | Std. Error | t-ratio | p-value |
|---|---|---|---|---|
| const | 109512 | 8713.84 | 12.5676 | <0.00001 |
| Trend | 119.46 | 5.63855 | 21.1864 | <0.00001 |
| PeakFaresTrend | -84.8735 | 13.404 | -6.3320 | <0.00001 |
| PeakFaresBackTr | -125.947 | 22.0883 | -5.7020 | <0.00001 |
| Xmas_NewYear | -59965.4 | 4255.16 | -14.0924 | <0.00001 |
| Sat | 18910.5 | 2402.97 | 7.8696 | <0.00001 |
| Sun | -95831 | 2379.61 | -40.2718 | <0.00001 |
| Mon | -12918 | 2354.83 | -5.4858 | <0.00001 |
| Thur | 4734.4 | 2351.72 | 2.0132 | 0.04434 |
| Fri | 21432.6 | 2367.6 | 9.0525 | <0.00001 |
| Sport | 12878 | 3076.54 | 4.1859 | 0.00003 |
| Concert | 16545.2 | 4567.52 | 3.6224 | 0.00031 |
| Strike | -116169 | 5383.76 | -21.5776 | <0.00001 |
| Weather | -13355.4 | 3164.08 | -4.2209 | 0.00003 |
| ExtremeWeather | -87757.3 | 7561.09 | -11.6064 | <0.00001 |
| Travel_Demand_n | 61047.9 | 8815.34 | 6.9252 | <0.00001 |
| Jan | -20212.9 | 2923.22 | -6.9146 | <0.00001 |
| June | -9668.95 | 2839.23 | -3.4055 | 0.00068 |
| July | -11045.7 | 2828.36 | -3.9053 | 0.00010 |
| Aug | 13176.1 | 2867.09 | 4.5956 | <0.00001 |
| Dec | 12386 | 3088.96 | 4.0098 | 0.00006 |
| EmergencyTimetable | -13197.3 | 3704.38 | -3.5626 | 0.00038 |
Long term trend summary statistics
- Mean dependent var: 206218.2
- Sum squared resid: 6.47e+11
- R-squared: 0.825453
- D. dependent var: 57420.55
- E. of regression: 24216.73
- Adjusted R-squared: 0.822133
The econometric results for this scenario do not make intuitive sense – the results suggest that there was a long term positive trend that was reduced by the introduction of peak fares and reduced further when they were removed. It is caused by the recovery from Covid 19 in the early period of the data. A range of data truncations (smaller sample) were tested and none produced intuitive results. Although all other co-efficients are sensible, this scenario is not included in further analysis.
Impact on trial and post-trial demand
The two remaining scenarios generate the following results for demand during and after the trial. The results are shown below. The daily average number of journeys is the preferred metric due to the variation in time periods between the pre-pilot, pilot and post pilot periods.
| Period | Total with pilot | Daily Average with pilot | Total without pilot | Daily Average without pilot | Total change on pilot | Daily Average change on pilot |
|---|---|---|---|---|---|---|
| Total | 232,898,147 | 218,479 | 228,564,326 | 214,413 | Not applicable | Not applicable |
| Pre-Pilot (from April 22)) | 101,892,000 | 185,596 | 101,892,000 | 185,596 | Not applicable | Not applicable |
| Pre-Pilot (1 year) | 71,378,063 | 195,556 | 71,378,063 | 195,556 | Not applicable | Not applicable |
| Pilot Period | 81,903,979 | 224,394 | 77,570,159 | 212,521 | 4,333,800 | 11,900 |
| Post Pilot Period | 49,102,167 | 231,614 | 49,102,167 | 231,614 | Not applicable | 7,200 |
| Period | Total with pilot | Daily Average with pilot | Total without pilot | Daily Average without pilot | Total change | Daily Average change |
|---|---|---|---|---|---|---|
| Total | 233,273,236 | 218,830 | 228,635,443 | 214,480 | Not applicable | Not applicable |
| Pre-Pilot (from April 22) | 101,901,416 | 185,613 | 101,901,416 | 185,613 | Not applicable | Not applicable |
| Pre-Pilot (1 year) | 71,421,841 | 195,676 | 71,421,841 | 195,676 | Not applicable | Not applicable |
| Pilot Period | 82,225,894 | 225,276 | 80,085,825 | 219,413 | 2,140,100 | 5,900 |
| Post Pilot Period | 49,145,927 | 231,820 | 46,648,202 | 220,039 | Not applicable | 6,500 |
A summary of the results in terms is shown below
|
Number of passenger journeys (Demand) |
Total Change (Core Scenario) |
Average Daily Change (Core Scenario) |
Percentage Change (Core Scenario) |
Total Change (Alternative Scenario) |
Average Daily Change (Alternative Scenario) |
Percentage Change (Alternative Scenario) |
|
Impact of Pilot |
4,333,800 |
11,900 |
5.59% |
2,140,100 |
5,900 |
2.67% |
|
Post Pilot |
Not applicable |
7,200 |
3.22% |
Not applicable |
6,500 |
2.90% |
Both scenarios are slightly below the levels reported in the evaluation for the pilot period (6.7% and 3.3%) respectively. This may be due to a tail off in demand as the pilot came to an end (combined with a recovery from the emergency timetable period towards the end of the trial) or may reflect longer term factors (seasonality) etc. resulting from including more data.
What is particularly noticeable (and perhaps unexpected) is that demand continued to increase after the trial ended (this is apparent visually in the figure in Section 2 above). In the case of the core scenario this was at a lower rate than during the trial but in the alternative scenario the rates are broadly equivalent. This could be explained either by exogenous factors such as a greater level of office working, as a result of the discounts on seasons and increased flexibility of Flexipasses that were introduced. Regardless it serves to illustrate the uncertainty around the estimation of impacts.
For the purposes of the remainder of this section, the analysis will focus on the impacts assessed within the core scenario.
Updated assessment of impact of pilot on original objectives
This section briefly revisits the results of the pilot in terms of the original objectives.
Improve awareness of rail as a viable travel choice
It is fairly clear from the analysis of both the trial and post-trial data that the pilot can be considered to be successful in achieving a greater awareness of rail as a viable travel choice. This is particularly reflected in the analysis of the post-trial data.
Improve access to rail by reducing the cost of travel at peak times, enabling more people to travel more often
Again, there was an increase in usage of the rail system and this continued at either a reduced or similar rate when the trail ended. By all measurements the trial was successful at increasing access to rail. However, two caveats should be borne in mind.
Firstly, that the overall impacts are now judged to be slightly less than was the case at the 9 month evaluation but this may be due to demand taking time to recover from the emergency timetable towards the end of the trial. Secondly, that the characteristics of those who benefited tended to be existing rail users who generally have higher income levels – this was discussed in detail in the evaluation and is returned to below in the Impact Assessment section of this OBC.
Reduction in private car travel as more people choose to travel by rail
The carbon reduction impacts from a shift away from car use as assessed by the pilot evaluation were that the overall impact of the pilot was a reduction in CO2 emissions of less than 0.1%. The revised demand change estimates do not significantly impact on this figure. As such, the design of the project, in terms of its ability to increase its impact compared with the pilot will be crucial to achieving a greater magnitude outcome.
Assessment of Options against Critical Success Factors and Qualitatively against STAG Criteria.
The table below is an assessment of the 6 options against the revised critical success factors and STAG criteria. There is overlap between the critical success factors (in bold) and 3 of the STAG criteria. The assessment uses a -3 to +3 scale for option 1 and then overlays impacts to this score for the additional options.
| Option/CSF | Improve access to rail/ Economy | Reduction in private car/Climate Change/Environment | Simplify the range | Health and Wellbeing | Equality and Accessibility | OVERALL |
|---|---|---|---|---|---|---|
| Option 1 - Core change | 3 | 1 | 3 | 0 | 2 | 9 |
| Option/CSF | Improve access to rail/ Economy | Reduction in private car/Climate Change/Environment | Simplify the range | Health and Wellbeing | Equality and Accessibility | OVERALL |
|---|---|---|---|---|---|---|
| Option 2 - Add seasons/flexis | Moderate Benefit | Minor benefit | Minor benefit | No benefit or impact | No benefit or impact | Strongly positive |
| Option 5 - Increase Core Fares (In addition) | Likely to be negative depending on extent of change | Likely to be negative depending on extend of change | No benefit or impact | Minor negative | Minor negative | Strongly Negative |
| Option 6 - Reinstate SOP (Addition to other options) | Minor benefit | No benefit or impact | Major negative | No benefit or impact | Minor benefit | Negative |
Option 2 scores highest whilst Option 5 is likely to impact significantly negatively (depending on the extent to which core fares are adjusted upwards). Option 6 has some advantages in term of potential small increases in demand for the limited number of services concerned but this is more than offset by a significant increase in both the complexity of ticketing and the ease of public perception of messaging.
Assessment of Options against standard Impact Assessment Outcomes
EQIA – Equalities Impact Assessment
The evaluation of the trial considered the impact on different groups. A full analysis can be found in Annex C. There was no evidence that any equality groups were negatively impacted and some mildly positive results with regard to age. The removal of option 2 and 3 at short list stage does not impact negatively on Equality groups with specific cards (as it maintains the current position).
In terms of age, there is some, relatively weak evidence that the Pilot has encouraged older users to use rail when they didn’t before and has encouraged 31- to 40-year-old existing users to travel more by rail.
FSD – Fairer Scotland Duty
The Fairer Scotland Duty (the Duty) is set out in legislation in Part 1 of the Equality Act 2010. It came into force in Scotland from April 2018. It requires Scottish Ministers and named public bodies to actively consider what more can be done to reduce the 'inequalities of outcome' caused by 'socio-economic disadvantage' when making 'strategic decisions'.
The evaluation of the trial discussed above showed that:
Existing rail users who didn’t change their behaviour were more concentrated in the income group with an above average income (£35,000 to £49,999) than the population as a whole, but the proportions within the middle income groups (£20,000 to £49,000) was broadly the same for all (45%,47%,47% and 47%). New rail users were more likely to be in lower (less than £35,000) income groups (48%) than existing users (37%,37%). Non-rail users were more likely to be in very low income groups (28%) compared with both groups of existing users (18%, 12%) and new rail users (20%). So, there is some moderate evidence that the trial has encouraged rail use amongst low to middle income households whilst primarily benefiting existing users who tended to be above average income.
It is anticipated that making the change permanent whilst continuing to benefit those who benefited from the trial will potentially allow those on lower incomes or with socio-economic disadvantage to make decisions (taking a job that requires commuting by rail, travelling by rail for leisure) that will potentially benefit them with a greater degree of certainty so it is expected that the impact of permanence on these groups will be higher than it was during the trial.
There is relatively little difference between the options with Option 2 having the most positive impact along with potentially Option 6 and it being extremely likely that Option 5 will have less positive impacts compared with option 6.
Consumer Duty
The Consumer Scotland Act 2020 (the Act) came into force on 1 April 2024 and was applied to Scottish Ministers through secondary legislation (The Consumer Scotland Act 2020 (Relevant Public Authorities) Regulations 2024).
The duty is intended to improve the extent to which consumers are considered in strategic policy and decision-making in order to deliver better policy outcomes for consumers in Scotland.
The Act defines a consumer as either an individual or a small business that purchases, uses or receives goods or services in Scotland, where those goods or services are supplied in the course of business.
The duty covers consumers of services provided by government departments, local government and other public authorities. All users of public services are consumers regardless of whether or not they pay directly for that service. A consumer can also refer to potential or future consumers.
The entire policy is targeted at improving the experience of consumers of the railway. The experience is likely to be strongly positive for all options overall with potentially less positive outcomes for Option 5 (but still positive) and perhaps some minor negative outcomes from not taking forward Option 6 for those consumers (a very small number) who have previously relied on super off-peak fares.
BRIA - Business and Regulatory Impact Assessment
Business and Regulatory Impact Assessments (BRIAs) are used to assess the costs, benefits and risks of any proposed primary or secondary legislation, voluntary regulation, codes of practice, policy changes or guidance that may have an impact on the public, private, third sector or regulators.
As discussed above there are no negative impacts on members of the public from the proposal (other than those mentioned under consumer duty for Option 6) and the public will benefit from the proposal and all options.
There are likely to be positive wider private sector impacts with peak business travel becoming less expensive and the only part of the private sector that could be significantly negatively impacted is bus operators.
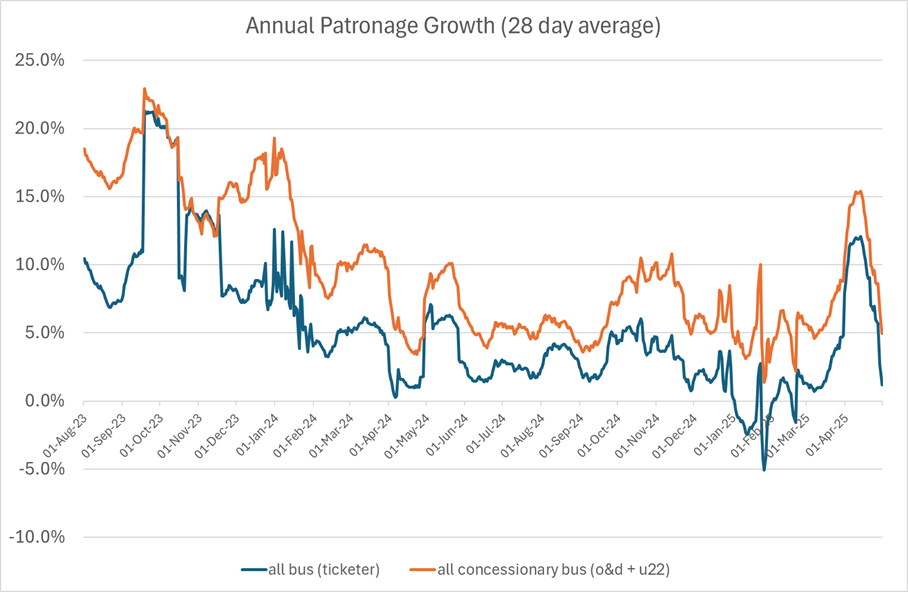
The peak trial evaluation report considered the impact on bus operators. There was some shifting from bus but discussions with bus operators suggested that this was not significant and was more than outweighed by growing demand from the U22 concessionary travel scheme. The modelled scale of abstraction from bus was small (around 1 million bus journeys which represents around less than 0.25% of bus journeys) and was overshadowed in reality by an ongoing increase in patronage from the U22 concessionary scheme.
The extent of bus demand has been monitored, and during the trial overall bus patronage grew at a rate broadly equivalent to the impact on rail. In addition, the growth in Concessionary travel, directly supported by the Scottish Government grew at a rate significantly in excess of the impact on rail demand (and continues to do so). There was a fall in bus demand in January and February 25 but this was after the peak fares trial had finished.
More generally the bus industry is supported by the range of concessionary schemes and wider interventions. The impact of the permanent removal of peak fares on the bus industry will be monitored closely as part of the continuing evaluation package that will be put in place.
Strategic Environmental IA
Strategic Environmental Assessment (SEA) assesses the likely significant environmental effects of a public plan, programme, or strategy. It considers how negative impacts can be avoided or minimised and, where appropriate, identifies opportunities for positive effects to be enhanced.
It is considered that the assessment of environmental impacts in the rest of this OBC is sufficient to cover the requirements of an SEA – the trial has positive environmental impacts and one of the key objectives of the trial is to maximise the impact in terms of reducing car travel and thus air pollution and climate change.
Summary
In terms of the Socio-Economic case, all options have overall positive outcomes. Looking at the benefits alone, Option 2 – the core option plus a 5% discount on seasons/flexis scores highest.
The overall recommendation of this OBC will be dependent on the remaining cases, specifically the financial case which allows a formal assessment of Value for Money both in terms of a quantified Benefit Cost Ratio for all Options but also in terms of the non-monetarised benefits (specifically in terms of the simplification of the rail fares system).