Summary transport statistics
Introduction
This chapter highlights some of the main findings from Scottish Transport Statistics, the accompanying summary tables provide longer term trends than those included in the individual chapters and include comparisons between Scotland and Great Britain. This publication covers data up until 2022-23.
The content of this chapter
This chapter covers the following topics:
- Overview of travel in Scotland
- Motor vehicles, traffic and road casualties
- Public transport: bus, rail, air and ferry
- Personal travel (e.g. driving, walking and cycling; travel to work and school)
- Cross-border transport
- Environment and emissions
Overview of travel in Scotland
Transport and travel habits in Scotland were profoundly affected by the Covid-19 pandemic, with restrictions on travel and daily activity in place for large parts of 2020 and some of 2021.
In 2022-23, public transport journeys rose by 34%, with 396 million public transport journeys made by either bus, rail, air, or ferry. This compares with the 294 million public transport journeys recorded in 2021-22.
Bus remained by far the most commonly used form of public transport in 2022-23, with 76% of public transport journeys made by bus, 16% by rail, 5% by air and 2% by ferry.
The number of bus journeys increased by 29% in 2022-23, although this was still down 17% from 2019-20. Prior to this, bus passenger numbers had been following a generally declining trend, dropping by 10% in the ten years leading up to 2019-20.
Rail journeys showed an increase of 36% over the year 2022-23. However, rail journeys were still down by around a third compared with 2019-20. In the years immediately prior to the pandemic rail use had been steadily increasing.
Air passengers increased by 207% between 2021 and 2022, but are still down by around a quarter compared with 2019. Air passenger numbers had increased by 28% in the ten years prior to the pandemic. Ferry passenger numbers showed an increase of 21% in 2022, but were still down 10% compared to 2019.
Road traffic also rose in 2022-23. Overall road traffic increased by 9%, with car traffic increasing by 11%. However, this is still below pre-pandemic levels. Prior to the pandemic, road traffic had been following a steadily increasing trend with total road traffic increasing by 10% in the 10 years up to 2019.
During the pandemic cycling was one of the few transport types to demonstrate an increase in traffic volume. Despite a decrease of 3% in 2022-23, cycling on the road network was estimated to be 16% higher than in 2019-20.
The table below shows changes in the numbers and percentage changes for various forms of transport.
| Mode | 2019-20 | 2021-22 | 2022-23 | Change over 1 year | Change since 2019-20 |
|---|---|---|---|---|---|
| Car Traffic (m/veh km) | 36,678 | 31,063 | 34,375 | +11% | -6% |
| Pedal Cycle Traffic (on-road) (m/veh km) | 365 | 435 | 422 | -3% | +16% |
| ScotRail Passengers (millions) | 96.4 | 46.7 | 63.7 | +36% | -34% |
| Bus Passengers (millions) | 361 | 233 | 301 | +29% | -17% |
| Air Passengers (millions) | 28.9 | 7.0 | 21.5 | +207% | -26% |
| Ferry Passengers (millions) | 10.4 | 7.7 | 9.3 | +21% | -11% |
Source: STS 2023, Table S1 except Traffic estimates from table.
Motor vehicles, traffic and road casualties
Motor vehicles
There were 3.1 million motor vehicles licensed in Scotland in 2022. Having increased slightly from 2021, this is the highest level recorded [Figure 1].
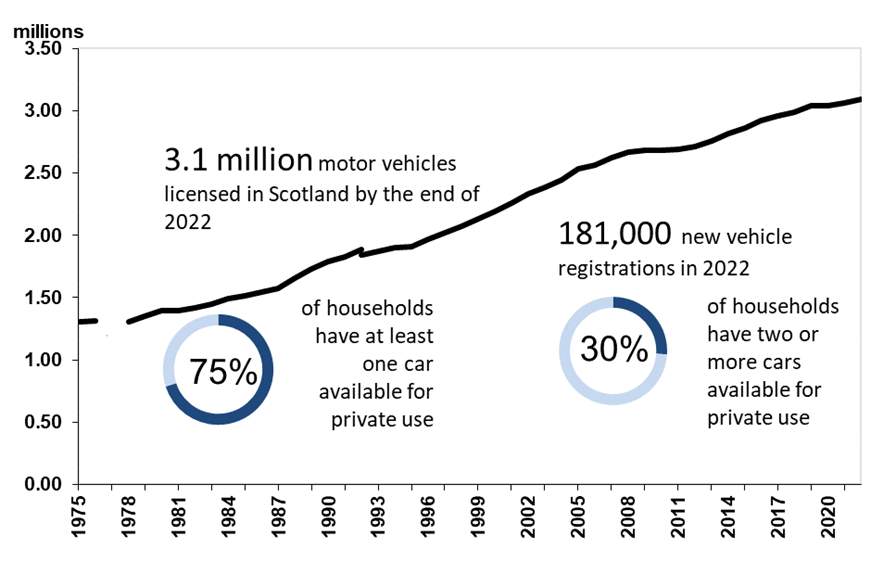
The total number of vehicles registered in Scotland has been increasing steadily over the longer term. The current total is 14% higher than in 2012 and has more than tripled since 1964.
The number of new vehicle registrations in 2022 (181,000) remained the same as in 2021. This was above the pandemic-affected figure for 2020 (161,000). However, it was still below the figure for 2019 (221,000), which itself was the third successive annual decrease. Taken together, the trends in total vehicles registrations and new vehicle registrations suggests that in recent years people have been buying fewer new vehicles, but retaining existing vehicles for longer.
There were fewer vehicles per person in Scotland than in Great Britain as a whole (56 compared to 60 per hundred population), as has consistently been the case in recent years.
The road network
There were 57,187 kilometres of public road in Scotland in 2022. Seven per cent of this was trunk road, which is managed centrally by Transport Scotland; the remaining roads are the responsibility of Local Authorities.
In Scotland, there was 10.4 kilometres of road per 1,000 people, compared to 6.0 km per 1,000 people in GB as a whole.
Road traffic
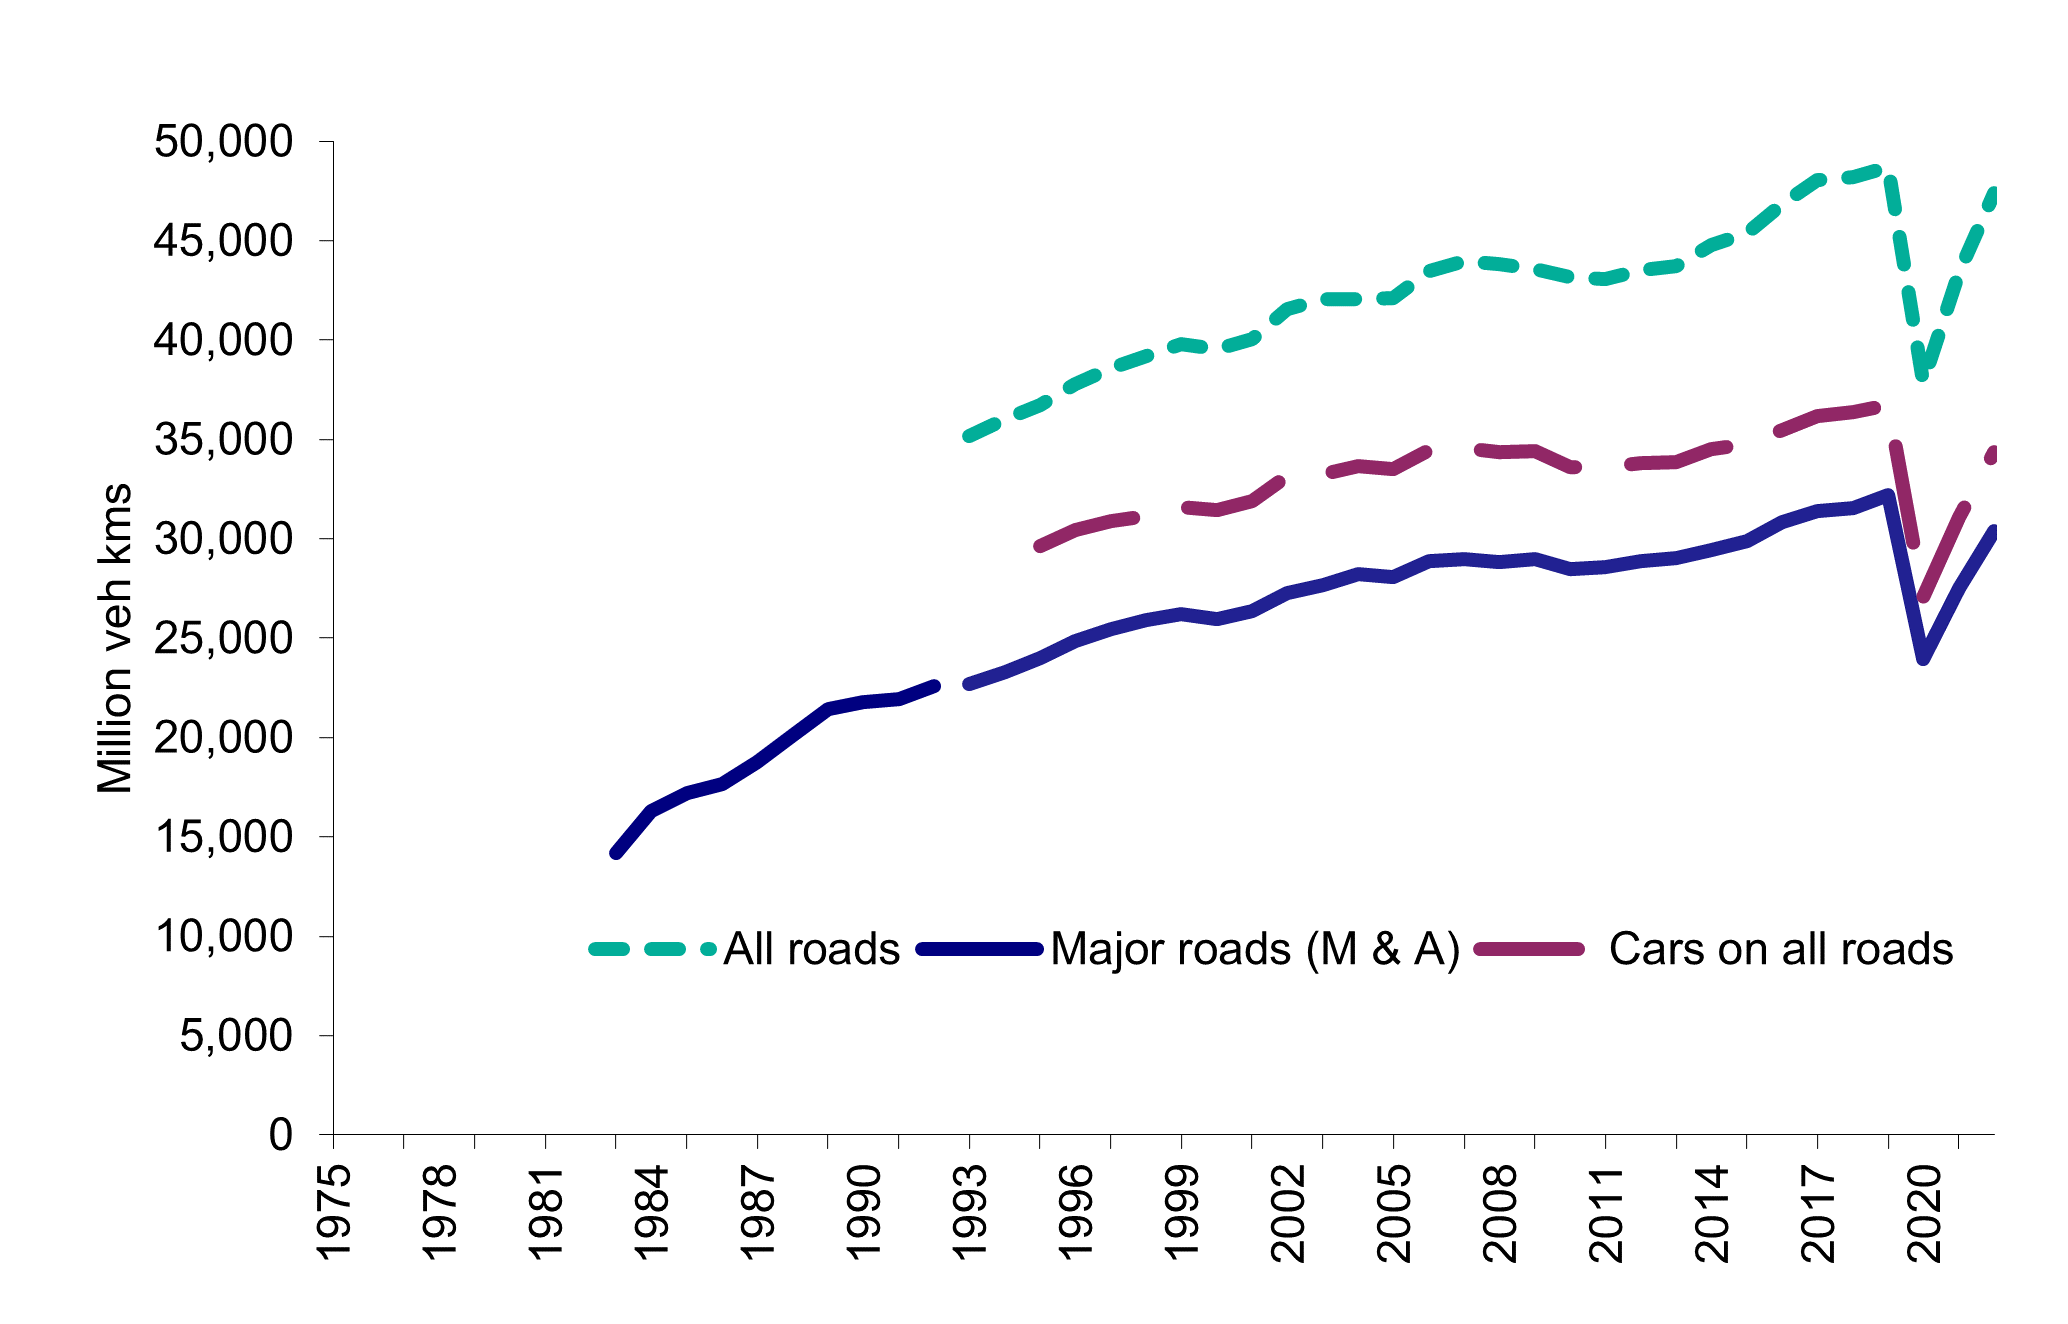
In 2022, 47.4 billion vehicle kilometres were travelled, an increase of 9% compared to the previous year, but 3% less than in 2019.
Prior to the pandemic, the volume of traffic on major roads (Motorways and A roads) had more than doubled since 1983, from an estimated 14,185 million vehicle kilometres to around 32,000 million vehicle kilometres in 2019 [Figure 2].
Car and van users reported that 10% of journeys were delayed due to traffic congestion in 2022.
Road casualties
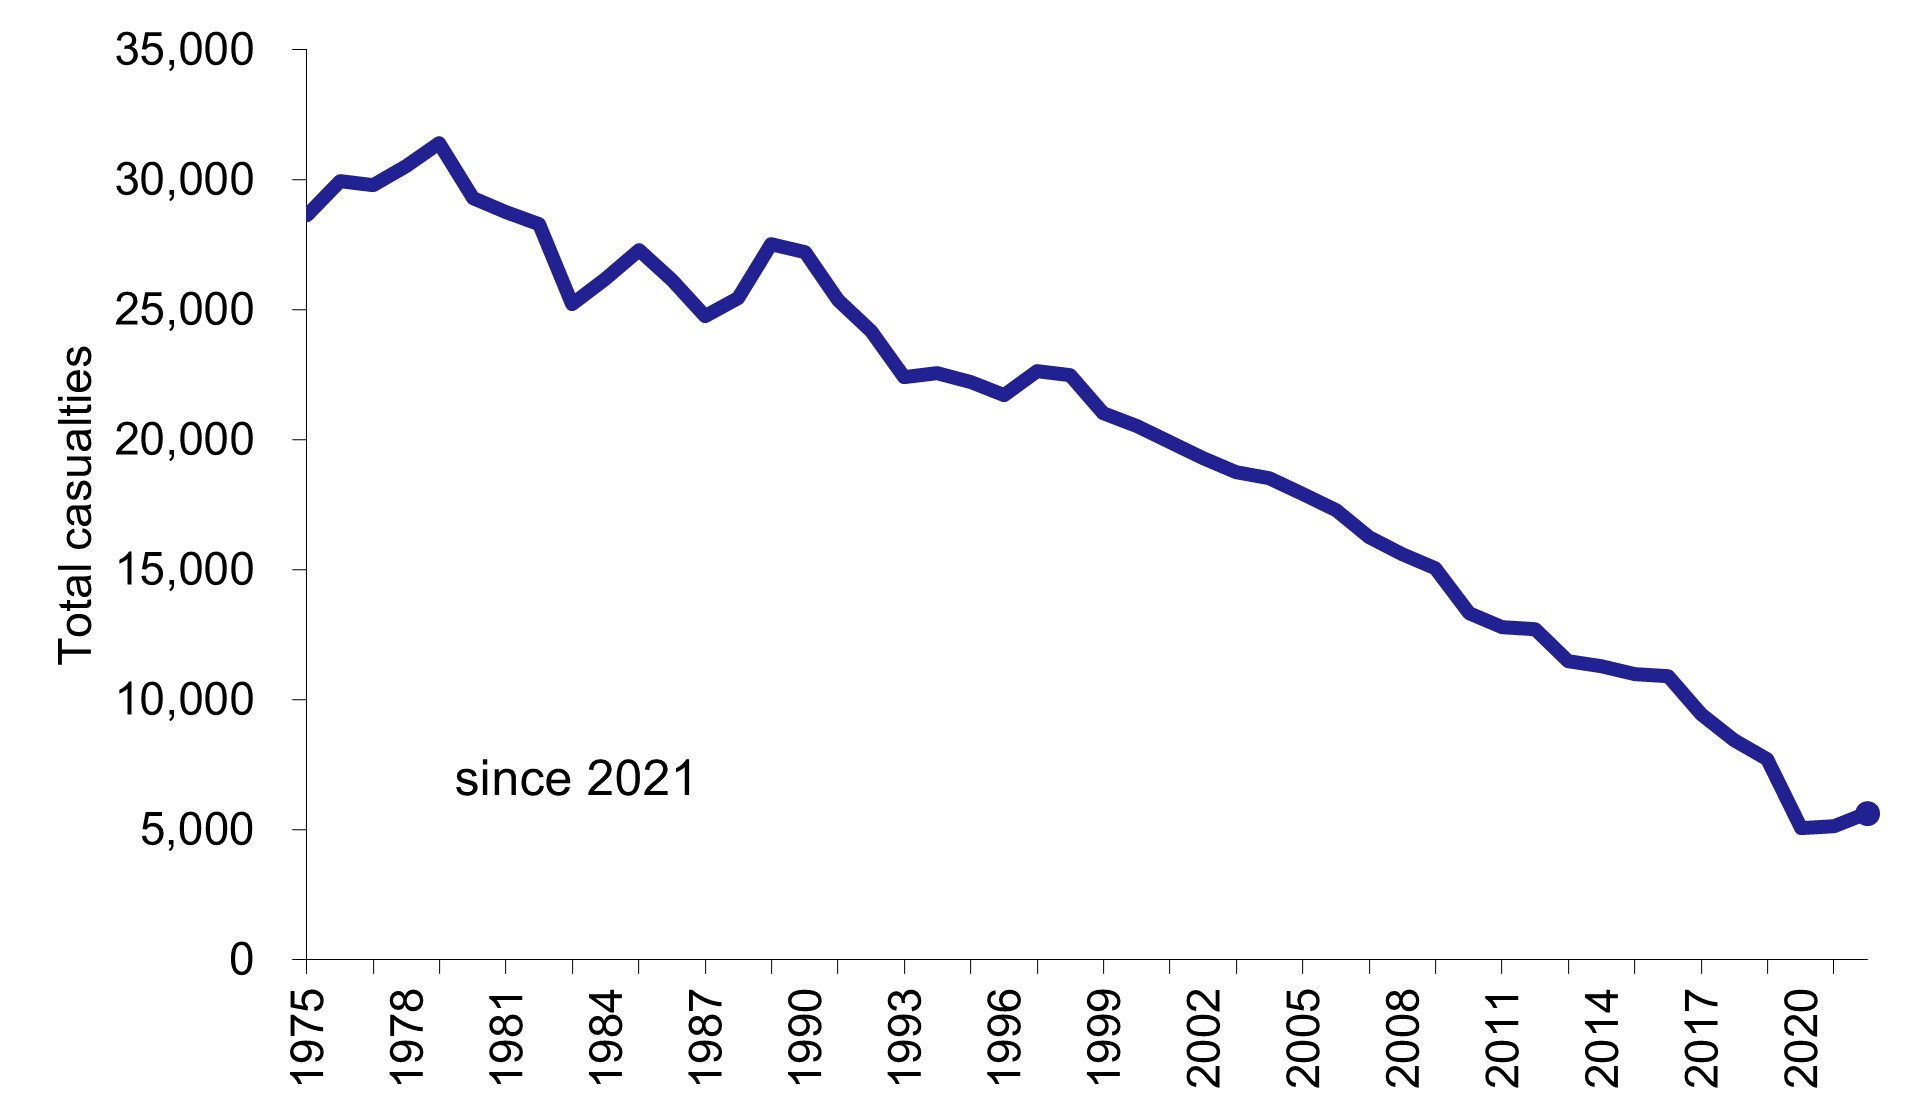
In 2022, 173 people were killed and 1,776 seriously injured in road collisions.
The total number of casualties on Scottish roads rose 10% between 2021 and 2022. These latest figures will have been influenced by the latest increase in traffic. However, prior to the pandemic recorded casualties were declining [Figure 3]. The total number of road casualties decreased by 56% over the last decade. Casualties of all severities have fallen over this period.
In Scotland in 2022, for every thousand people in the population, 0.36 were killed or seriously injured in road collisions, compared to 0.45 for Great Britain.
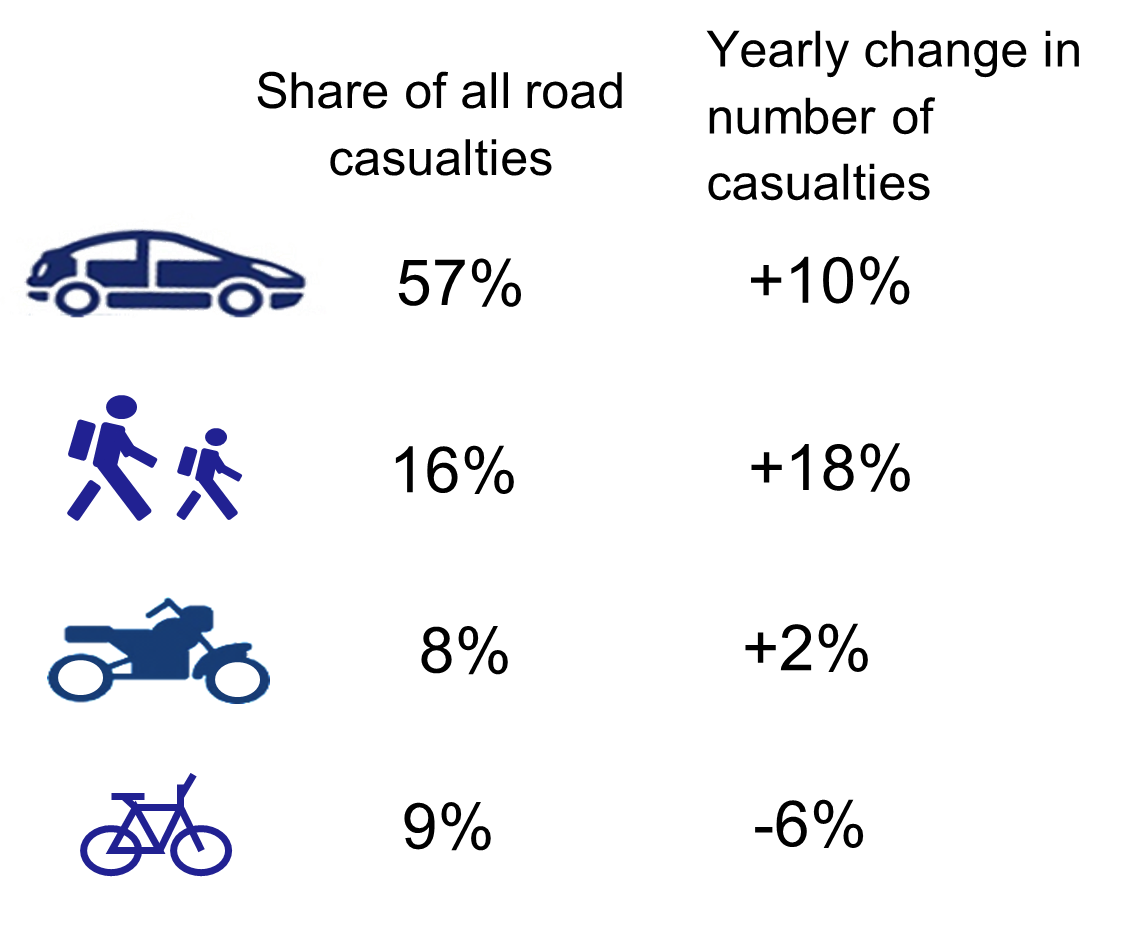
In 2022, car users accounted for over half of all casualties (57%), with car casualties increasing by 10% and pedestrian casualties increasing by 18% in 2022 [Figure 4].
Public transport: bus, rail, air and ferry
Local bus and rail services
Bus
Bus travel in Scotland was profoundly affected by the Covid-19 pandemic, with restrictions on travel and daily activity in place for large parts of 2020 and some of 2021.
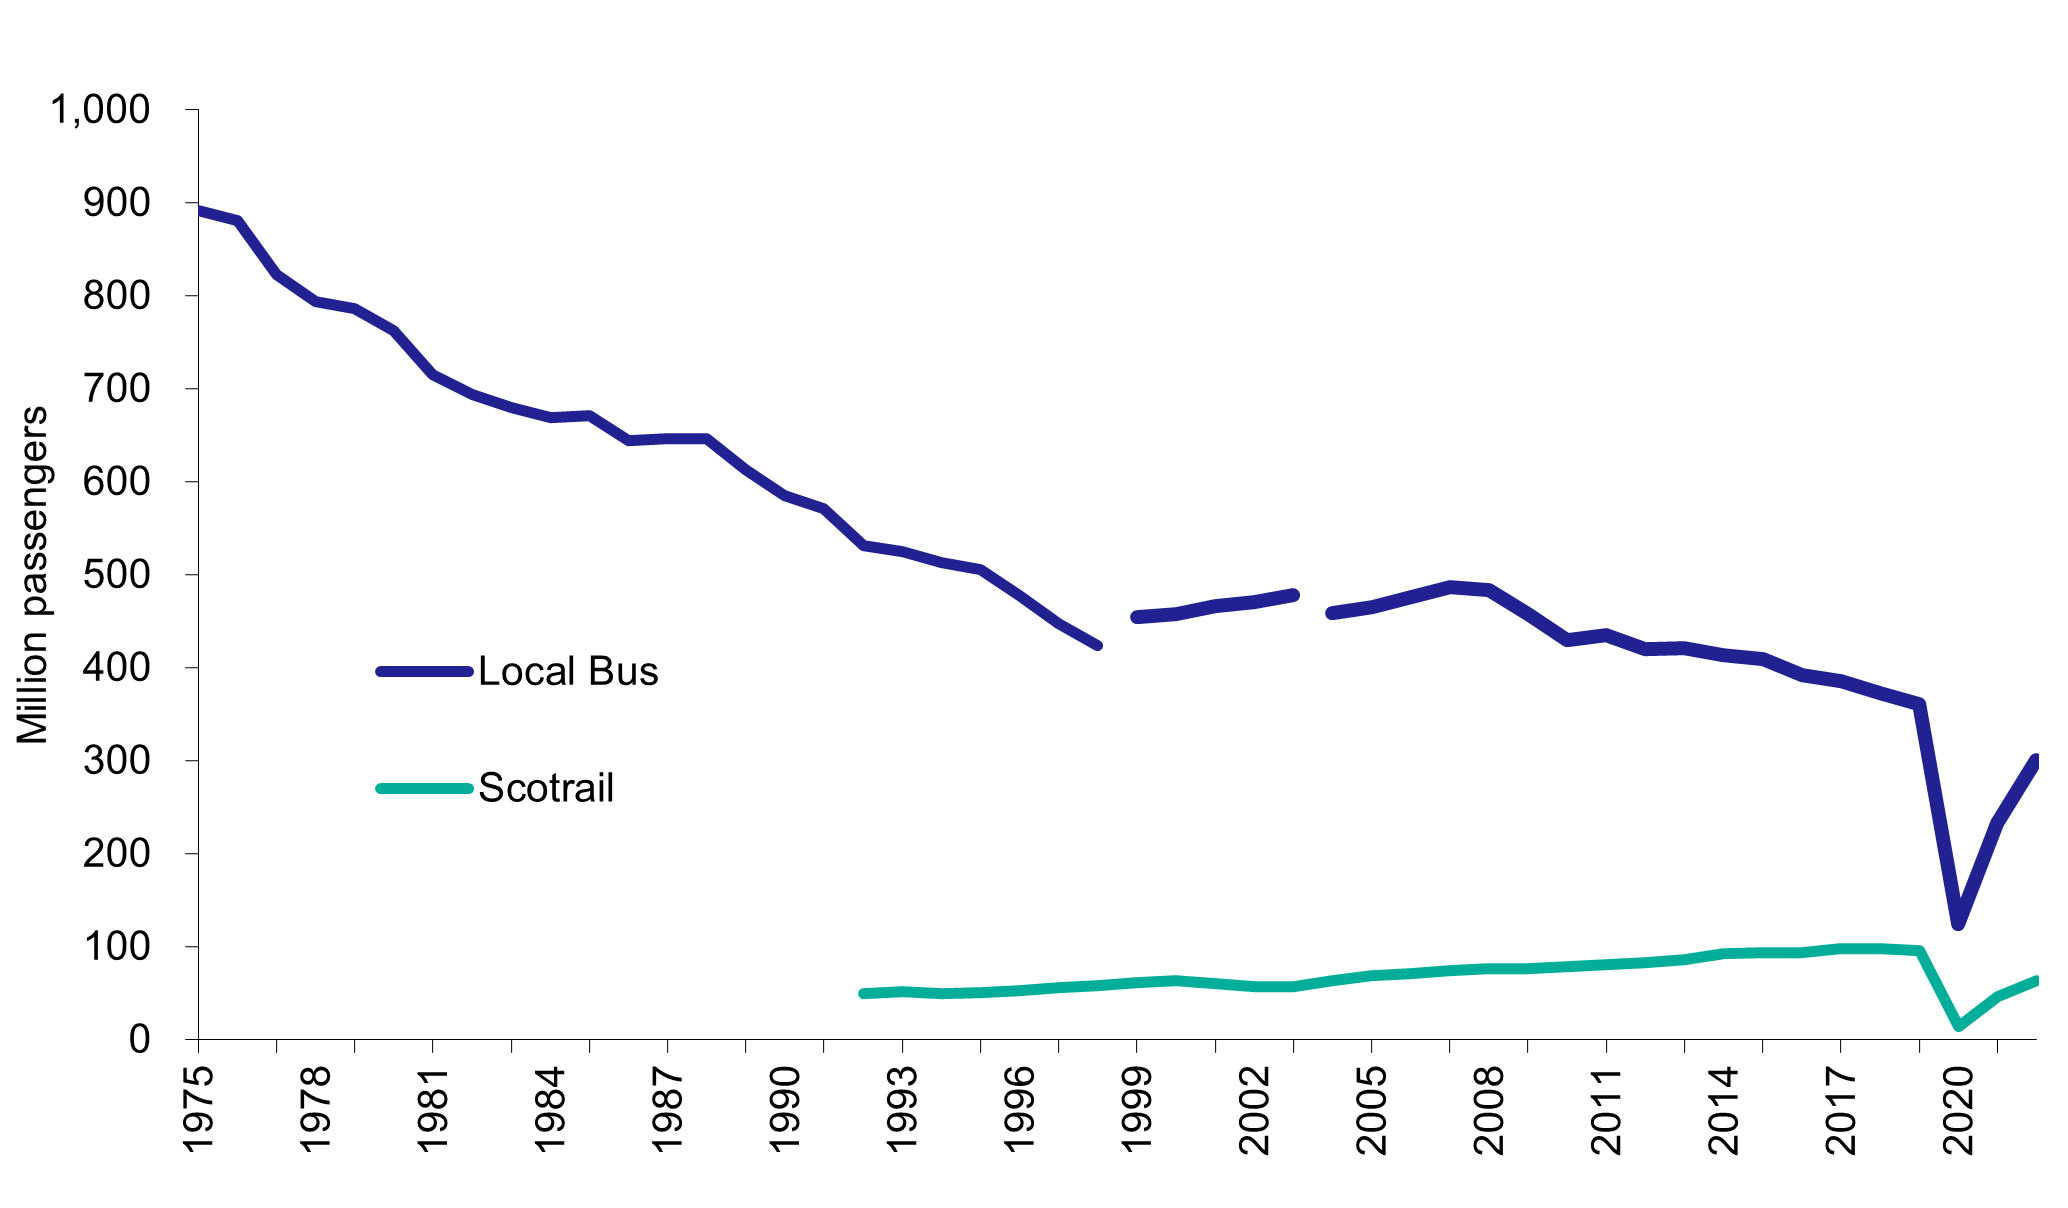
In 2022, there were 301 million bus passenger journeys, an increase of 29% on the previous year [Figure 5]. One half of all bus journeys in 2022 were made under the National Concessionary Travel scheme, 12 per cent more than 2021. In early 2022, the scheme was expanded to include those aged under 22.
Prior to the pandemic, bus passenger journeys had been falling over the longer term. The figures almost halved between 1960 and 1975 and roughly halved again by 2019.
The distance covered by local bus services (expressed in terms of ‘vehicle kilometres’) can be seen as a measure of bus service provision. Although this fell in 2022 by 5%, the number of passengers carried still rose by 29%.
Rail
Rail travel in Scotland was profoundly affected by the Covid-19 pandemic, with restrictions on travel and daily activity in place for large parts of 2020 and some of 2021.
There were 63.7 million ScotRail passenger journeys in 2022-23, an increase of 36% from 2021-22 [Figure 5].
Prior to the pandemic, rail patronage had been rising steadily and but it was 23% lower in 2022-23 compared to 2012-13.
The distance covered by scheduled trains in Scotland rose by 1% in 2022-23. However, this was not to the same scale as the increase in passenger numbers (36%).
Air and ferry passengers
Air
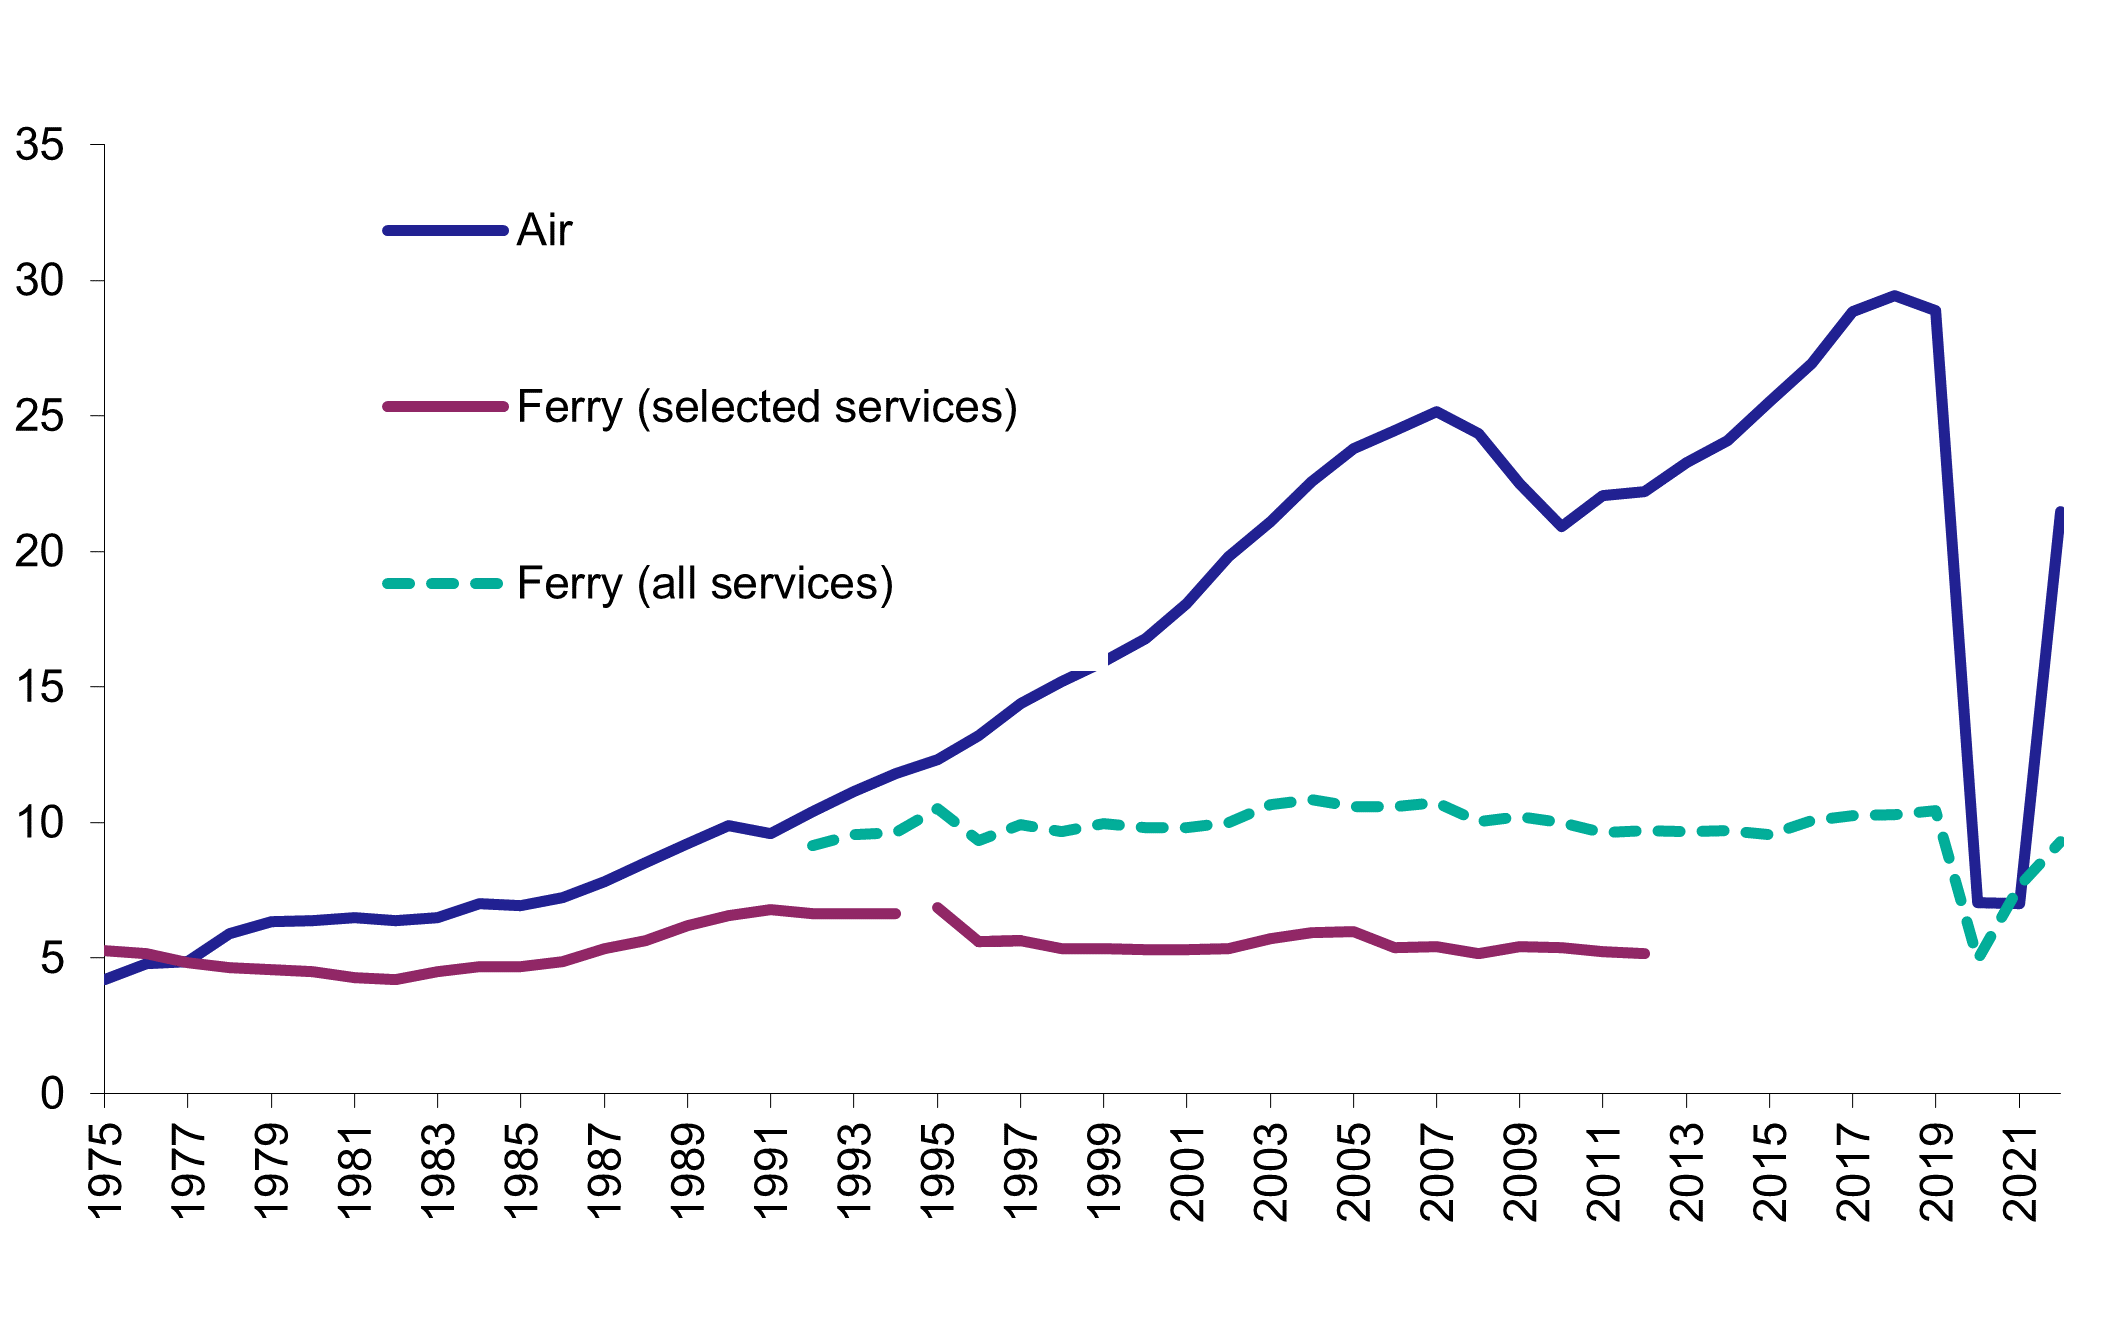
There were 21.5 million air terminal passengers in 2022, up 207% compared to the previous year, but 26% lower than in 2019. Prior to the pandemic, air passenger numbers had been increasing over time, with a 28% increase in the ten years up to 2019 [Figure 6].
In 2022, 4.4% of all terminal passenger traffic was from within Scotland, 34% was to or from other parts of the UK, 55% was between Scotland and mainland Europe.
Ferry
In 2022, 9.3 million passengers travelled by ferry (including traffic within Scotland and to and from Northern Ireland), a 21% increase on the previous year [Figure 6].
Across all ferry routes, 3 million vehicles were carried in 2021 (including traffic between Scotland and Northern Ireland and within Scotland), a 46% increase on the previous year.
Personal travel (e.g. driving, walking and cycling; travel to work and school)
In 2022, 73% of people aged 17 or over had a full driving licence. The proportion of men aged 17+ holding a licence was higher than women (80% compared to 68%).
34% of people drove every day in 2022, with around 75% of households having access to at least one car.
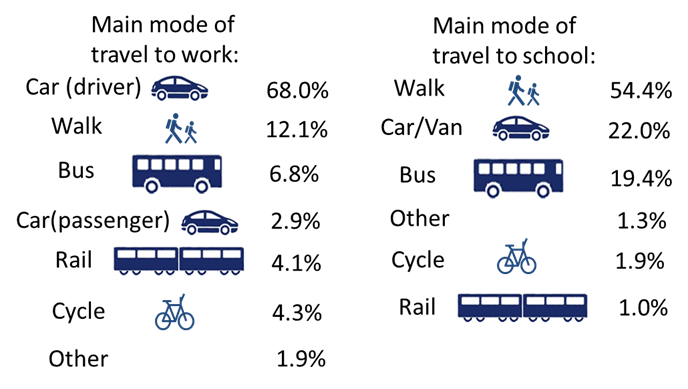
Thirty one per cent of employed people reported that they currently worked from home. Of those that travelled to work in 2022, 30% of journeys to work were by public or active travel [Figure 7].
Fifty eight per cent of people were either very or fairly satisfied with public transport in 2022, a drop from 68% in 2019.
Cross-border transport
As with transport more generally, cross-border transport was significantly affected by the Coronavirus pandemic. In 2022, there were 9 million air and ferry passenger journeys to other parts of the UK, an increase of 79% since 2021. The majority of these journeys were made by air (7.3 million).
The most recently available figures for cross-border rail journeys are for 2021 and cover the pandemic period. These show 7.4 million passenger journeys were made to other parts of the UK in 2021.
In 2022, 12.9 million passenger journeys were made to and from other countries by air, an increase of 26% since 2012.
Environment and emissions
The most recently available figures for transport emissions relate to 2021.
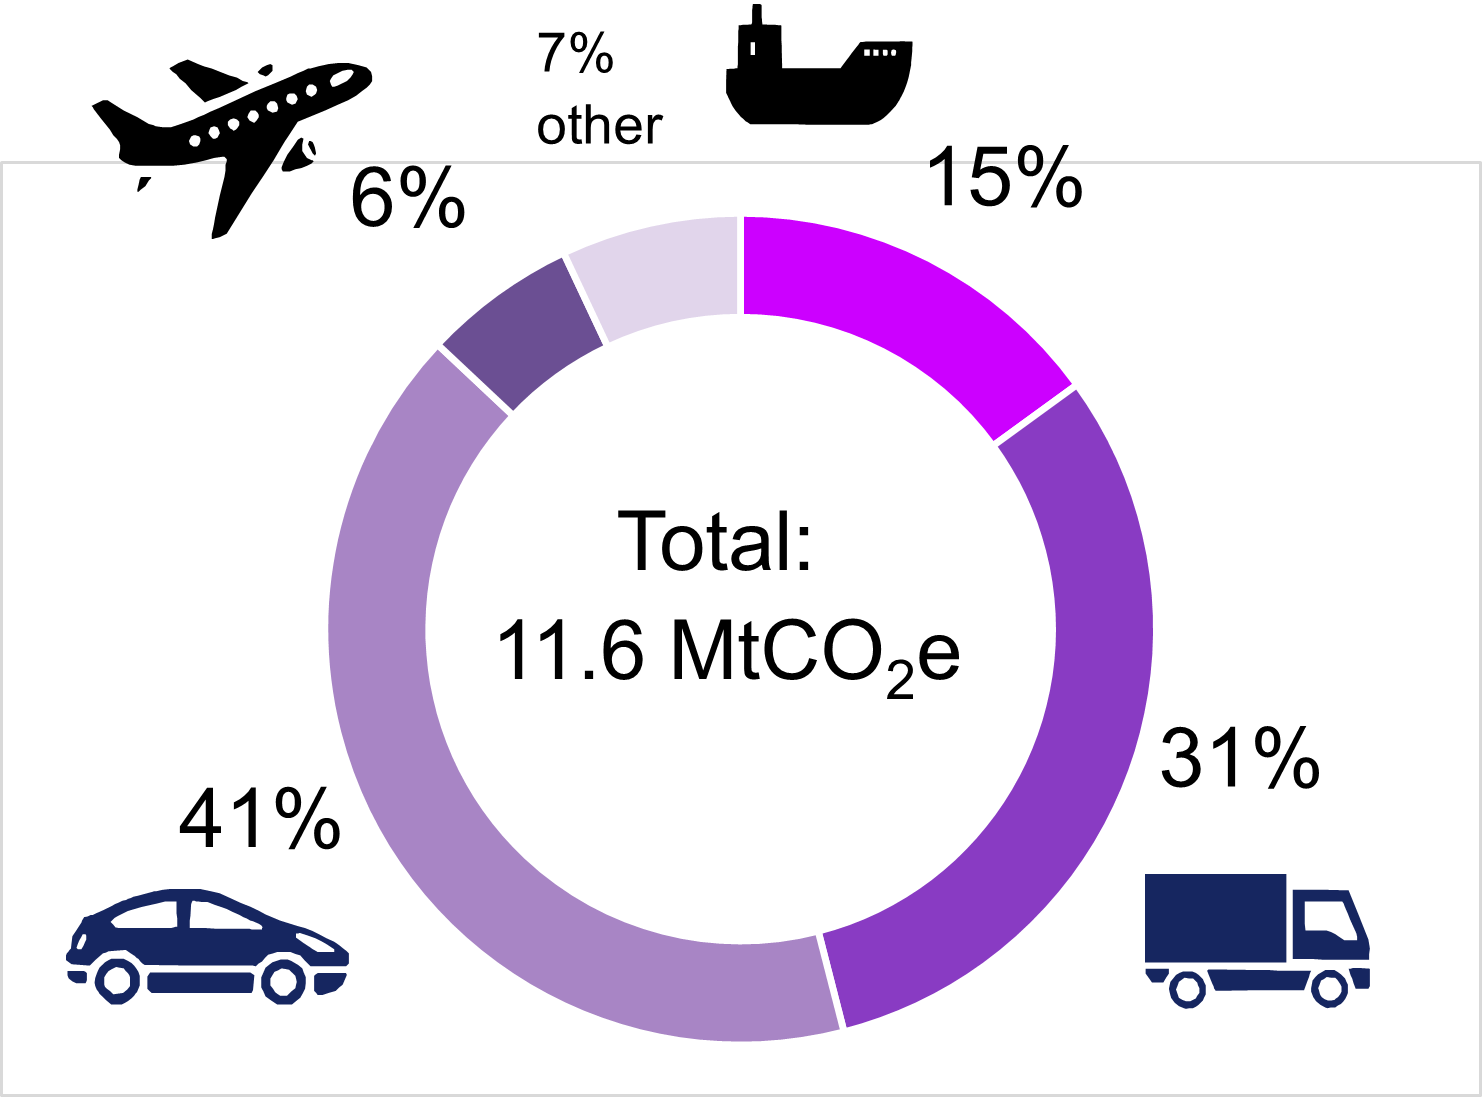
Transport accounted for 27.9% of Scotland’s total greenhouse gas emissions in 2021. Scotland’s transport emissions in 2021 were 12.4% higher than in 2020, and 22.0% lower than in 1990.
In 2021, passenger cars accounted for 41% of transport greenhouse gas emissions
Over the longer term, newly registered cars have become more efficient in terms of carbon dioxide emissions, with average CO2 emissions in Scotland for new car registrations falling by 11% over the last ten years..
At the end of 2022, ultra-low emission vehicles (ULEVs) accounted for 2.1% of vehicles licensed in Scotland , an increase from 1.4% at the end of 2021.
Official Statistics
These statistics are official statistics. Official statistics are statistics that are produced by crown bodies, those acting on behalf of crown bodies, or those specified in statutory orders, as defined in the Statistics and Registration Service Act 2007.
Scottish Government statistics are regulated by the Office for Statistics Regulation (OSR). OSR sets the standards of trustworthiness, quality and value in the Code of Practice for Statistics that all producers of official statistics should adhere to.
Data and Methodology
Information on the notes, definitions and sources for each of the chapters in the publication can be found in the individual chapter user guides.
Tell us what you think
We are always interested to hear from our users about how our statistics are used, and how they can be improved.
Tables
Feedback survey
We’d appreciate it if you would complete our short feedback survey on this publication.
Enquiries
For enquiries about this publication please contact:
Andrew Knight
Transport Scotland Analytical Services
E-mail: transtat@transport.gov.scot
For general enquiries about Scottish Government statistics please contact:
Office of the Chief Statistician
e-mail: statistics.enquiries@gov.scot
Join our mailing list
If you would like to receive notification about statistical publications, or find out about consultations on our statistics please join the ScotStat mailing list.
Future publications
Details of future publications can be found on our forthcoming publications page.
Tables in Excel format
Notes
Note 1
DfT has revised the figures for the light goods and goods body types back to 2001. DfT does not have the underlying data to revise earlier years' figures.
Note 2
Financial years
Note 3
The DfT have revised figures from 2004/05 onwards as a result of methodological improvements. Figures prior to this period are not directly comparable. See Chapter 2 for more detail. Figures from 2006 include Government support for buses which is not available for the two previous years. Pasenger numbers for 2016 to 2021 have been revised. Vehicle Kms for 2014 to 2021 have been revised.
Note 4
Following a methodology change from paper to online data collection, it has been concluded that road goods data before and after July to September 2021 (quarter 3) should not be compared. Data is presented as a 12 month figure for the period ending June 2022. More details on the methodology change and results from an investigation.
Note 5
The estimated amounts of crude oil and products carried by pipelines over 50km in length. 2012 figures are provisional.
Note 6
ScotRail introduced a new methodology which better estimates Strathclyde Zonecard journeys from 2009/10. Figures from 2003/04 onwards present the impact of this on previously reported data to provide a more meaningful year on year comparison. Note that this has no impact on actual journeys undertaken.
Note 7
The Office of Rail and Road (ORR) produce total passenger figures. These are not adjusted to reflect ScotRail's revised methdology and are therefore not comparable with ScotRail figures. There is a series break between 2007-08 and 2008-09 due to a change in the methodology. From 2008-09 estimates of PTE travel (zone cards) are included.
Note 8
Services to Europe, Northern Ireland and within Scotland (Previous versions of STS only included services where data is available back to 1975, this can still be found in Table H1). Figures for passenger numbers on the Corran ferry service in 2013, 2014 and 2015 have not been included in the total for Scotland as the figures are new estimates and considered as ‘data under development'.
Note 9
Note 10
Totals have been revised in 2012 to include slip roads on Trunk A roads which had previously excluded. See Road Network chapter for more information.
Note 11
Changes in the layout of the M74/M77/M8 during 2012 are likely to have affected the traffic data for motorways.
Note 12
Due to changes in the the way casualty severities are recorded, killed/serious figures prior to 2004 are not comparable with later years.
Note 13
Changes in the layout of the M74/M77/M8 during 2012 are likely to have affected the traffic data for motorways.
Note 14
Estimates for the period since 2010 have been revised to take into account the minor road benchmarking exercise. Further details available at: https://www.gov.uk/government/publications/road-traffic-statistics-minor-road-benchmarking
Note 15
The figures from 2018 onwards are not comparable with previous figures, as they are collected in a different way.
Note 16
https://www.gov.uk/government/publications/road-traffic-statistics-minor-road-benchmarking
Note 17
The apparent year-to-year fluctuations in some of the figures may be due to sampling variability.
Note 18
1999 to 2007 results can be viewed by unhiding columns E to M.
Note 19
The Travel diary methodology changed in 2007 and in 2012, creating a break in the time series.
Note 20
Employed adults (aged 16+) not working from home
Note 21
Figures for 2017 travel to work by car or van an by train have been revised from 67.7 an 5.1.
Note 22
Tram journeys were not included in publications before 2018. They have now been added, and the 2016 figure is 0.1% higher than previous published.
Note 23
Figures for 2017 Travel to school by car or van have been revised from 25.5.
Note 24
From 2012 Q4 the question was changed to ask about access to cars / vans instead of just cars.
Note 25
Data published in 2015 erroneously included a value of 12.5 because of the exclusion of vans; this table contains the revised data.
Note 26
England, Wales or Northern Ireland - for the purposes of this table, UK offshore is not counted as another part of the UK.
Note 27
Scotland / Northern Ireland ferries
Note 28
Figures for 1999 and earlier years are available on the website. They are approximate as they include an element of estimation.
Note 29
The Rosyth/Zeebrugge service started in May 2002, there was a drop in the frequency of service from November 2005 and the passenger service ceased in December 2010. Figures for services between Lerwick and other countries are available from 1998.
Note 30
Freight lifted by UK HGVs only - does not include freight carried by other HGVs or by other types of vehicle (such as light goods vehicles). The figures for 2004 onwards are not directly comparable with earlier years, due to changes to the survey's methodology & processing.
Note 31
The Rail figures for 'outwith UK' include freight taken to Scottish, English or Welsh ports for export.
Note 32
Figures relate only to exports/imports from major ports only. Note these have increased over the years.
Note 33
The Rail figures for 'outwith UK' include freight imported at an English or Welsh port, then brought into Scotland by rail.
Note 34
Figures are for combined years e.g. 2011 covers 2011/12.
Note 35
DfT revised its methodlogy from 2004, causing a break in the series. Pasenger numbers for 2016 to 2021 have been revised.
Note 36
The GB figures relate to motor vehicle traffic only, and therefore exclude a small amount of pedal cycle traffic. Estimates for the period since 2000 have been revised following the minor road review. Further details are available in the technical report, available at: https://www.gov.uk/government/publications/road-traffic-statistics-guidance
Note 37
Financial years
Note 38
Total passenger figures are produced by the ORR and have not been adjusted to reflect ScotRail's revised zonecard methdology.
Note 39
Figures are based on the origin and destination of trips and do not count stages of these trips separately.
Note 40
The estimated amounts of crude oil and products carried by pipelines over 50km in length. 2012 figures are provisional.
Note 41
These figures are for freight lifted by Heavy Goods Vehicles. The GB figures are for freight transported within GB; the Scottish figures include small amounts of freight destined for Northern Ireland and outside the UK.
Note 42
Domestic freight estimates for 2006 to 2009 were revised on 27 October 2011.
Note 43
Figures for 2008-09 onwards have been revised due to an error in the LENNON calculation of journeys between Edinburgh and Glasgow.
Note 44
Figures are based on the origin and destination of trips and do not count stages of these trips separately
Note 45
Due to changes in the the way casualty severities are recorded, killed/serious figures prior to 2004 are not comparable with later years.
Note 46
The figures from 2018 onwards are not comparable with previous figures, as they are collected in a different way.
Note 47
The figures for Car and Air are for calendar years; latterly, the figures for Bus and Rail are for the financial years which start in the specified calendar years (eg the 1996 figures are for 1996-97)
Note 48
Pre-1975, the figures are the totals of passenger journeys for the Scottish Bus Group and the four city corporations. Therefore, they include any non-stage (non-local) services run by these operators, and exclude other operators' stage (local) services. Glasgow Corporation's figures may have included passenger journeys on trolley buses and the Glasgow Underground. Figures from 2004 onwards have been subject to revision due to methodological improvements.
Note 49
Figures from 1995 onwards were revised by ORR in 2013 due to improvements to methodology. There is a series break between 2007-08 and 2008-09 due to a change in the methodology. From 2008-09 estimates of PTE travel (zone cards) are included. Figures in 2001-02 and 2002-03 were affected by industrial action.
Note 50
This grouping was used in STS until 2012 and includes those routes for which figures are available back to 1973: Caledonian MacBrayne, P&O Scottish Ferries / NorthLink Orkney and Shetland Ferries, and Orkney Ferries. The figures from 1995 are affected by the reduction in traffic caused by the withdrawal of the Kyle-Kyleakin service when the Skye Bridge opened in October 1995.
Note 51
All ferry routes within Scotland, between Scotland and Northern Ireland and between Scotland and Europe, for which passenger data is availabe (see chapter 9 for more detail)
Note 52
Due to changes in the survey in response to covid-19, 2020 data is not directly comparable with previous years, so there is a break in the time series between 2019 and 2021
Note 53
The figures for 'road', 'rail', 'coastwise shipping' and 'inland waterways' are the total amounts lifted in Scotland. The category of 'coastal shipping' is shown for historical reasons. It is defined in a different way: the 'coastal shipping' figure is the total lifted in Scotland plus the total lifted elsewhere in the UK which is delivered in Scotland. The 'pipeline' figure is the estimated amount of crude oil carried by on-shore pipelines which are over 50km in length. This table does not show one port traffic to / from oil rigs and the sea bed.
Note 54
The figures are all for calendar years except for the figures for 'rail' from 1985, which are for the financial years which start in the specified calendar years (e.g. the rail figures for 1997 are for 1997-98).
Note 55
The estimated amounts of crude oil and products carried by pipelines over 50km in length. 2012 figures are provisional.
Note 56
A new system for collecting port statistics was introduced in 2000. Data prior to that are on a different basis.
Note 57
Changes to the methodology for collecting road freight data mean that previous figures are not comparable.
Note 58
Domestic freight estimates for 2006 to 2009 were revised on 27 October 2011
Note 59
Domestic freight estimates from 2011 to 2016 were revised in 2018
Note 60
The figures from 2018 onwards are not comparable with previous figures, as they are collected in a different way.
Note 61
The figures for 'road', 'rail', 'coastwise shipping' and 'inland waterways' relate to freight lifted in Scotland;for 'pipeline' it is the estimated tonne-kilometres for crude oil carried by on-shore pipelines which are over 50km in length. This table does not show the tonne-kilometres for one port traffic to / from oil rigs and the sea bed or for coastal shipping (as defined in part [a] of this table).
Note 62
The figures are all for calendar years except for the figures for rail which are for the financial years which start in the specified calendar years
Note 63
Over 50km
Note 64
A new system for collecting port statistics was introduced in 2000. Data prior to that are on a different basis.
Note 65
Changes to the methodology for collecting road freight data mean that previous figures are not comparable.
Note 66
Pipeline figures for 2012 are provisional.
Note 67
Revisions made to rail freight from 2001 onwards due to an error in the formula for calculating the figures
Note 68
Domestic freight estimates from 2011 to 2016 were revised in 2018
Note 69
The increase in motorway traffic in 2012 is the result of new motorway opening. More detail can be found in the road network chapter.
Note 70
Estimates for minor roads for the period since 2000 have been revised to take into account the minor road benchmarking exercise. Further details available at: https://www.gov.uk/government/statistics/road-traffic-estimates-in-great-britain-2021/minor-road-traffic-estimates-review-technical-report
Note 71
The figures for vehicles licensed for 1974 to 1978 are on different bases, due to the effect on the annual 'census' of the transfer of licensing records from local offices to the then DVLC
Note 72
For years up to 1992 estimates are taken from the DVLA annual vehicle census, from 1993 onwards estimates are taken from the Vehicle Information Database and are not consistent with previous years. The VID figure for 1992 was 1,840,000 compared with the DVLA figure of 1,884,000.
Note 73
New registration results to 1994 are taken from geographical analysis provided by DVLA. Results for 1995 onwards are estimated using post town area data. The vehicle taxation system was subject to major revisions from July 1995.
Note 74
DfT has revised the figures for the light goods and goods body types back to 2001. DfT does not have the underlying data to revise earlier years' figures.