3. Seatbelt survey results
Seatbelt and Mobile Phone Usage Survey Scotland, 2017
3. Seatbelt survey results
The 2017 seatbelt survey resulted in 5,391 eligible vehicles and 7,169 vehicle occupants being observed in Scotland.
Key findings
- seatbelt use was recorded at 97.3% for all drivers, a marginal increase from 96.4% in 2014
- the seatbelt wearing rate for car drivers in 2017 was 98.6%, compared to 98% in 2014
- 'other vehicle' (vans, lorries, buses, coaches, and mini-buses) driver seatbelt use has increased from 88.5% in 2014 to 92.5% in 2017
- there has been a decrease in the proportion of rear seat passengers observed wearing their seatbelt from 99% in 2014 to 95.1% in 2017. However, this is largely driven by inclusion of 'other vehicles' (vans, lorries, buses, coaches, and mini-buses) in the 2017 survey as the 2014 survey only recorded rear seat passengers in cars
- seatbelt compliance amongst occupants of 'other vehicle' types (vans, lorries, buses, coaches and mini-buses) was substantially lower, with wearing rates of 92.5% for drivers, 95% for front seat passengers, and 52.8% for rear seat passengers
The majority of the results are based on data recorded during weekday observations, except from those sections which explicitly discuss weekends.
In addition, results presented in sections 3.3 to 3.7 focus solely on seatbelt use by car occupants due to small sample sizes for 'other vehicles'.
Figures relating to the seatbelt rates in England and across Great Britain have been provided by the Department of Transport, some of which have been calculated in a different way from the figures of Scotland. For example, the DfT car category does not include taxi and private hire occupants. However, broad comparisons of headline figures should be reliable. Further information and comparisons are available in the DfT (2019) publication Seatbelt and Mobile Phone Use Surveys: Great Britain, 2017.
3.1. Overview of observations
The 2017 seatbelt survey resulted in 5,391 eligible vehicles and 7,169 vehicle occupants being observed in Scotland. The majority of vehicles were cars, excluding taxis and private hire vehicles (4,397, 81.6% of the total).
Larger numbers of observations produce more reliable results when weighted, so it can be assumed that the seatbelt compliance estimate for car drivers is more accurate than that for drivers of other vehicles and all passengers.
Further information on the number of observations is provided in table 3.1 below.
| Vehicle type | Driver | Front seat passenger | Rear seat passenger |
|---|---|---|---|
| Car | 4,397 | 1,212 | 352 |
| Other vehicle | 994 | 187 | 27 |
| All vehicles | 5,391 | 1,399 | 379 |
3.2. Overall seatbelt use
The proportion of drivers observed correctly using a seatbelt in 2017 was 97.3%, an increase from the 96.4% observed in 2014. Seatbelt use for drivers of 'other vehicles' (vans, lorries, and buses) in particular has increased from 88.5% in 2014 to 92.5% in 2017.
An increase of seatbelt usage among front seat passengers was also recorded, rising from 96.7% in 2014 to 98.7% in 2017. However, the level of rear seat passengers appears to have decreased from 99% in 2014 to 95.1% in 2017. This is largely due to the fact that the 2014 survey only recorded rear seat passenger seatbelt usage for cars, while the 2017 survey includes 'other vehicles' which have lower usage rates overall but particularly for rear seat passengers (see table 3.2). Rear seat passengers in cars were significantly more likely to wear seatbelts compared to rear seat passengers in other vehicles, 98.4% compared to 52.8%. However, it should be noted that the sample size for rear seat passengers in 'other vehicles' was very small (see table 3.2).
| Seat position | Vehicle type | Seatbelt use | Sample size |
|---|---|---|---|
| Driver | All vehicles | 97.3% | 5,391 |
| Car | 98.6% | 4,397 | |
| Other vehicle | 92.5% | 994 | |
| Front seat passenger | All vehicles | 98.7% | 1,399 |
| Car | 99.4% | 1,212 | |
| Other vehicle | 95.1% | 187 | |
| Rear seat passenger | All vehicles | 95.1% | 379 |
| Car | 98.4% | 352 | |
| Other vehicle | 52.8% | 27 |
In line with this trend, a greater proportion of car drivers were observed using a seatbelt compared to 'other vehicles' (98.6% compared to 92.5%), which was also the case for front seat passengers (99.4% versus 95.1%)
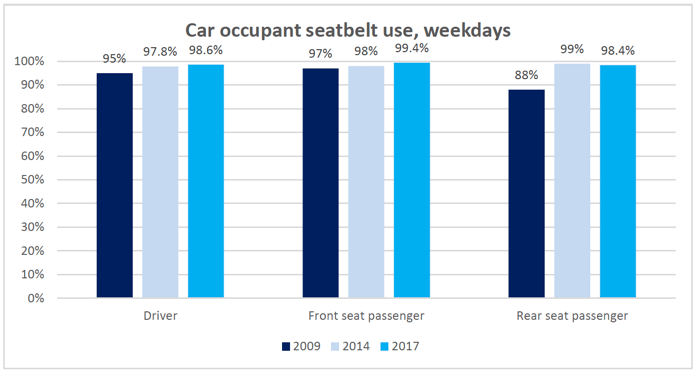
The 2017 results for Scotland show marginal increases in seatbelt usage rates for car drivers and front seat passengers compared to 2014, while rates for rear seat passengers have decreased slightly, although still remaining significantly higher than the 2009 level (see figure 3.1)
Figure 3.1

The seatbelt rates for drivers in Scotland were slightly higher compared to drivers in England, Wales, and Great Britain (see table 3.3). For passengers, usage rates were notably higher in Scotland compared to England and Wales, and Great Britain.
| Driver | Sample size | Front seat passenger | Sample size | Rear seat passenger | Sample size | |
|---|---|---|---|---|---|---|
| Great Britain | 96.5% | 15,745 | 93.1% | 4,152 | 90.7% | 1,093 |
| England and Wales | 96.0% | 10,354 | 90.4% | 2,753 | 88.3% | 714 |
| Scotland | 97.3% | 5,391 | 98.7% | 1,399 | 95.1% | 379 |
It should be noted that the Scotland figures are based on smaller sample sizes those of England and Wales and Great Britain.
3.3. Seatbelt use by gender
Analysis of the data according to gender revealed that female drivers tended to be slightly more likely to wear a seatbelt than their male counterparts (see table 3.4). While the 2014 survey suggested this gap was showing signs of narrowing, the gap for drivers has increased slightly based on the 2017 data. Overall, the seatbelt wearing rates of passengers were found to be similar across gender.
| Seat position | Gender | Scotland 2009 | Scotland 2014 | Scotland 2017 | 2017 Scotland sample size |
|---|---|---|---|---|---|
| Driver | Male | 93% | 97.7% | 97.9% | 2,437 |
| Female | 97% | 98.2% | 99.4% | 1,916 | |
| Front seat passenger | Male | 96% | 98.0% | 99.0% | 399 |
| Female | 98% | 98.2% | 99.5% | 765 | |
| Rear seat passenger | Male | 79% | 99.4% | 97.9% | 116 |
| Female | 89% | 99.3% | 98.2% | 175 |
3.4. Seatbelt use by age
Car occupant seatbelt use was found to be consistently high (above 98%) across all age categories. Seatbelt use has increased for occupants in all seating positions (drivers, front seat and rear seat passengers), except for rear seat passengers over the age of 14 which has decreased, and for front seat passengers over 60 which has remained static (see table 3.4). There was a notable increase in the usage rate for child front seat passengers which is now at 100% compared to 94.3% in 2014. However, the small sample size for this category (n=99) should be noted.
| Seat position | Age | Scotland 2009 | Scotland 2014 | Scotland 2017 | 2017 Scotland sample size |
|---|---|---|---|---|---|
| Driver | 17-29 | 96% | 98.2% | 99.2% | 566 |
| 30-59 | 94% | 97.8% | 98.2% | 2,976 | |
| 60+ | 96% | 98.0% | 99.7% | 827 | |
| Front seat passenger | 0-13 | 97% | 94.3% | 100.0% | 99 |
| 14-29 | 97% | 98.1% | 99.6% | 239 | |
| 30-59 | 98% | 98.0% | 99.1% | 538 | |
| 60+ | 98% | 99.5% | 99.5% | 308 | |
| 14+ | 98% | 98.5% | 99.3% | 1,085 | |
| Rear seat passenger | 0-13 | - | 98.6% | 100.0% | 186 |
| 14+ | 75% | 99.3% | 98.4% | 148 |
A 100% seatbelt rate was also found for rear seat passengers below the age of 14. However, the small sample size (n=186) should be considered here also.
3.5. Seatbelt use by area and road type
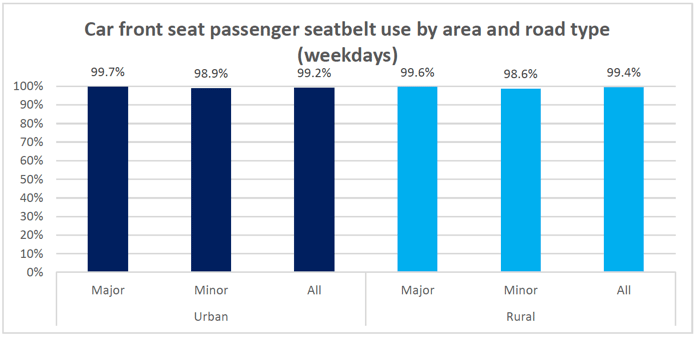
Seatbelt wearing rates by car drivers have increased on the 2014 levels for all road types in rural areas, and most significantly, for drivers on minor roads where seatbelt use was recorded at 99.6% compared to 97.6% in 2014. However, it is worth noting that the sample size for this category is significantly smaller than the other categories. For urban areas, seatbelt use has marginally increased for major roads while remaining at 98.3% for minor roads (see table 3.6).
| Area type | Road type | Scotland 2009 | Scotland 2014 | Scotland 2017 | 2017 Scotland sample size |
|---|---|---|---|---|---|
| Urban | Major | 91% | 98.5% | 99.4% | 1,399 |
| Minor | 94% | 98.3% | 98.3% | 1,443 | |
| All | 93% | 98.4% | 98.6% | 2,842 | |
| Rural | Major | 96% | 97.5% | 98.4% | 1,327 |
| Minor | 95% | 97.6% | 99.6% | 228 | |
| All | 96% | 97.5% | 98.5% | 1,555 |
Seatbelt use was 98.6% or higher for front seat passengers for all categories of road and area.
Figure 3.2

3.6. Seatbelt use by time of day
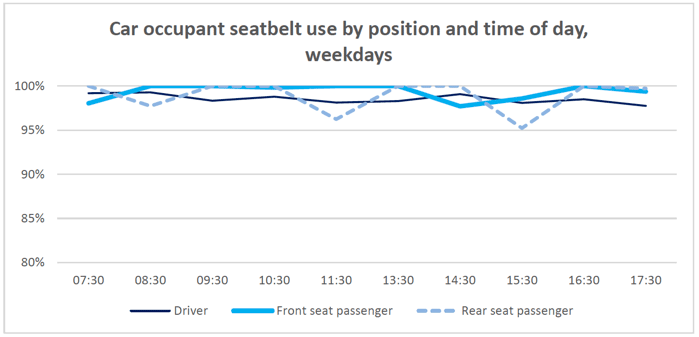
Analysis of seatbelt use at different times of the day found that wearing rates were above 95% for all occupants types at all points throughout the day.
Figure 3.3

3.7. Seatbelt use by time of week
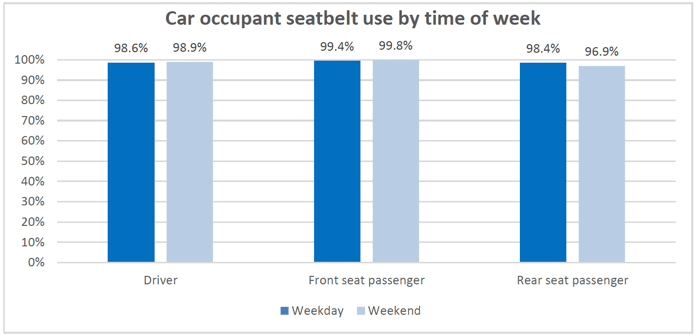
A selected number of observation sites were also surveyed at the weekend. At these sites, similar levels of seatbelt use was found on weekdays and weekends, with a slight increase at weekends for drivers and front seat passengers. For rear seat passengers however, the weekend brought a decrease in seatbelt use from 98.4% to 96.9%.
| Weekday | Sample size | Weekend | Sample size | |
|---|---|---|---|---|
| Driver | 98.6% | 4,397 | 98.9% | 2,383 |
| Front seat passenger | 99.4% | 1,209 | 99.8% | 1,074 |
| Rear seat passenger | 98.4% | 352 | 96.9% | 421 |
Again, it is worth noting the significantly smaller sample sizes for rear seat passengers.
Figure 3.4
